Bury set to shake up the League Two automatic spots

A years a long time in football. Following a disastrous relegation season last year things are looking up for Bury. Whisper it quietly but the Shakers should be targetting the third automatic spot and a swift return to League One football.

Rewind to 2017/18 and the season started with an opening day victory over Walsall which was ultimately proved to be just one of eight victories during the whole league campaign. By September the Shakers were in the dreaded relegation zone and remained there until the end of the season.

2017/18 Bury Managerial Record

The season started with Lee Clark as the man in charge before the managerial axe was swung at the end of October following four consecutive defeats. Ryan Lowe, Bury stalwart in the 2010’s, deputised for three league games until Chris Lucketti, Bury stalwart during the 1990’s, was appointed for his first managerial job. His disastrous campaign lasted less than three months. Shockingly the Shakers failed to score in any of the eight league games he oversaw. This had all but consigned a return to League Two football before Lowe had a second stint which ultimately lasted until the end of the season.

Matches Wins Draws Losses GF GA Points Pts per Game
Clark 16 3 3 10 17 24 12 0.8
Lowe (1st) 3 1 1 1 2 4 4 1.3
Lucketti 8 0 1 7 0 14 1 0.1
Lowe (2nd) 19 4 7 8 22 29 19 1.0

Lowe started his second stint with 13 points in the first eight games providing a glimmer of hope before seven consecutive defeats confirmed the inevitable relegation four games before the end of the season. Ironically with the shackles off the Shakers the season ended with a four game unbeaten run featuring a point at third placed Shrewsbury and a home win against current League One leaders Portsmouth.

2017/18 League One Table

Bury finished bottom of the table on 36 points, a mere 15 points from safety. The fewest number of wins and the fewest numbers of goals scored providing damning statistics that validated the finishing position. However, delve a little deeper and the performances (using expected goals or xG) did not match results.

For those not familiar with xG this is a metric to monitor the quality of goalscoring chances. A value between 0 and 1 is assigned based on the probability the chance will result in a goal. A 1 in 20 long range shot with have a probability of 5% (an xG of 0.05) whereas a penalty has a 3 in 4 expectancy and therefore an xG of 0.75.

Team G W D L GF GA Pts xGF xGA xPts
Wigan Athletic 46 29 11 6 89 29 98 71 36 83.4
Blackburn Rovers 46 28 12 6 82 40 96 63 45 72.1
Shrewsbury Town 46 25 12 9 60 39 87 51 50 62.5
Rotherham United 46 24 7 15 73 53 79 66 48 74.1
Scunthorpe United 46 19 17 10 65 50 74 55 55 63.6
Charlton Athletic 46 20 11 15 58 51 71 54 52 63.7
Plymouth Argyle 46 19 11 16 58 59 68 49 61 56.5
Portsmouth 46 20 6 20 57 56 66 57 44 70.7
Peterborough United 46 17 13 16 68 60 64 59 62 61.2
Southend United 46 17 12 17 58 62 63 61 60 63.4
Bradford City 46 18 9 19 57 67 63 56 57 62.3
Blackpool 46 15 15 16 60 55 60 58 51 66.4
Bristol Rovers 46 16 11 19 60 66 59 56 56 62.6
Fleetwood Town 46 16 9 21 59 68 57 45 51 59.0
Doncaster Rovers 46 13 17 16 52 52 56 49 48 62.9
Gillingham 46 13 17 16 50 55 56 50 63 55.8
Oxford United 46 15 11 20 61 66 56 60 63 59.9
AFC Wimbledon 46 13 14 19 47 58 53 49 51 62.2
Walsall 46 13 13 20 53 66 52 46 60 53.7
Rochdale 46 11 18 17 49 57 51 57 55 63.8
Oldham Athletic 46 11 17 18 58 75 50 54 60 59.3
Northampton Town 46 12 11 23 43 77 47 47 67 52.6
MK Dons 46 11 12 23 43 69 45 48 61 54.7
Bury 46 8 12 26 41 71 36 57 61 61.3

Bury scored 41 goals but were expected to score 57 goals from the chances they created. Conversely, the 71 goals conceded should have only yielded 61 goals from the chances conceded. This tells us the Shakers experienced a severe underperformance at both ends of the pitch. A goal difference of -30 should have only been -4 and achieved a significantly higher points haul. My xG performance table rated Bury as the 15th strongest team in the league, yet a season in League Two beckoned.

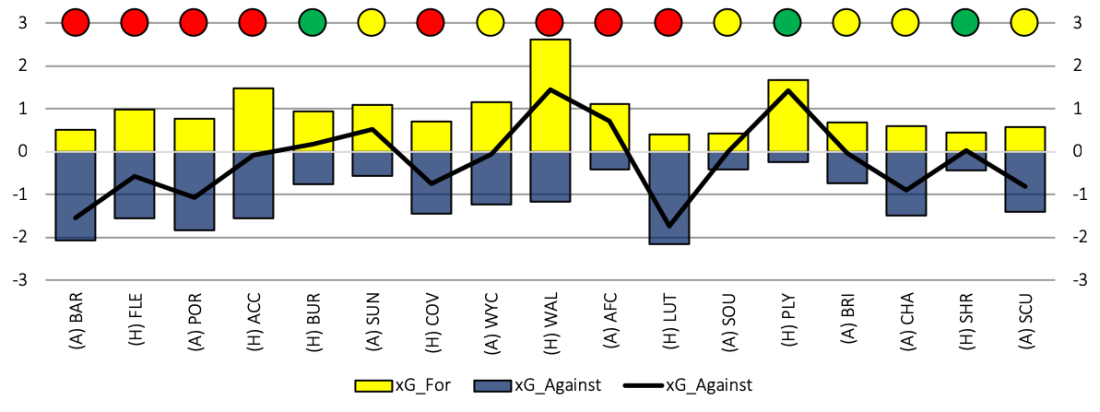
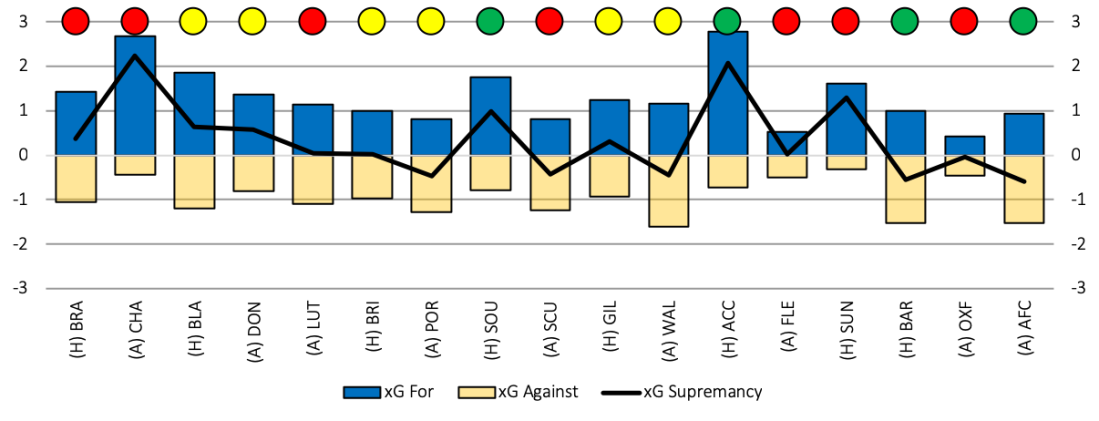
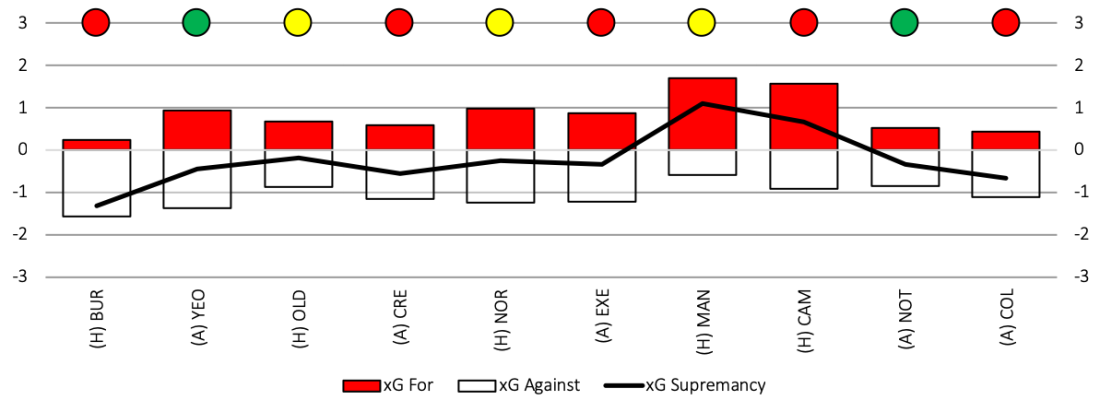
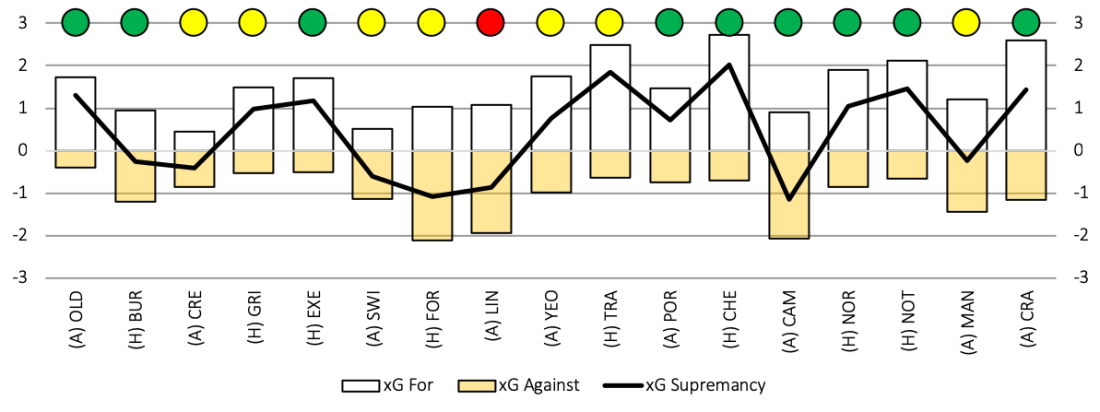
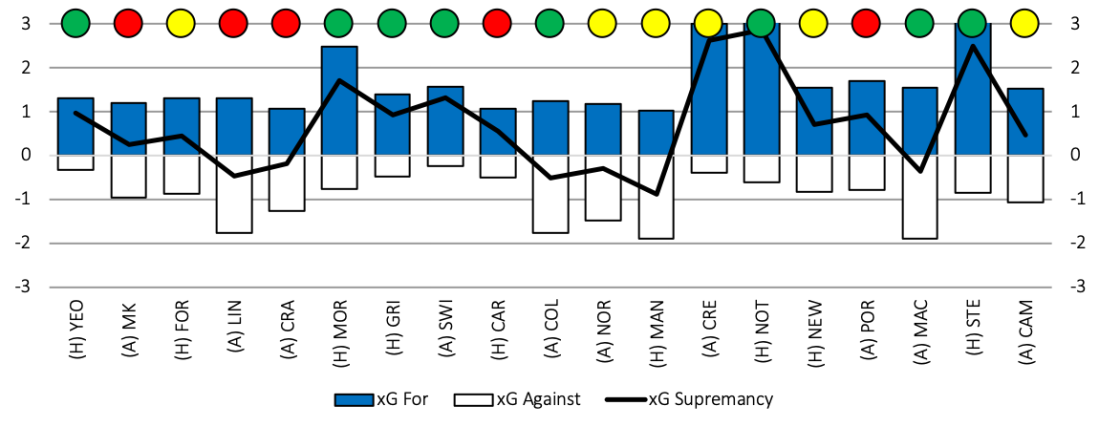
2018/19 Bury xG Performance by Match

Some football fans may have expected one difficult season to follow another, however the xG performance highlighted a team of mid League One quality and it is therefore no surprise to see Bury operating at the top end of the table. Performances have been strong with the Shakers outcreating the opponents based on xG in all but six of the games this season. Performances have been particularly impressive since October with dominant showings against Notts County and Stevenage the highlights.

Bury xG
Green = Win, Yellow = Draw, Red = Loss

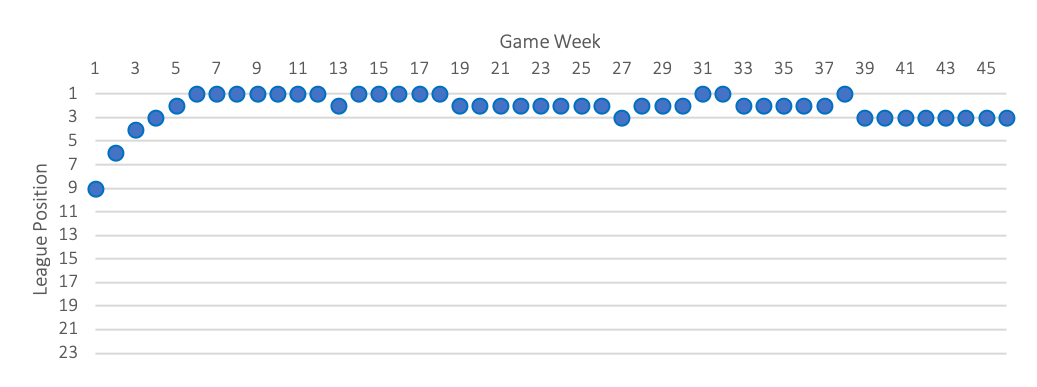
2018/19 League Two Table (as at 5th December 2018)

With both MK Dons and Lincoln City operating at the top of the table for the majority of the season Bury have somewhat gone under the radar but are slowing sneaking towards the third automatic spot. Personal expectations are that these will be the top three come the end of the season. Based on xG performance the Shakers are the strongest of the trio in thanks to the strongest attacking performance and third best defensive performance to date.

Team G W D L GF GA Pts xGF xGA xPts
MK Dons 20 11 7 2 30 13 40 31 21 32.4
Lincoln City 19 11 5 3 34 17 38 26 17 30.8
Colchester United 20 10 5 5 33 19 35 25 20 29.4
Newport County 20 10 5 5 31 32 35 28 23 30.6
Bury 20 9 6 5 39 21 33 34 19 34.2
Mansfield Town 19 7 11 1 27 14 32 27 18 30.2
Exeter City 20 8 7 5 29 21 31 26 24 27.4
Tranmere Rovers 20 8 7 5 30 25 31 24 25 26.9
Stevenage 20 9 4 7 26 25 31 23 27 25.2
Forest Green Rovers 20 7 9 4 28 20 30 23 23 27.8
Carlisle United 20 8 3 9 25 25 27 23 25 26.3
Swindon Town 20 7 6 7 23 28 27 23 24 26.7
Oldham Athletic 20 6 8 6 26 21 26 23 21 28.5
Crawley Town 19 8 2 9 27 30 26 25 25 26.2
Crewe Alexandra 20 7 4 9 21 24 25 19 26 23.7
Port Vale 20 7 4 9 20 23 25 25 26 27.1
Northampton Town 20 5 8 7 25 28 23 30 23 31.3
Grimsby Town 20 6 4 10 19 28 22 21 32 21.0
Yeovil Town 18 5 6 7 23 22 21 23 22 24.9
Morecambe 20 6 3 11 19 32 21 20 28 23.2
Cambridge United 20 5 4 11 19 34 19 23 26 25.9
Cheltenham Town 19 4 5 10 18 30 17 20 28 21.6
Notts County 20 3 7 10 22 41 16 22 30 23.1
Macclesfield Town 20 3 4 13 16 37 13 23 30 23.6

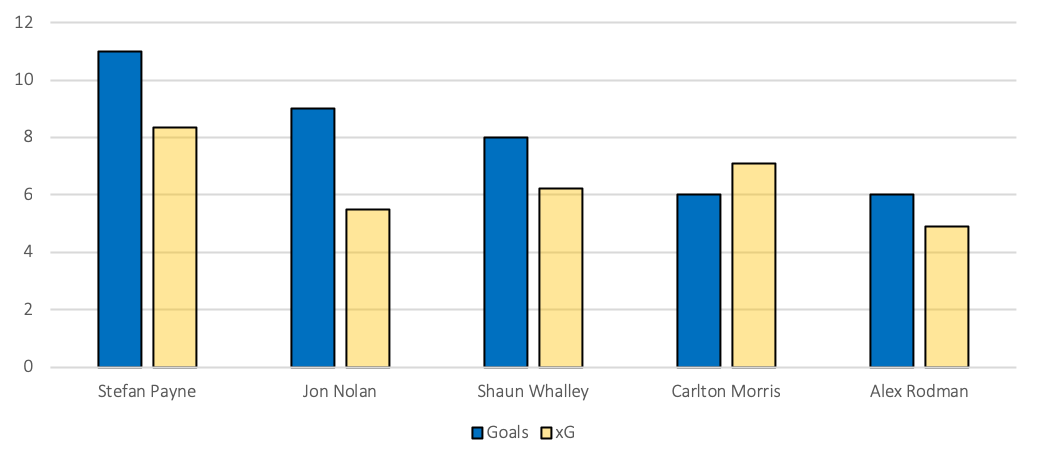
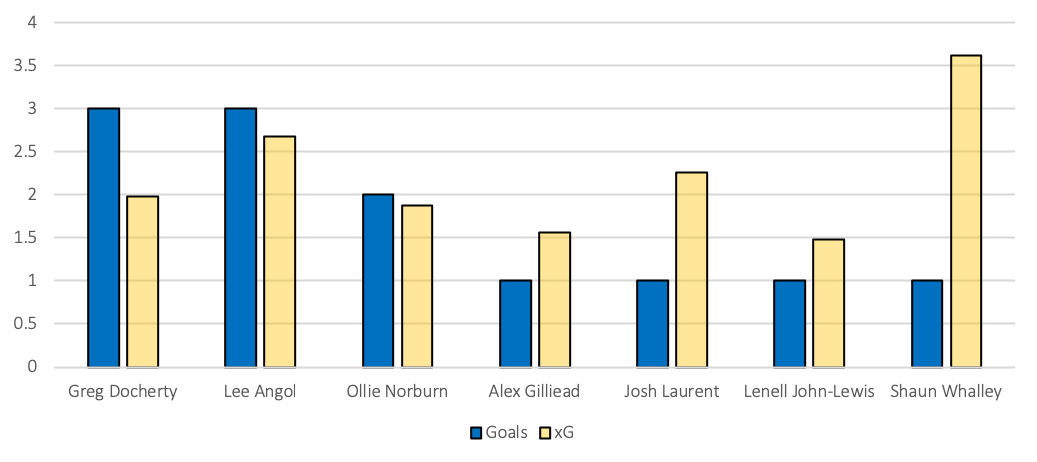
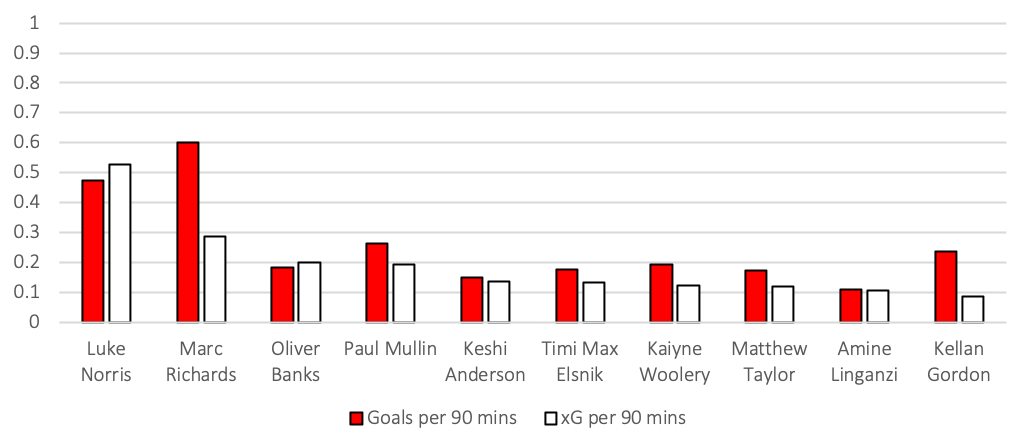
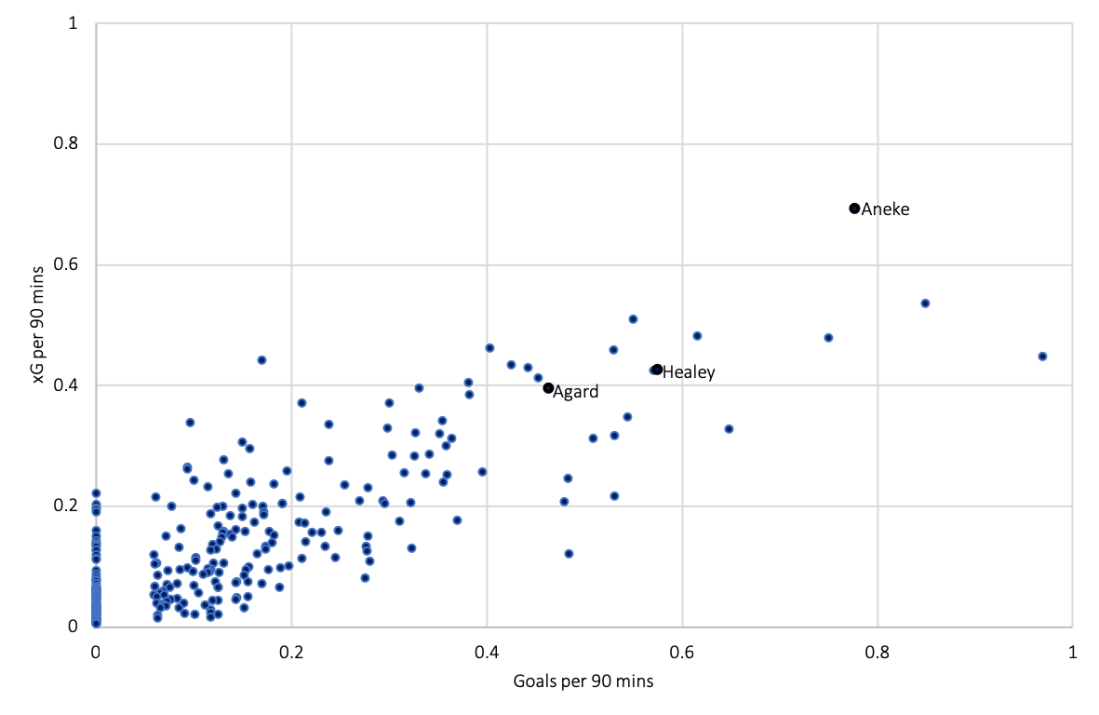
2018/2019 Bury Attacking Performance

Nicky Maynard, signed on a free transfer at the end of September, has quite rightly grabbed the headlines and led the strong attacking performance. His eight goals in 11 games will have left many League One/League Two fans scratching their heads as to why their club did not snap up a player who has predominately spent his career in the Championship. He is currently overperforming xG by more than three goals though so expect the goalscoring to slow somewhat in the coming months. With able deputies the goals should continue to flow for the Shakers.

Bury Strikers

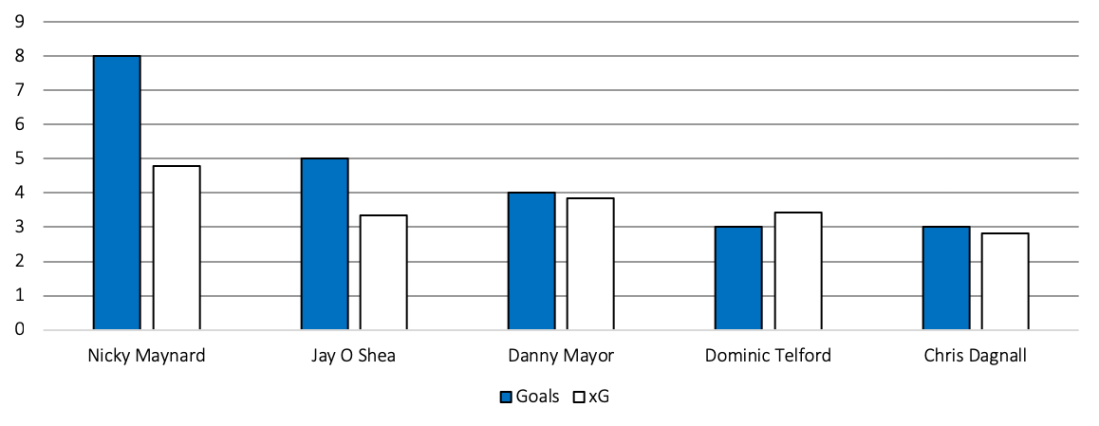
In particular, Dominic Telford is the one who catches the eye. The 22 year old striker signed on a free transfer from Stoke in the summer and looks to have a promising future. He’s only played a third of the league minutes but performances have been greater whilst he’s been on the pitch. Expected goals conceded have been similar with and without him but the team have produced superior goal scoring chances with him in the team, on average an additional half a goal per match.

Minutes GF per 90 GA per 90 xGF per 90 xGA per 90
Bury 2018/19 1800 2.0 1.1 1.7 1.0
with Dominic Telford 644 2.5 1.5 2.1 1.1
without Telford 1156 1.6 0.8 1.5 0.9

A further five goals scored in cup competitions highlights his goalscoring prowess and it is somewhat a surprise he has not been handed more league minutes. Expect him to feature more during the busy festive period and it would be no surprise to see more league goals follow.

Pride normally comes before a fall but this time a fall (to League Two) may be followed by pride (of automatic redemption).

Captain Marvel Mousinho Driving Oxford United Away From Relegation Danger

Starting the campaign with four successive league defeats was hardly the start Karl Robinson and the Oxford United fans were expecting. 12 games in and a total points of 6 points was no better for a side looking to make a promotion push this season.

The pressure was well and truly on Robinson by the middle of October when Oxford (24th) faced Plymouth (23rd) in an early season six-pointer at the Kassam Stadium. Defeat for the yellows and there might have been no way back for Robinson. In the end a 2-0 victory has kick started the season with the yellows picking up 10 points in an unbeaten 6 game spell.

The danger isn’t over yet with Oxford still remaining in the relegation spot so with a squad packed with attacking quality in the form of Ricky Holmes, James Henry, Gavin Whyte and Marcus Browne, and one of the best goalkeepers in the league in Simon Eastwood – why did it go so wrong for so long?

Karl Robinson and the 4-2-3-1

Formations
Karl Robinson’s trusted 4-2-3-1 with three personnel setups

Followers of the EFL will know Karl Robinson is a massive fan of the 4-2-3-1 favouring the formation for most of his managerial career to date. It’s been no different while at Oxford with Robinson starting the season at Oakwell with Rob Dickie and Curtis Nelson as the centre back partnership. Josh Ruffels and Cameron Brannagan were chosen to provide the stability, both defensively and offensively, as the two sitting midfielders however, 3 games played and 10 goals conceded highlighted defensive frailty.

In an effort to strengthen the defence changes were made. Jamie Hanson came into midfield with John Mousinho replacing Dickie to reform the favoured defensive partnership from last season. The pair played the next 7 games together and while the performances did improve (5 points picked up) the team still conceded 11 goals. One last roll of the dice needed.

Oxford United Performance with and without John Mousinho

Mins GF GA GF per 90 GA per 90
Oxford United 1530 20 27 1.2 1.6
without John Mousinho 360 2 12 0.5 3.0
with John Mousinho (Defender) 630 9 11 1.3 1.6
with John Mousinho (Midfielder) 540 9 4 1.5 0.7

For those that didn’t know John Mousinho started his career at Brentford as a central midfielder. This remained through spells at Wycombe, Stevenage and Preston until he signed for Burton Albion at the start of the 2014/15 season. It was only here that manager Gary Rowett converted Mousinho into the central defender the yellows fans were more familiar.

The decision by Robinson to move Mousinho back into midfield has proved inspired. In the six games that followed Oxford have kept four clean sheets which has provided the foundations to pick up points more regularly. The yellows have won both home games while drawing all four away games at a rate playoff pushing teams would be happy with.

League One Table (as at 16th November 2018)

This all sounds very optimistic ahead of another home crunch clash to fellow bottom half strugglers Gillingham on Saturday, however performances haven’t necessarily followed performances. Oxford sit 21st in the table however are only slightly higher in 16th using expected goals (or xG) performance.

For those not familiar with xG this is a metric to monitor the quality of goalscoring chances. A value between 0 and 1 is assigned based on the probability the chance will result in a goal. A 1 in 20 long range shot with have a probability of 5% (an xG of 0.05) whereas a penalty has a 3 in 4 expectancy and therefore an xG of 0.75.

Team G W D L GF GA GD Pts xGF xGA xGD xPts
Portsmouth 17 11 5 1 28 14 14 38 23 18 4 25.8
Sunderland 16 10 5 1 32 13 19 35 18 19 -1 20.9
Peterborough 17 10 3 4 33 22 11 33 20 26 -6 19.7
Barnsley 16 9 4 3 29 14 15 31 25 14 11 28.4
Luton Town 17 8 5 4 27 19 8 29 24 17 7 27.7
Charlton Athletic 17 8 4 5 26 20 6 28 23 22 1 24.5
Accrington 17 7 7 3 21 19 2 28 22 23 0 23.5
Coventry City 17 8 4 5 20 18 2 28 22 20 2 24.7
Blackpool 16 6 7 3 18 15 3 25 21 19 3 23.1
Doncaster Rovers 17 7 4 6 25 24 1 25 26 22 4 25.5
Walsall 17 7 4 6 19 24 -5 25 20 28 -8 18.5
Fleetwood Town 17 6 5 6 24 19 5 23 14 20 -5 19.7
Southend United 17 7 2 8 21 22 -1 23 22 18 5 25.4
Burton Albion 16 6 3 7 22 22 0 21 22 18 4 24.0
Wycombe 17 5 6 6 23 24 -1 21 20 22 -2 21.7
Rochdale 17 5 5 7 22 31 -9 20 25 23 3 24.7
Gillingham 17 5 3 9 26 29 -3 18 20 26 -6 20.6
Shrewsbury Town 17 4 6 7 16 20 -4 18 23 16 6 26.2
Scunthorpe 17 4 6 7 26 37 -11 18 21 26 -5 20.1
Bristol Rovers 17 4 5 8 14 14 0 17 21 18 3 25.4
Oxford United 17 3 6 8 20 27 -7 15 16 19 -3 21.1
Plymouth Argyle 17 3 4 10 18 29 -11 13 18 29 -11 16.9
AFC Wimbledon 17 3 2 12 11 26 -15 11 24 18 6 26.7
Bradford City 17 3 1 13 12 31 -19 10 18 28 -11 17.6

Although Oxford have only been expected to concede as many goals as league leaders Portsmouth, expected goals scored are the lowest in the league. The problem lies in that for all the neat and tidy build up play from the 3 creative midfielders behind the striker, not many high quality chances are being created.

Oxford United xG Performance by Match

Oxford’s top goalscorer has just three goals with centre half Curtis Nelson (2) scoring as many as strikers Jonathan Obika (1), Jamie Mackie (1) and Sam Smith (0) have managed between them. Away from the Kassam Stadium the tactic in recent weeks has been to successfully stifle opponents, as shown in away performances against Southend and Bristol Rovers, however this has been at a cost of creating very little chances to actually score and win the match.

xG by Match
Green = Win, Yellow = Draw, Red = Loss

Even the comprehensive 3-0 win at home to Shrewsbury shows the yellows took the chances they created and made little else. When January comes around the Oxford fans will be hoping and expecting attacking additions will made to build on the improved defence performance by Mousinho and co. If not then expect 0-0 to be the most common score line from now until the end of the season.

Incoming Shrews Boss to Lead Salop to a Mid Table Finish

From one STFC managerial departure to another. The week started with Swindon Town climbing aboard the managerial merry go round before further stops at AFC Wimbledon, Shrewsbury Town and Notts County. John Askey, formerly manager of Shrewsbury Town, lost his post on Tuesday with the Shrews languishing in 18th in League One.

Rewind six months and the club was standing on the brink of Championship football for the first time in the clubs history with just Rotherham United and one-off match at Wembley standing between them. At the start of the 2017/18 season Shrewsbury were unfancied and unconsidered for promotion. Amongst the favourites for relegation, Paul Hurst’s outfit outdid all expectations to top the table for large sections of the season ultimately finishing in third unable to keep pace with Blackburn’s blistering finish.

Shrewsbury Town 2017/18 League Position by Game Week

2017-18 League Position by Weekpng

2017/18 League One Table (Top 6 Finishers)

While results were strong, performances as measured by Expected Goals (or xG) told a completely different story. A goal difference of +21 was a considerable overperformance compared to an xGD of +1. Based on the performance metrics Shrewsbury were only the 12th best team in the league. Wigan Athletic, Rotherham United and Blackburn Rovers performed strongest on the performance metrics and all playing Championship football this season.

G W D L GF GA GD Pts xGF xGA xPts
Wigan Athletic 46 29 11 6 89 29 60 98 71 36 83.4
Blackburn Rovers 46 28 12 6 82 40 42 96 63 45 72.1
Shrewsbury Town 46 25 12 9 60 39 21 87 51 50 62.5
Rotherham United 46 24 7 15 73 53 20 79 66 48 74.1
Scunthorpe United 46 19 17 10 65 50 15 74 55 55 63.6
Charlton Athletic 46 20 11 15 58 51 7 71 54 52 63.7

2017/18 Attacking Performance

Overperformance was at both ends of the pitch with goals scored 9 higher than expected and goals conceded 11 fewer than expected. The Shrews’ strong season was built on goals coming from multiple sources with the top 5 league scorers displayed below.

2017-18 Goals xG

It’s particularly eye catching that four of the five scored more goals than expected, an overperformance due to above expected finishing, below expected goalkeeping or most likely a combination of the two. It’s unlikely any of the five players listed above are the calibre of Lionel Messi and therefore this level of goalscoring output was unlikely to be maintained into the 2018/19 season.

Worse for the Shrews was what actually happened. Paul Hurst moved on to new pastures at Ipswich Town taking Jon Nolan with him. Stefan Payne and Alex Rodman both moved to Bristol Rovers and Carlton Morris returned back to parent club Norwich City. Dean Henderson, the 20 year old goalkeeper on loan from Manchester United, impressed hugely, so much so that Championship club Sheffield United came calling for his next loan spell where he continues to shine.

John Askey was appointed the impossible task of building on the successful season with most of the attacking output departed. His previous assignment had led Macclesfield Town to the National League title and a return to the Football League.

2018/19 Shrewsbury Town xG Performance by Match

2018-19 Shrews xG
Green = Win, Yellow = Draw, Red = Loss

The season started badly with 0 wins in 7 but the performances deserved more, much more. The Shrews outcreated the opponents in the first four matches with only the away trip to the south coast against Portsmouth showing signs of potential vulnerability. 14 points from the next 10 games is mid table form however the poor start meant it was still a case of looking over their shoulder rather than up the league table.

Performances continued to be positive in particular at home where the Shrews significantly outcreated Southend, Accrington and Sunderland. xG has Shrewsbury down as a playoff team this season, quite the contrast of last year, although the fans might argue this does not pass the eye test.

2018/2019 Attacking Performance

Whereas last season showed an attacking unit that overperformed, the opposite is true of this season. Both Josh Laurent and Shaun Whalley have a goal apiece but should have a collective scored almost six goals. A difference of four goals may not seem much but could have converted a loss into a draw, or a draw into a win with the extra points cementing a mid table position.

2018-19 Goals xG

The underperformance of xG is typically attributed to bad fortune and a combination of poor finishing and good goalkeeping. If I was a manager the Shrewsbury job would look very attractive right now, a lot more appealing than the impossible job in the summer. The squad is underperforming and the expected reversal in goalscoring output in the coming months for Laurent and Whalley especially will likely lead the Shrews to a safe mid table finish and positive reflection of the incoming manager.


The Power’s Off For Phil Brown As Swindon Bring In Wellens

The managerial axe has been well and truly swung this week. Following last week’s upbeat article about Paul Tisdale’s MK Dons (here for those who missed it), no less than four EFL bosses have lost their managerial post and it’s only Tuesday.

News broke on Sunday evening that Swindon chairman, Lee Power, had dispersed with manager Phil Brown & assistant Neil McDonald with the club currently sitting 17th in League Two. From Twitter two main themes developed: firstly the Swindon fans were glad to see the back of Phil Brown and secondly Lee Power is equally as unpopular following a string of poor managerial appointments and lack of transfer ambitions.

After just falling short of the playoffs last season, Swindon started this one with expectations of a playoff spot at a minimum. Without Coventry and Luton (both achieving promotion last season), Swindon were left as one of the biggest clubs in the league with only title challengers Lincoln and MK Dons having higher average attendances. So where did it all go wrong?

League Two Table (as at 13th November 2018)

Team G W D L GF GA GD Pts xGF xGA xPts
Lincoln City 17 11 3 3 32 15 17 36 24 16 27.8
MK Dons 17 9 7 1 24 10 14 34 26 18 27.5
Colchester United 17 9 4 4 31 16 15 31 22 17 25.9
Tranmere Rovers 17 8 6 3 25 16 9 30 21 21 23.3
Exeter City 17 8 5 4 26 17 9 29 22 20 24.1
Newport County 17 8 5 4 25 29 -4 29 24 20 25.6
Mansfield Town 17 6 10 1 25 13 12 28 24 17 26.5
Stevenage 17 8 4 5 21 16 5 28 20 20 23.1
Forest Green Rovers 17 6 9 2 26 17 9 27 20 20 23.7
Bury 17 7 5 5 29 18 11 26 27 17 28.0
Carlisle United 17 7 2 8 19 22 -3 23 17 23 20.6
Crawley Town 17 7 2 8 24 29 -5 23 23 23 23.5
Port Vale 17 6 4 7 17 21 -4 22 22 22 23.5
Yeovil Town 16 5 6 5 23 18 5 21 21 18 23.3
Oldham Athletic 17 5 6 6 21 18 3 21 20 19 24.2
Northampton Town 17 5 6 6 20 21 -1 21 26 20 26.8
Swindon Town 17 5 6 6 19 22 -3 21 18 22 21.6
Crewe Alexandra 17 5 4 8 16 19 -3 19 16 22 19.7
Cambridge United 17 5 3 9 16 27 -11 18 21 22 23.0
Morecambe 17 5 2 10 17 29 -12 17 17 24 19.6
Grimsby Town 17 4 3 10 11 24 -13 15 16 28 16.2
Notts County 17 3 5 9 20 36 -16 14 19 26 19.8
Cheltenham Town 16 2 5 9 12 25 -13 11 17 23 18.6
Macclesfield Town 17 1 4 12 14 35 -21 7 19 26 19.3

The league table shows Swindon 6 places above the relegation zone, and on this instance the league table doesn’t lie. Based on Expected Goals (or xG) Swindon are exactly where they deserved to be. xG For are within one of the actual goals while xG Against are exactly as expected.

For those not familiar with xG this is a metric to monitor the quality of goalscoring chances. A value between 0 and 1 is assigned based on the probability the chance will result in a goal. A 1 in 20 long range shot with have a probability of 5% (an xG of 0.05) whereas a penalty has a 3 in 4 expectancy and therefore an xG of 0.75.

It’s likely Swindon’s start to the 2018/19 season was the most eventful in the Football League. The season opened with a 3-2 home win against struggling Macclesfield Town with 96′ and 98′ minute penalties converted. A 4-1 thrashing from Lincoln was followed by another 3-2 home victory with Tranmere taking an early 2-0 lead before being reduced to 10 men.

There was also a 2-2 draw away to Crawley with 2 red cards in 2 minutes for the Robins, and 2 points lost with the hosts securing a point with a 99′ minute equaliser. Home to MK Dons was a point gained with a 94′ minute equaliser this time. Eventful entertainment but not the solid consistency typical of a promotion challenger.

Swindon Town xG Performance by Match (Last 10 Matches)

A return of 9 points in the last 10 games was ultimately the downfall for Phil Brown with a string of poor performances. The Robins were out created in 8 of those matches with a lack of a goalscoring threat exposed in multiple matches.

Swindon L10 xG.png
Green = Win, Yellow = Draw, Red = Loss

Swindon Town Goals Scored (Rolling 6 Game Average)

During David Flitcroft’s tenure Swindon were consistently averaging 1.5 goals per game  until his late season switch to fellow playoff hopefuls Mansfield. Phil Brown took the reins in March 2018 but was unable to secure a playoff spot with the average goals per game reducing to just 1.2. Since the open goalfests witnessed at the start of the season, the Robins have looked more goal shy than ever.

Swindon Goal Scoredpng
Blue Shade = David Flitcroft; Red Shade = Phil Brown

Swindon Town 2017/18 Season Goals and xG per 90 minutes

Last season Swindon relied of Luke Norris and Marc Richards for goals with the pair scoring 13 and 11 goals respectively. Richards’ achievement the more remarkable since he only joined in January 2018 following his release from Northampton. His 0.6 goals per 90 minutes was excellent however his xG per 90 minutes were considerably lower. His overperformance was unsustainable and without factoring in his age (Richards turned 36 in the summer) his goal output would have been expected to decrease this season.

Luke Norris, 25 years old in the summer, scored just as impressive 0.5 goals per 90 minutes and actually underperformed xG. His goalscoring output was considerably higher than his teammates and so it was somewhat surprising he was allowed to move on to Colchester, a fellow League Two challenger.

Swindon Strikers 2017-18

2018/19 Season Goals and xG per 90 minutes

Fast forward to this season and it’s not surprise to see Norris maintain his goal scoring performance whilst Richards has struggled. It would be interesting to know whether the Robins would be in such a predicament had Norris remained at the County Ground in the summer.

Player Matches Minutes Goals Goals per 90 mins xG xG per 90 mins
Luke Norris 15 1023 7 0.6 5.5 0.5
Marc Richards 15 1042 1 0.1 1.9 0.2

Looking Ahead

Back to Swindon and the timing of the sacking, a day after a 2-1 FA Cup win against York, implied Power has lined up his man and so it proved with Richie Wellens appointed on Tuesday morning. Noel Hunt, ex-Reading striker, has been appointed assistant manager. He joins from Waterford, Lee Power’s other club, where he was a player coach.

The appointment was deemed uninspiring with Wellens’ sole venture into management at Oldham ending with last day relegation, however both on the field (namely the pitch itself) and off the field issues were cited as plausible reasons for the poor season. Working under those circumstances would be tricky for any manager let alone one at his first managerial job.

Swindon have historically performed well with managers cutting their teeth (Lou Macari, Ossie Ardiles, Glenn Hoddle, Dennis Wise) and so it may prove to be an inspired choice. The 6 week gap until the transfer window may prove a blessing giving Wellens amble time to see which of the current squad is suitable for the attacking brand of football promised before January reinforcements can be brought in.

Seven points away from 7th indicate ambitions of the playoffs are achievable however they may ultimately prove unrealistic this season. Given time and backing Wellens may be the man to bring back the success the fans’ so desperately desire.

Tisdale’s Terrifying Trio To Secure MK Dons League One Return

Hello… This is my first football blog, heck it’s my first ever blog article full stop and no better place to start then the depths of League Two football and a team seeking immediate redemption.

It’s safe to say MK Dons had a pretty disappointing year in League One finishing 23rd with both managers Robbie Neilson and Dan Micciche leaving during the season. At the start of the summer Pete Winkleman, MK Dons chairman, promptly appointed a man with vast experience of League Two in Paul Tisdale and tasked him with a return to League One and beyond.

The squad was freshened up with Edward Upson and Scott Wotton the main squad members leaving to remain in League One with Plymouth and Bristol Rovers respectively.  Notable inbounds included midfielder Jordan Houghton (free transfer from Chelsea) and centre backs Jordan Moore-Taylor (free transfer from Tisdale’s previous managerial job at Exeter) and Baily Cargill (free transfer from Bournemouth) who have all quickly formed part of the strong nucleus.

If optimism of a successful season had returned in August (5/1 to win the league) then this has only been solidified by the start of November (currently 5/2 to win the league). The Dons currently sit in second place and deservedly so. Only Lincoln and Bury outrank them on xG performance metrics.

League Two Table (as at 4th November 2018)

Team G W D L GF GA GD Pts xGF xGA xPts
Lincoln City 17 11 3 3 32 15 17 36 24 16 27.8
MK Dons 17 9 7 1 24 10 14 34 26 18 27.5
Colchester United 17 9 4 4 31 16 15 31 22 17 25.9
Tranmere Rovers 17 8 6 3 25 16 9 30 22 21 23.3
Newport County 17 8 5 4 25 29 -4 29 24 20 25.6
Exeter City 17 8 5 4 26 17 9 29 22 20 24.1
Stevenage 17 8 4 5 21 16 5 28 20 20 23.1
Forest Green Rovers 17 6 9 2 26 17 9 27 20 20 23.7
Bury 17 7 5 5 28 18 10 26 27 17 28.0
Mansfield Town 16 5 10 1 23 12 11 25 21 16 24.2
Crawley Town 17 7 2 8 24 29 -5 23 23 23 23.5
Carlisle United 17 7 2 8 19 22 -3 23 17 23 20.6
Port Vale 17 6 4 7 17 21 -4 22 23 23 23.5
Northampton Town 17 5 6 6 20 21 -1 21 26 20 26.8
Yeovil Town 16 5 6 5 23 18 5 21 21 18 23.3
Swindon Town 17 5 6 6 19 22 -3 21 18 22 21.6
Oldham Athletic 16 5 5 6 21 18 3 20 19 18 22.3
Crewe Alexandra 17 5 4 8 16 19 -3 19 16 22 19.7
Cambridge United 17 5 3 9 16 27 -11 18 21 22 23.0
Morecambe 17 5 2 10 17 29 -12 17 17 24 19.6
Grimsby Town 16 4 3 9 10 21 -11 15 15 25 15.7
Notts County 16 3 4 9 20 36 -16 13 18 25 19.0
Cheltenham Town 16 2 5 9 12 25 -13 11 17 23 18.6
Macclesfield Town 17 1 4 12 14 35 -21 7 19 26 19.3

For those not familiar with xG (or Expected Goals) this is a metric to monitor the quality of goalscoring chances. A value between 0 and 1 is assigned based on the probability the chance will result in a goal. A 1 in 20 long range shot with have a probability of 5% (an xG of 0.05) whereas a penalty has a 3 in 4 expectancy and therefore an xG of 0.75.

MK Dons xG Performance by Match

Back to MK Dons and 8 games in with a record of 3-4-1 (13 points) was a good start to season. However, 6 different reported starting formations and underwhelming performances had left some question marks. MK Dons were out created in 5 of those games based on xG culminating in a defeat away to fellow title challengers Lincoln.

MK Dons xG
Green = Win, Yellow = Draw, Red = Loss

MK Dons are unbeaten in 9 games since with performances picking up. Paul Tisdale has settled on three centre backs in a back 3/back 5 not often seen at League Two level. It’s entirely plausible that the team took time to adjust to the new ideas and now familiar with the system performances have improved. The Dons out created opponents in 7 of those games, and it’s notable in the last four games Tisdale has settled on a 3-4-3 which helped the team both on attacking (8 goals scored) and defensive (2 goals conceded) front putting in some of their best performances.

MK Dons Performance by Starting Formation

Starting Formation Matches GF per 90 GA per 90 xGF per 90 xGA per 90
5-3-2 4 1.8 0.3 1.4 1.2
3-4-3 5 1.8 0.4 1.8 1.1
4-3-3 2 1.0 0.5 1.1 0.6
3-5-2 4 1.0 0.8 1.7 1.1
3-4-1-2 1 1.0 1.0 1.5 0.5
3-5-1-1 1 1.0 2.0 1.1 1.9

With just 10 goals conceded in 17 games MK Dons have the best defensive record in the league. At the other end of the pitch, Tisdale has Kieran Agard, Chuks Aneke and Rhys Healey at his disposal – arguably the best attacking unit in the league.

League Two Attacking Performance

League 2 xG

To have one deadly striker at this level is helpful, having three means goals will be inevitable and it’s a little surprising the Dons have only scored 24 goals. Chuks Aneke is rightly receiving the plaudits with 7 goals scored, almost 0.8 per 90 minutes played. He’s leading the way based on xG per 90 minutes and should be able to maintain this level of scoring. At 25 years old it’s likely he’s playing the best football of his career and must be targeting a 20+ goal season.

Kieran Agard is the most experienced of the trio and has contributed 8 goals (6 scored and 2 assisted). Double figures is within reach and his goals will be just as important come the end of the season. Last (and most interestingly) is Rhys Healey, a 23 year old loanee from Cardiff. 6 goals in 17 appearances during a loan spell at Newport County two seasons ago earmarked Healey as one for the future and it was a slight surprise that he was only at National League level last year. Goals continued at Torquay scoring 6 goals in a short 8 game spell. A six month loan spell at the top of League Two will maintain his development and it is noticeable the transformation in MK Dons performances coincided with his addition into the team.

MK Dons Performance with and without Rhys Healey

Minutes GF per 90 GA per 90 xGF per 90 xGA per 90
MK Dons 1530 1.4 0.6 1.5 1.1
with Rhys Healey 782 1.7 0.7 1.8 1.1
without Rhys Healey 748 1.1 0.5 1.2 1.0

Signed late August 2018 Tisdale chose to slowly introduce the youngster and is now reaping the rewards. Playing as a wide attacker the 3-4-3 formation suits and the team’s goals and xG have noticeably increased without significantly impacting goals and xG conceded.

If the Dons maintain performances then League One football will surely return to the Stadium MK. The biggest worry being how many of the terrifying trio will still be there where the January transfer window shuts.