Sunderland, Expected Goals and a Josh Maja Hot Streak

In recent weeks and months I’ve read a couple of snippets posted on Twitter about Sunderland and their expected goals (xG) performance, namely from Mark O’Haire, George Elek and Ted Knuston, which has caused quite a reaction from parts of the Black Cats fanbase.

For what it’s worth here’s my take on how I rate Sunderland, why they are overperforming xG and whether it is sustainable.

NOTE: For those not familiar with xG this is a metric to monitor the quality of goalscoring chances. A value between 0 and 1 is assigned based on the probability the chance will result in a goal. A 1 in 20 long range shot with have a probability of 5% (an xG of 0.05) whereas a penalty has a 3 in 4 expectancy and therefore an xG of 0.75.

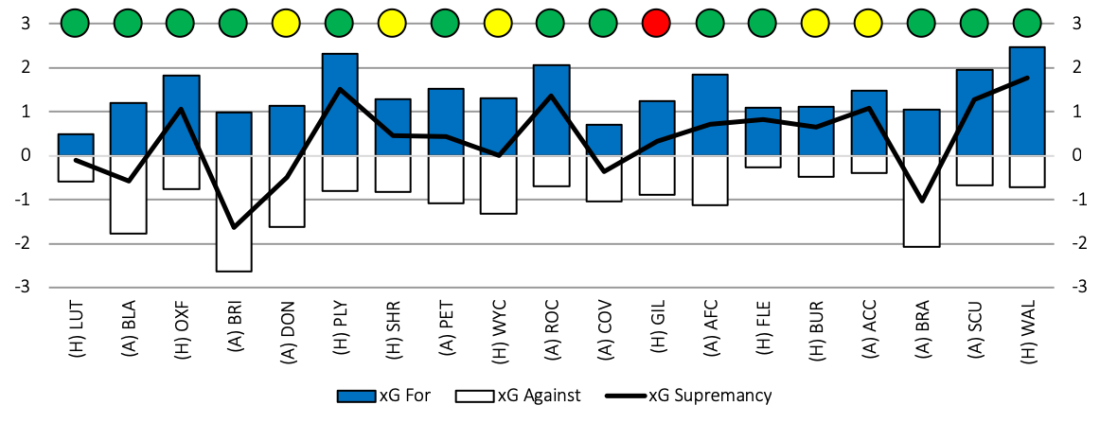
Sunderland 2018/19 xG Performance

GF GA GD Points Rank
Actual Performance 42 20 22 44 2nd
Expected Performance 24 25 -1 28 16th

My xG model, like others, ranks Sunderland considerably lower than the 2nd place they currently find themselves in. The area in particular which sticks out is the goals scored. In simple terms they were expected to score 24 goals from the chances created so far this season but have scored a whopping 42.

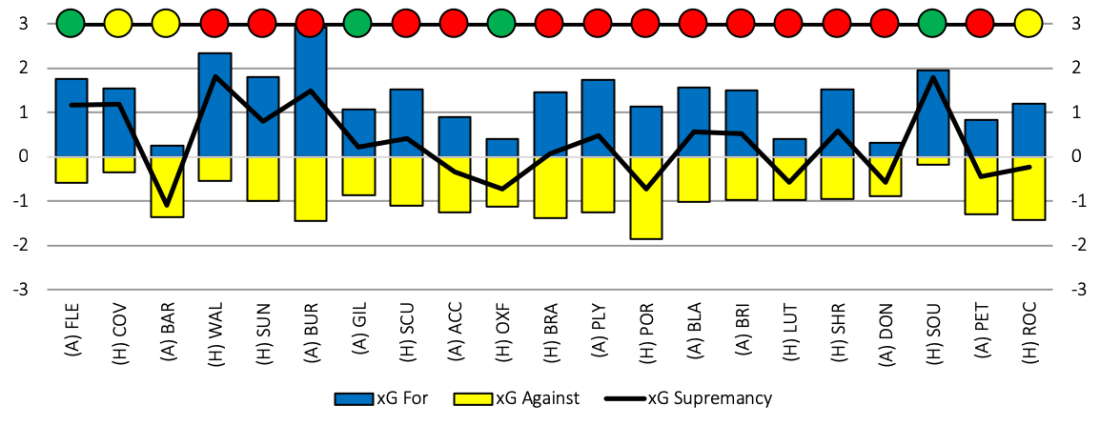
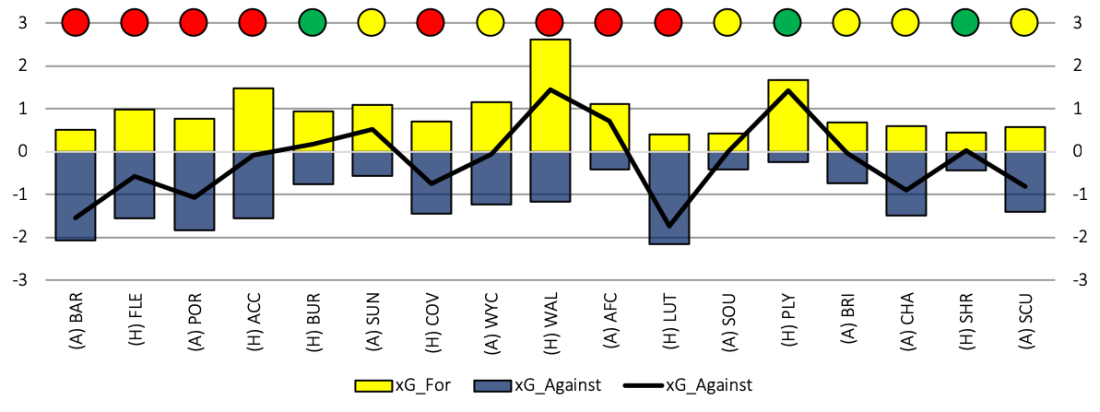
On a match by match basis, Sunderland have only outcreated opponents based on xG in 9 of the 21 games with a clear split between performances at home and away.

Sunderland xG
Green = Win, Yellow = Draw, Red = Loss

At the Stadium of Light performances have been strong, winning xG on 7 of the 10 matches, and reflecting the high points haul collected. Away from the North East they have only won xG on 2 of the 11 occasions and it is here when Sunderland appear to be vulnerable. The Black Cats have consistently conceded chances on the road which the opponents have failed to capitalise on.

Sunderland Shot Conversion

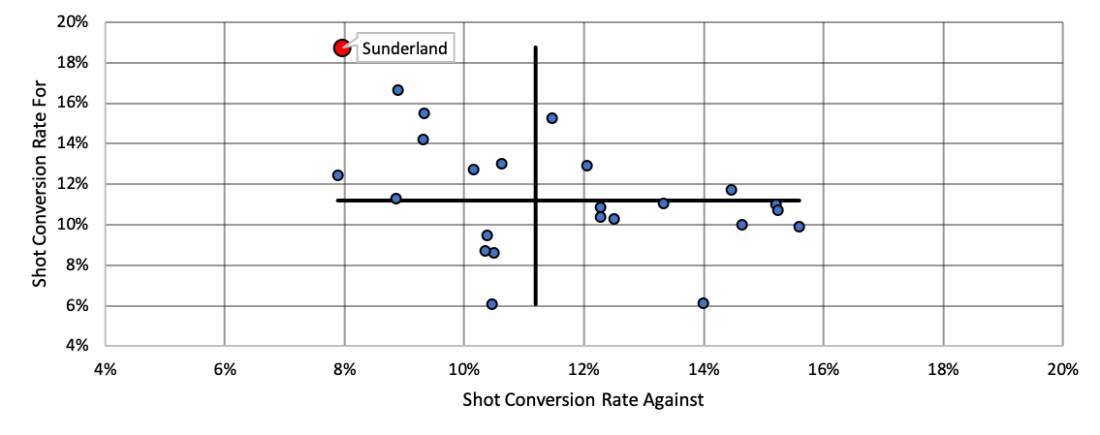
Looking purely at shot conversion rate, Sunderland’s opponent have the second lowest rate. At the other end of the pitch they are converting their chances into goals at the highest rate in the whole league. These numbers are why the Black Cats find themselves in the automatic spots heading into the festive period.

Those numbers look very good but as xG shows they are experiencing an overperformance particularly on the attacking side.

An xG overperformance in the short term is entirely feasible and actually quite common. Over the longer term one of two things tends to happen (i) the number of goals scored reverts back in line with expected goals or (ii) an increase in performance maintains the inflated level of goalscoring. Sunderland are an anomaly as we are now 22 games into the season (21 in Sunderland’s case) and so far, neither has happened.

So what’s driving this? Is Sunderland’s attack so superior to the remainder of the league that an xG model is not sufficiently capturing the quality of the squad?

Sunderland 2018/19 Shots

The first thing to point out is that Sunderland have been very accurate with the chances they have created.

Shots on Target % Rank
Sunderland 42.2% 3rd
League Average 37.2%

They rank third for shots on target behind only high performing Luton and fellow xG overperforming Peterborough. This may be due to a superior quality of player but has been aided by the high proportion of shots taken from around the penalty spot area (25%) compared to the remainder of the league (20%).

The problem why their expected goals scored is low is the number of attempts Sunderland have taken.

Number of Attempts Rank
Sunderland 223 21st
League Average 256

Only three teams have had fewer attempts. On the other hand, fellow promotion rivals Barnsley (321), Portsmouth (287) and Luton (281) all have a significantly higher number of attempts and hence are all rated superior by xG numbers. It may be that the attackers have been more selectively with chances, waiting for a better shooting position before pulling the trigger, something which won’t be captured in my xG model.

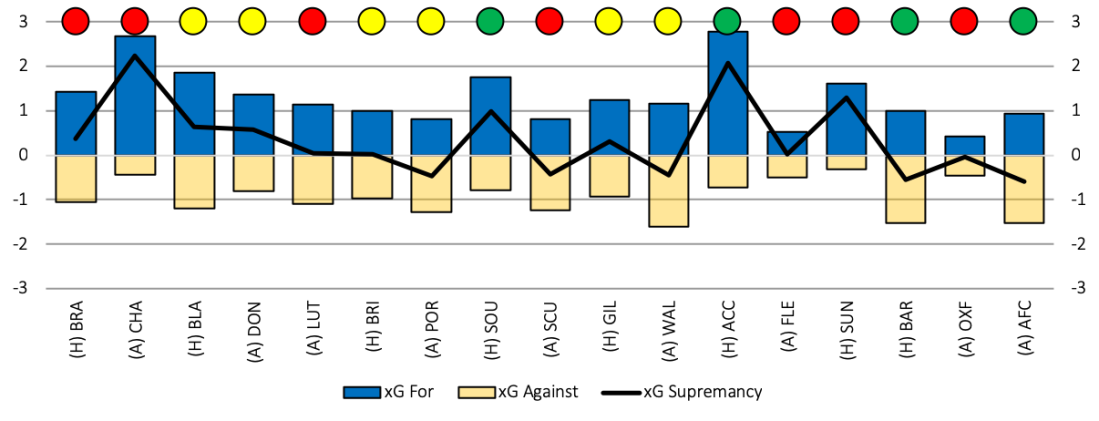
The resultant of so few shot attempts means Sunderland need to be clinical – and they have. As shown in the chart earlier no one is taking chances at the rate of the Black Cats.

Sunderland 2018/19 Attacking Performance

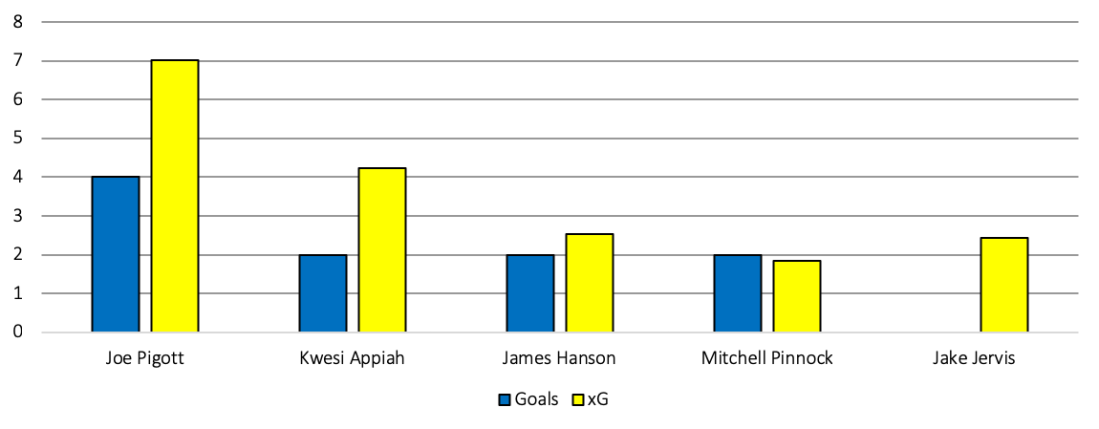
Josh Maja has been the standout performer in terms of goals with 12 in the league to date. Though a word of caution is that he has scored 8 goals more than expected using xG and is therefore experiencing a hot streak which is unlikely to continue. In addition, Maguire, Gooch, McGeady and Cattermole have added another 19 goals, a further 8 goals than expected using xG.

Looking at the players to score 10+ league goals this season Maja has the standout shot conversion.

Team Player Minutes Shots Goals Shot Conversion
Gillingham Thomas Eaves 1759 57 14 25%
Doncaster Rovers John Marquis 1980 59 12 20%
Rochdale Ian Henderson 1979 49 12 24%
Sunderland Josh Maja 1347 29 12 41%
Plymouth Argyle Freddie Ladapo 1770 53 11 21%
Charlton Athletic Karlan Ahearne-Grant 1711 38 11 29%
Barnsley Kieffer Moore 1656 66 11 17%
Charlton Athletic Lyle Taylor 1862 51 10 20%
Luton Town Elliot Lee 1593 61 10 16%
Peterborough United Matthew Godden 1556 36 10 28%

12 goals from 29 attempts (41%) is remarkable as the other top goalscorers range between 16% and 29%. To maintain this goalscoring performance Josh Maja will have to be one the best finisher the league has ever seen. Very unlikely.

He’s also be aided by team mates scoring low probability chances at a higher rate than expected as shown by a selection of videos below.

Gillingham Away

George Honeyman and Max Power score in quick successions to put Sunderland 3-1 up.

Peterborough Home

Josh Maja scoring through multiple bodies to put Sunderland 1-0 up.

Southend Home

Chris Maguire scoring a long range screamer to put Sunderland 2-0 up.

Plymouth Away

Aiden McGeady this time scoring from outside the box to put Sunderland 1-0 up.

The numbers say to me that Sunderland will experience a dip in results, most likely away from home, starting this weekend in the big game away at table toppers Portsmouth.

The Curious Case of AFC Wimbledon and Expected Goals

As a devout follower of expected goals (or xG) AFC Wimbledon are providing the biggest headache of all 72 teams in the Football League. When looking at the League One table no one is expecting to see them in the top half. When Neal Ardley lost his job in November after six years in charge no one screamed that the team were in a false position in the table. Yet on my xG performance metrics the Dons should have the fourth highest points total behind only promotion chasing Luton, Barnsley and Portsmouth.

They actually find themselves in 23rd place, six points from safety. In a league with four relegation spots they are in real danger of returning to League Two so why are my performance numbers so different to the results?

NOTE: For those not familiar with xG this is a metric to monitor the quality of goalscoring chances. A value between 0 and 1 is assigned based on the probability the chance will result in a goal. A 1 in 20 long range shot with have a probability of 5% (an xG of 0.05) whereas a penalty has a 3 in 4 expectancy and therefore an xG of 0.75.

2018/19 AFC Wimbledon xG Performance by Match

Wimbledon xG by Match
Green = Win, Yellow = Draw, Red = Loss

The Dons started the season well with five points from the first three games and no goals conceded with impressive performances against both Fleetwood and Coventry. 13 defeats in the following 18 games and only one clean sheet shows how quickly fortunes can change at this level.

Since the early season shutouts, the Dons have consistently found them giving up chances in nearly all of their matches so the lack of a clean sheet comes as no surprise. Interestingly they have outcreated their opponents, based on xG, in 13 matches this season but have not managed to translate this into results. The problem being they are not scoring the volume of goals they should be with the chances created.

GF GA GD Pts Position
Actual Performance 15 31 -16 15 23rd
Expected Performance 28 22 6 32 4th

In total 13 goals fewer than expected have been scored and nine more goals than expected conceded. Try telling the Dons fans that the numbers say they should have a +6 goal difference rather than the actual -16! Expected points look particularly high at 32 and it’s unlikely many will have them as the fourth best team in the league.

2018/19 AFC Wimbledon Attacking Performance

Wimbledon Attackers

The goalscoring underperformance noted is consistent amongst four of the five attacking threats with only Mitchell Pinnock scoring the amount of goals expected from the chances created. Joe Pigott is the club’s top goalscorer this season on four goals yet should have had another three. Pigott, Kwesi Appiah and Jake Jervis should have scored 14 league goals between them but have only hit the net six times.

2018/19 League One Attacking Performance

Wimbledon L1 Attackers

In comparison to the rest of the league the trio stick out amongst the biggest underperformers. An underperformance against xG in the short term is usually attributed to a combination of poor finishing, good goalkeeping and bad luck. As the season progresses if these chances keep coming the current trend should (in theory) reverse and the goals will follow.

AFC Wimbledon Big Chances Missed

Due to the low scoring nature of football games are often decided by the odd goal and therefore it is imperative big chances are taken in order to have a successful season. The Dons have missed a number of big chances as rated by my xG performance model with a selection shown below using the AFC Wimbledon TV YouTube channel:

Home to Coventry (Drew 0-0). Tom Soares’ weak shot eventually saved by the goalkeeper.

Home to Sunderland (Lost 2-1). Adedeji Oshilaja’s chance at 1-1 in the six yard box shooting over the bar.

Away to Burton (Lost 3-0). Joe Pigott’s has two big chances chances at 1-0 down. Firstly a close range shot that hits the bar, followed by a header that goes over the bar.

Away to Plymouth (Lost 1-0). Jake Jervis’ shot at 0-0 when a simple tap in was all that was needed.

Had the Dons been fortunate enough to score all of these chances at the game state then they could have had an additional 11 points and be placed in mid table.

Looking Ahead

Wally Downes was appointed as the successor to Ardley at the start of the month tasked with securing survival. The Dons will need to start scoring these big chances if that is to happen. However, don’t be surprised if they end up pulling themselves out of the relegation zone in the coming months. Expected goals is a strong indicator of future performance so it should be onwards and upwards for the curious case that is AFC Wimbledon.

South Coast Pompey are heading up to the Championship

It’s incredible to think about the ten years that followed Portsmouth’s 2008 FA Cup win. Administration and three relegations in four years consigned the south coast outfit to the bottom tier of the EFL with little hope of the tide turning. The astute appointment of Paul Cook in May 2015 was just what was needed to lay the foundations the club is successfully building on now. The second and final season of his spell ended in promotion to League One as champions.

Kenny Jackett was the man tasked with building on those foundations and Portsmouth finished last season in 8th, five points from the playoffs. It is remarkable that the season felt a slight disappointed with expectations this was a side capable of more. For a team not achieving promotion, recruitment and forward planning must be easier without the rigmarole of the playoffs. Three of the four playoff teams would ultimately remain in the league but would need to draw multiple wish lists should promotion be achieved and therefore a higher calibre of player needed. Not a problem Portsmouth would have had.

2017/18 League One Table

Based on expected goals (or xG) Portsmouth should have scored 57 goals, exactly what was achieved. The problem was at the other end of the pitch, 12 more goals conceded than expected hampered the points haul and prevented the playoff place. On my xG model Portsmouth were fourth strongest side in the league with the three superior teams (Wigan, Rotherham and Blackburn) all achieving promotion.

For those not familiar with xG this is a metric to monitor the quality of goalscoring chances. A value between 0 and 1 is assigned based on the probability the chance will result in a goal. A 1 in 20 long range shot with have a probability of 5% (an xG of 0.05) whereas a penalty has a 3 in 4 expectancy and therefore an xG of 0.75.

Team G W D L GF GA Pts xGF xGA xPts
Wigan Athletic 46 29 11 6 89 29 98 71 36 83.4
Blackburn Rovers 46 28 12 6 82 40 96 63 45 72.1
Shrewsbury Town 46 25 12 9 60 39 87 51 50 62.5
Rotherham United 46 24 7 15 73 53 79 66 48 74.1
Scunthorpe United 46 19 17 10 65 50 74 55 55 63.6
Charlton Athletic 46 20 11 15 58 51 71 54 52 63.7
Plymouth Argyle 46 19 11 16 58 59 68 49 61 56.5
Portsmouth 46 20 6 20 57 56 66 57 44 70.7
Peterborough United 46 17 13 16 68 60 64 59 62 61.2
Southend United 46 17 12 17 58 62 63 61 60 63.4
Bradford City 46 18 9 19 57 67 63 56 57 62.3
Blackpool 46 15 15 16 60 55 60 58 51 66.4
Bristol Rovers 46 16 11 19 60 66 59 56 56 62.6
Fleetwood Town 46 16 9 21 59 68 57 45 51 59.0
Doncaster Rovers 46 13 17 16 52 52 56 49 48 62.9
Gillingham 46 13 17 16 50 55 56 50 63 55.8
Oxford United 46 15 11 20 61 66 56 60 63 59.9
AFC Wimbledon 46 13 14 19 47 58 53 49 51 62.2
Walsall 46 13 13 20 53 66 52 46 60 53.7
Rochdale 46 11 18 17 49 57 51 57 55 63.8
Oldham Athletic 46 11 17 18 58 75 50 54 60 59.3
Northampton Town 46 12 11 23 43 77 47 47 67 52.6
MK Dons 46 11 12 23 43 69 45 48 61 54.7
Bury 46 8 12 26 41 71 36 57 61 61.3

Expectations increased ahead of the 2018/19 season with Portsmouth starting 11/1 joint third favourites behind Sunderland and Barnsley. It was a surprise they did not start the season at shorter odds though both of the teams mentioned were relegated from the Championship with squads of a higher quality than typical of League One.

2018/19 League One Table

However, with almost half of the season gone it is Portsmouth who currently lead the way. Pompey are the third strongest team based on expected points per game (another performance metric using expected goals) ahead all but Barnsley and Luton.

The advantage for Jackett’s outfit now is that they already have points on the board. Four points ahead of nearest challengers Sunderland and even more ahead of the two aforementioned stronger teams based on xG performance. This may prove to be an unsurmountable gap for the chasers.

My xG model ranks Sunderland and Peterborough particularly poorly but we’ll save those two for another day!

G W D L GF GA Pts xGF xGA xPts
Portsmouth 19 13 5 1 32 15 44 27 20 30.3
Sunderland 19 11 7 1 39 18 40 22 23 25.0
Luton Town 20 11 5 4 39 21 38 30 20 33.5
Peterborough United 20 11 5 4 36 24 38 24 29 23.6
Barnsley 19 10 5 4 34 19 35 30 18 32.9
Charlton Athletic 19 10 4 5 31 22 34 27 26 26.9
Doncaster Rovers 20 9 5 6 30 26 32 28 25 29.6
Blackpool 19 8 7 4 23 18 31 25 21 27.9
Coventry City 20 8 5 7 21 23 29 26 24 29.1
Wycombe Wanderers 20 7 7 6 29 28 28 22 25 25.6
Accrington Stanley 20 7 7 6 22 24 28 26 26 27.9
Fleetwood Town 20 7 6 7 28 21 27 18 24 22.9
Walsall 20 7 6 7 21 28 27 23 32 22.2
Southend United 20 8 2 10 25 26 26 24 22 28.2
Shrewsbury Town 20 6 6 8 23 25 24 26 19 30.7
Burton Albion 19 7 3 9 24 27 24 27 22 29.0
Rochdale 20 6 5 9 27 38 23 28 28 26.8
Gillingham 20 6 3 11 29 34 21 21 30 23.2
Oxford United 20 5 6 9 25 31 21 21 22 26.9
Scunthorpe United 20 5 6 9 29 42 21 23 30 23.2
Bristol Rovers 20 4 5 11 17 21 17 25 21 30.4
Plymouth Argyle 20 4 4 12 21 37 16 21 35 20.4
AFC Wimbledon 20 4 2 14 14 30 14 27 20 31.0
Bradford City 20 4 2 14 15 36 14 20 32 21.0

2018/19 Portsmouth xG Performance by Match

It’s ominous for the title rivals that Pompey seems to be in the best form they have been all season. Since the surprise defeat at home to Gillingham at the start of October performances have become much more consistent outcreating opponents in all but one of the matches. Results have matched with 17 points taken from the 8 matches.

Portsmouth xG
Green = Win, Yellow = Draw, Red = Loss

The biggest improvement has been the reduction in chances given away. In games against Fleetwood, Burton and Accrington the opposition were limited to very little so it can be considered unfortunate that two of the games ended in draws.

The defender who stands out on my xG performance is Nathan Thompson, the right back signed from Swindon on a free transfer in the summer of 2017. He only played once in the first five games but has been integral since.

Minutes GF per 90 GA per 90 xGF per 90 xGA per 90
Portsmouth 2018/19 1710 1.7 0.8 1.4 1.0
with Nathan Thompson 1091 1.6 0.8 1.5 0.8
without Thompson 619 1.7 0.7 1.4 1.5

Whilst in the team expected goals conceded per match are 0.8 the same as actual goals conceded per match. However without him they were expected to concede twice as many. They can be considered fortunate actual goals conceded were not higher when he did not play.

2018/2019 Portsmouth Attacking Performance

In attack Kenny Jackett has favoured Oliver Hawkins leading the line with Ronan Curtis, Gareth Evans and Jamal Lowe providing support behind in a 4-2-3-1 formation. Goals have been evenly spread amongst the four providing Pompey fans comfort the team does not have an over reliance on one player in the goalscoring department.

Should Jackett turn to the bench then step forward Brett Pitman. He played 75% of the minutes last season but has only featured in 30% of the minutes this season. He’s scored three goals (and provided three assists) in 500 minutes and compares favourably to the strikers both at Fratton Park and across League One. Portsmouth Strikers L1

His experience will be vital for the run-in and it would be no surprise to see him come off the bench to score some match winning goals, in what will hopefully prove to be a successful promotion season for fans. Pompey are back and heading for the second rung of English football.

Note:

For those who’s attention has been caught by the league’s largest overperformer in the chart above, the one with roughly 0.8 goals per 90 but only 0.3 xG – it’s Sunderland’s Josh Maja. This is one of the reasons why my xG model rates Sunderland so poorly. It’s unlikely his goalscoring rate will continue so unless the returning Charlie Wyke can provide the goals they may find Luton and/or Barnsley breathing down their neck more closely after the busy festive period.

Captain Marvel Mousinho Driving Oxford United Away From Relegation Danger

Starting the campaign with four successive league defeats was hardly the start Karl Robinson and the Oxford United fans were expecting. 12 games in and a total points of 6 points was no better for a side looking to make a promotion push this season.

The pressure was well and truly on Robinson by the middle of October when Oxford (24th) faced Plymouth (23rd) in an early season six-pointer at the Kassam Stadium. Defeat for the yellows and there might have been no way back for Robinson. In the end a 2-0 victory has kick started the season with the yellows picking up 10 points in an unbeaten 6 game spell.

The danger isn’t over yet with Oxford still remaining in the relegation spot so with a squad packed with attacking quality in the form of Ricky Holmes, James Henry, Gavin Whyte and Marcus Browne, and one of the best goalkeepers in the league in Simon Eastwood – why did it go so wrong for so long?

Karl Robinson and the 4-2-3-1

Formations
Karl Robinson’s trusted 4-2-3-1 with three personnel setups

Followers of the EFL will know Karl Robinson is a massive fan of the 4-2-3-1 favouring the formation for most of his managerial career to date. It’s been no different while at Oxford with Robinson starting the season at Oakwell with Rob Dickie and Curtis Nelson as the centre back partnership. Josh Ruffels and Cameron Brannagan were chosen to provide the stability, both defensively and offensively, as the two sitting midfielders however, 3 games played and 10 goals conceded highlighted defensive frailty.

In an effort to strengthen the defence changes were made. Jamie Hanson came into midfield with John Mousinho replacing Dickie to reform the favoured defensive partnership from last season. The pair played the next 7 games together and while the performances did improve (5 points picked up) the team still conceded 11 goals. One last roll of the dice needed.

Oxford United Performance with and without John Mousinho

Mins GF GA GF per 90 GA per 90
Oxford United 1530 20 27 1.2 1.6
without John Mousinho 360 2 12 0.5 3.0
with John Mousinho (Defender) 630 9 11 1.3 1.6
with John Mousinho (Midfielder) 540 9 4 1.5 0.7

For those that didn’t know John Mousinho started his career at Brentford as a central midfielder. This remained through spells at Wycombe, Stevenage and Preston until he signed for Burton Albion at the start of the 2014/15 season. It was only here that manager Gary Rowett converted Mousinho into the central defender the yellows fans were more familiar.

The decision by Robinson to move Mousinho back into midfield has proved inspired. In the six games that followed Oxford have kept four clean sheets which has provided the foundations to pick up points more regularly. The yellows have won both home games while drawing all four away games at a rate playoff pushing teams would be happy with.

League One Table (as at 16th November 2018)

This all sounds very optimistic ahead of another home crunch clash to fellow bottom half strugglers Gillingham on Saturday, however performances haven’t necessarily followed performances. Oxford sit 21st in the table however are only slightly higher in 16th using expected goals (or xG) performance.

For those not familiar with xG this is a metric to monitor the quality of goalscoring chances. A value between 0 and 1 is assigned based on the probability the chance will result in a goal. A 1 in 20 long range shot with have a probability of 5% (an xG of 0.05) whereas a penalty has a 3 in 4 expectancy and therefore an xG of 0.75.

Team G W D L GF GA GD Pts xGF xGA xGD xPts
Portsmouth 17 11 5 1 28 14 14 38 23 18 4 25.8
Sunderland 16 10 5 1 32 13 19 35 18 19 -1 20.9
Peterborough 17 10 3 4 33 22 11 33 20 26 -6 19.7
Barnsley 16 9 4 3 29 14 15 31 25 14 11 28.4
Luton Town 17 8 5 4 27 19 8 29 24 17 7 27.7
Charlton Athletic 17 8 4 5 26 20 6 28 23 22 1 24.5
Accrington 17 7 7 3 21 19 2 28 22 23 0 23.5
Coventry City 17 8 4 5 20 18 2 28 22 20 2 24.7
Blackpool 16 6 7 3 18 15 3 25 21 19 3 23.1
Doncaster Rovers 17 7 4 6 25 24 1 25 26 22 4 25.5
Walsall 17 7 4 6 19 24 -5 25 20 28 -8 18.5
Fleetwood Town 17 6 5 6 24 19 5 23 14 20 -5 19.7
Southend United 17 7 2 8 21 22 -1 23 22 18 5 25.4
Burton Albion 16 6 3 7 22 22 0 21 22 18 4 24.0
Wycombe 17 5 6 6 23 24 -1 21 20 22 -2 21.7
Rochdale 17 5 5 7 22 31 -9 20 25 23 3 24.7
Gillingham 17 5 3 9 26 29 -3 18 20 26 -6 20.6
Shrewsbury Town 17 4 6 7 16 20 -4 18 23 16 6 26.2
Scunthorpe 17 4 6 7 26 37 -11 18 21 26 -5 20.1
Bristol Rovers 17 4 5 8 14 14 0 17 21 18 3 25.4
Oxford United 17 3 6 8 20 27 -7 15 16 19 -3 21.1
Plymouth Argyle 17 3 4 10 18 29 -11 13 18 29 -11 16.9
AFC Wimbledon 17 3 2 12 11 26 -15 11 24 18 6 26.7
Bradford City 17 3 1 13 12 31 -19 10 18 28 -11 17.6

Although Oxford have only been expected to concede as many goals as league leaders Portsmouth, expected goals scored are the lowest in the league. The problem lies in that for all the neat and tidy build up play from the 3 creative midfielders behind the striker, not many high quality chances are being created.

Oxford United xG Performance by Match

Oxford’s top goalscorer has just three goals with centre half Curtis Nelson (2) scoring as many as strikers Jonathan Obika (1), Jamie Mackie (1) and Sam Smith (0) have managed between them. Away from the Kassam Stadium the tactic in recent weeks has been to successfully stifle opponents, as shown in away performances against Southend and Bristol Rovers, however this has been at a cost of creating very little chances to actually score and win the match.

xG by Match
Green = Win, Yellow = Draw, Red = Loss

Even the comprehensive 3-0 win at home to Shrewsbury shows the yellows took the chances they created and made little else. When January comes around the Oxford fans will be hoping and expecting attacking additions will made to build on the improved defence performance by Mousinho and co. If not then expect 0-0 to be the most common score line from now until the end of the season.

Incoming Shrews Boss to Lead Salop to a Mid Table Finish

From one STFC managerial departure to another. The week started with Swindon Town climbing aboard the managerial merry go round before further stops at AFC Wimbledon, Shrewsbury Town and Notts County. John Askey, formerly manager of Shrewsbury Town, lost his post on Tuesday with the Shrews languishing in 18th in League One.

Rewind six months and the club was standing on the brink of Championship football for the first time in the clubs history with just Rotherham United and one-off match at Wembley standing between them. At the start of the 2017/18 season Shrewsbury were unfancied and unconsidered for promotion. Amongst the favourites for relegation, Paul Hurst’s outfit outdid all expectations to top the table for large sections of the season ultimately finishing in third unable to keep pace with Blackburn’s blistering finish.

Shrewsbury Town 2017/18 League Position by Game Week

2017-18 League Position by Weekpng

2017/18 League One Table (Top 6 Finishers)

While results were strong, performances as measured by Expected Goals (or xG) told a completely different story. A goal difference of +21 was a considerable overperformance compared to an xGD of +1. Based on the performance metrics Shrewsbury were only the 12th best team in the league. Wigan Athletic, Rotherham United and Blackburn Rovers performed strongest on the performance metrics and all playing Championship football this season.

G W D L GF GA GD Pts xGF xGA xPts
Wigan Athletic 46 29 11 6 89 29 60 98 71 36 83.4
Blackburn Rovers 46 28 12 6 82 40 42 96 63 45 72.1
Shrewsbury Town 46 25 12 9 60 39 21 87 51 50 62.5
Rotherham United 46 24 7 15 73 53 20 79 66 48 74.1
Scunthorpe United 46 19 17 10 65 50 15 74 55 55 63.6
Charlton Athletic 46 20 11 15 58 51 7 71 54 52 63.7

2017/18 Attacking Performance

Overperformance was at both ends of the pitch with goals scored 9 higher than expected and goals conceded 11 fewer than expected. The Shrews’ strong season was built on goals coming from multiple sources with the top 5 league scorers displayed below.

2017-18 Goals xG

It’s particularly eye catching that four of the five scored more goals than expected, an overperformance due to above expected finishing, below expected goalkeeping or most likely a combination of the two. It’s unlikely any of the five players listed above are the calibre of Lionel Messi and therefore this level of goalscoring output was unlikely to be maintained into the 2018/19 season.

Worse for the Shrews was what actually happened. Paul Hurst moved on to new pastures at Ipswich Town taking Jon Nolan with him. Stefan Payne and Alex Rodman both moved to Bristol Rovers and Carlton Morris returned back to parent club Norwich City. Dean Henderson, the 20 year old goalkeeper on loan from Manchester United, impressed hugely, so much so that Championship club Sheffield United came calling for his next loan spell where he continues to shine.

John Askey was appointed the impossible task of building on the successful season with most of the attacking output departed. His previous assignment had led Macclesfield Town to the National League title and a return to the Football League.

2018/19 Shrewsbury Town xG Performance by Match

2018-19 Shrews xG
Green = Win, Yellow = Draw, Red = Loss

The season started badly with 0 wins in 7 but the performances deserved more, much more. The Shrews outcreated the opponents in the first four matches with only the away trip to the south coast against Portsmouth showing signs of potential vulnerability. 14 points from the next 10 games is mid table form however the poor start meant it was still a case of looking over their shoulder rather than up the league table.

Performances continued to be positive in particular at home where the Shrews significantly outcreated Southend, Accrington and Sunderland. xG has Shrewsbury down as a playoff team this season, quite the contrast of last year, although the fans might argue this does not pass the eye test.

2018/2019 Attacking Performance

Whereas last season showed an attacking unit that overperformed, the opposite is true of this season. Both Josh Laurent and Shaun Whalley have a goal apiece but should have a collective scored almost six goals. A difference of four goals may not seem much but could have converted a loss into a draw, or a draw into a win with the extra points cementing a mid table position.

2018-19 Goals xG

The underperformance of xG is typically attributed to bad fortune and a combination of poor finishing and good goalkeeping. If I was a manager the Shrewsbury job would look very attractive right now, a lot more appealing than the impossible job in the summer. The squad is underperforming and the expected reversal in goalscoring output in the coming months for Laurent and Whalley especially will likely lead the Shrews to a safe mid table finish and positive reflection of the incoming manager.