Following the previous posts detailing how I have created a betting a model using expected goals data, link below, and predictions for the League One and League Two play-offs it’s the last of the trilogy for this season and time to predict the outcome of the Championship play-offs.
The Championship was also Coronavirus impacted season, like the other the EFL leagues, however unlike the other EFL leagues this one did reach a conclusion with all 24 teams playing the complete set of fixtures.
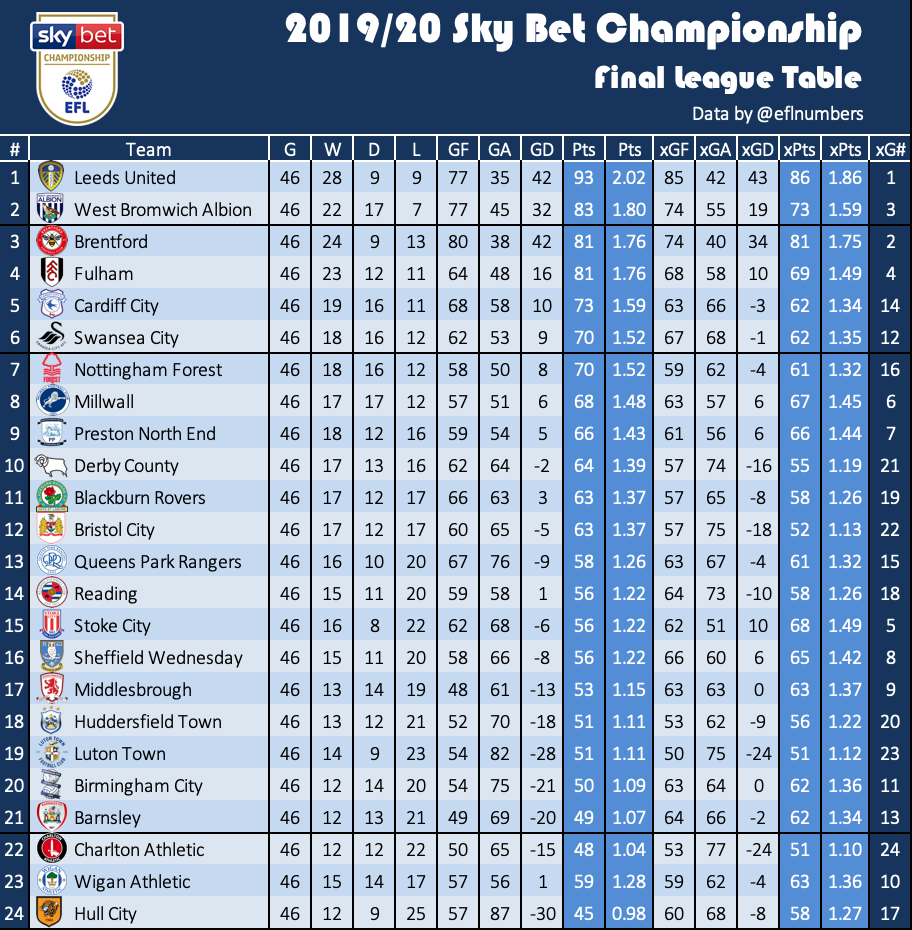
Leeds United were the Champions and right so (ranked the best team by my expected goals model). They should have been promoted 12 months earlier though. Runners up were West Bromwich Albion and no one will begrudge them that given they spent a large majority of the season in pole position. They ranked as the third best side in the league.
The next four teams were separated by 11 points with Brentford, Fulham, Cardiff City and Swansea City the teams still facing an opportunity to reach the promised land and the riches of the Premier League.
Brentford
#
Team
G
W
D
L
GF
GA
GD
Pts
PPG
xGF
xGA
xGD
xPts
xPPG
xG#
3
Brentford
46
24
9
13
80
38
42
81
1.76
74
40
34
81
1.75
2
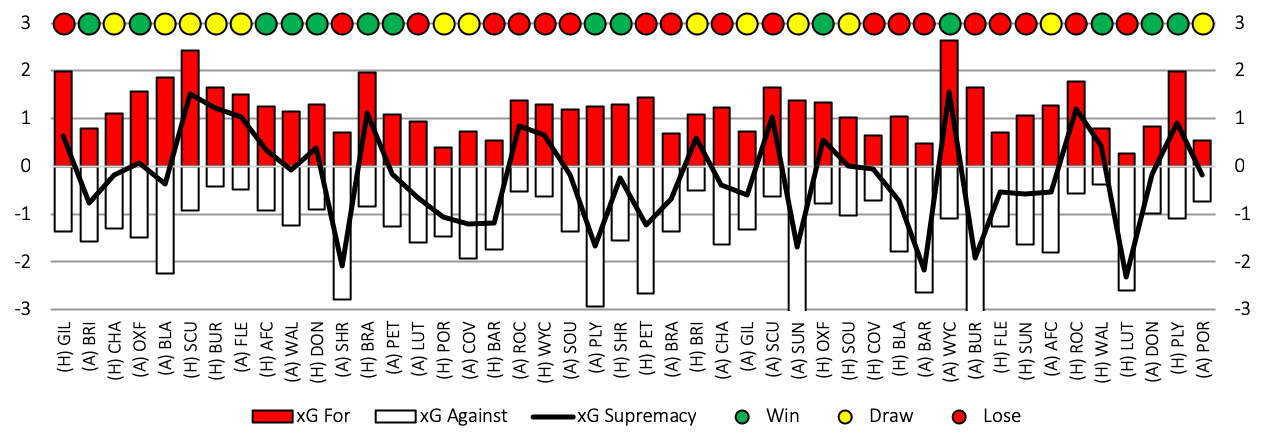
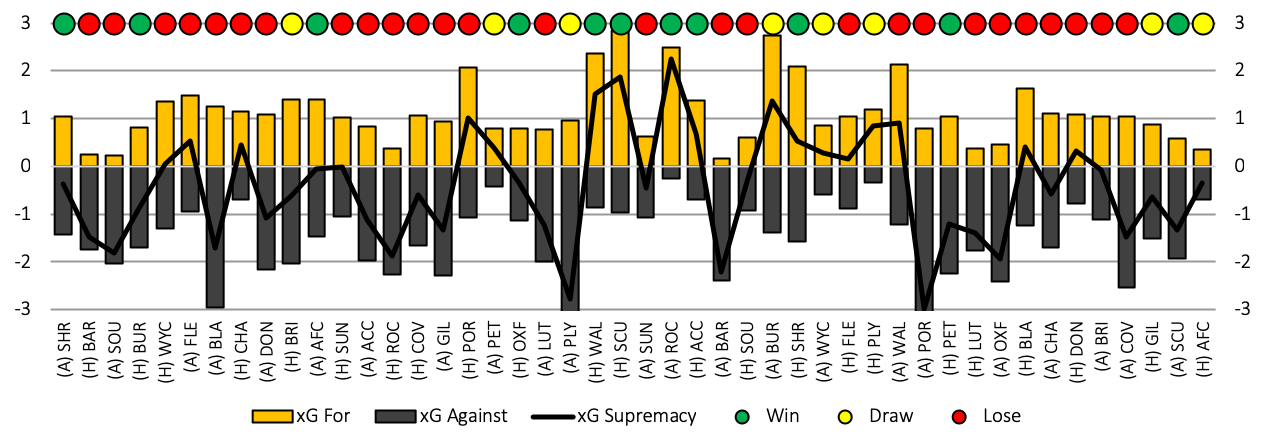
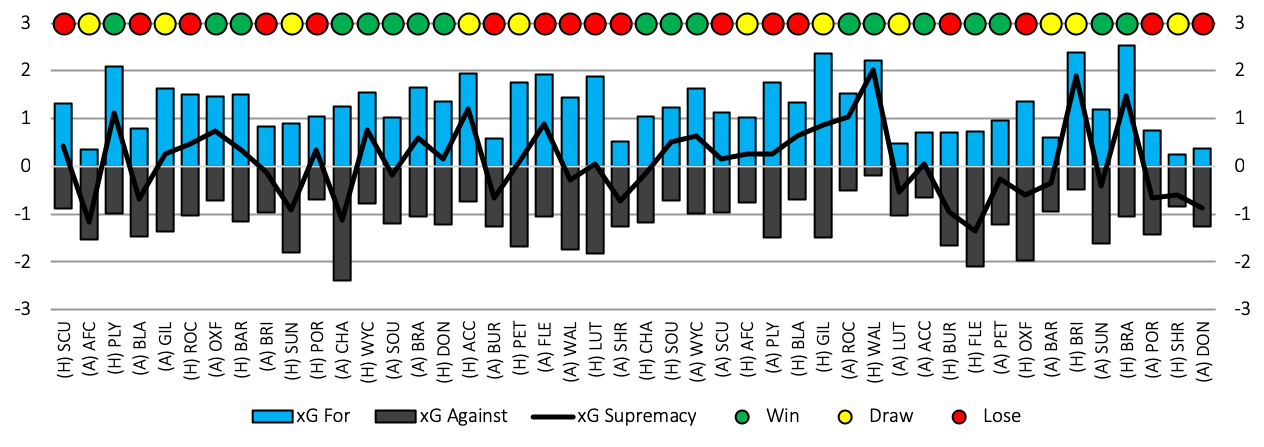
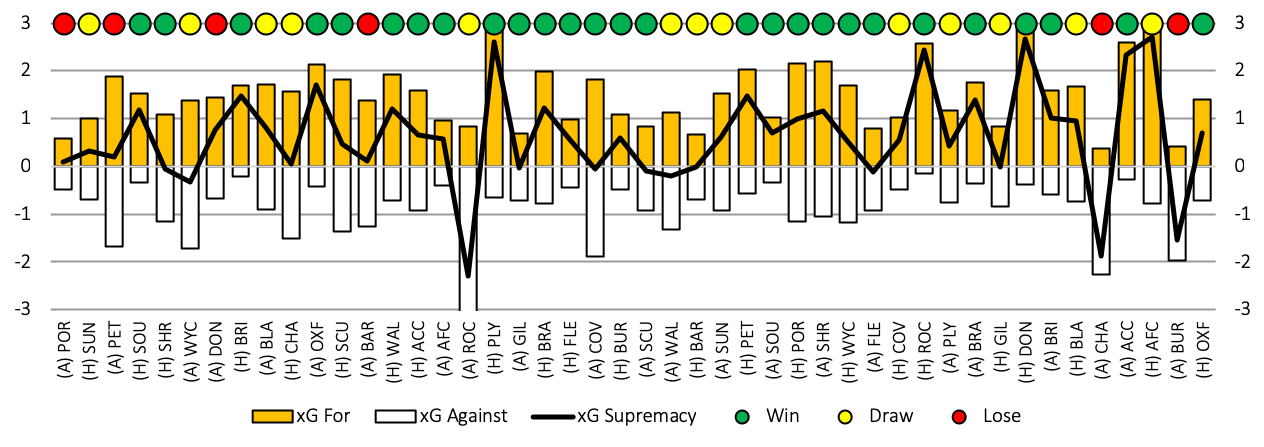
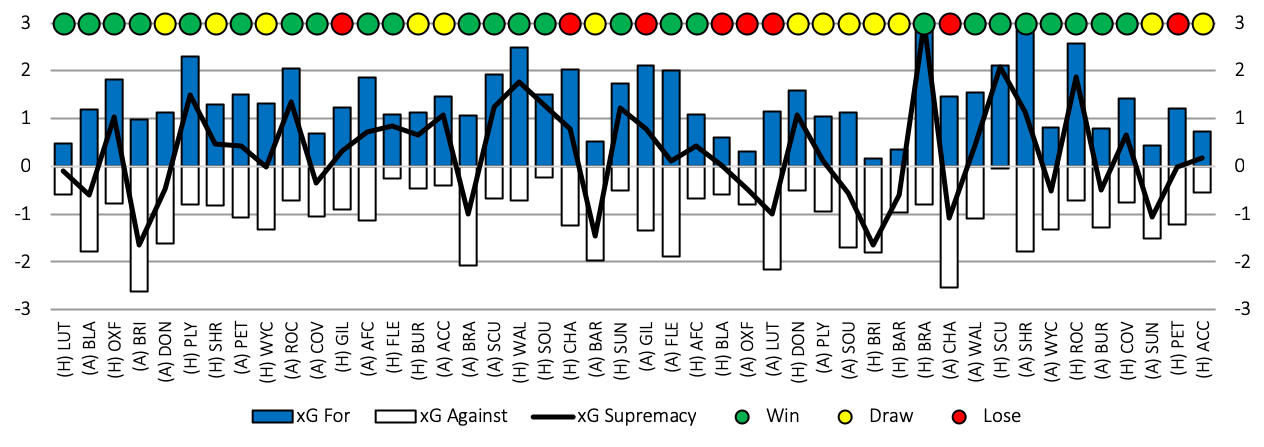
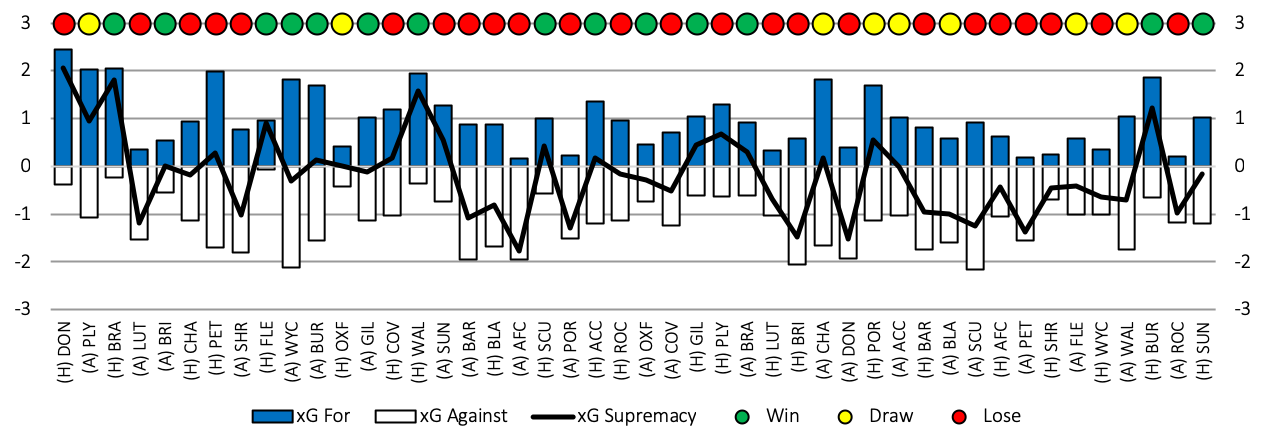
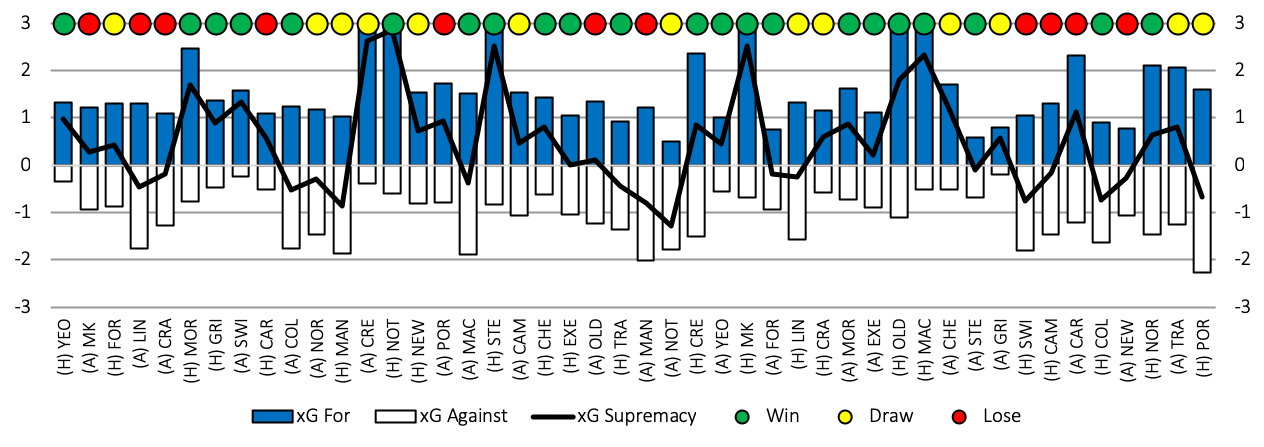
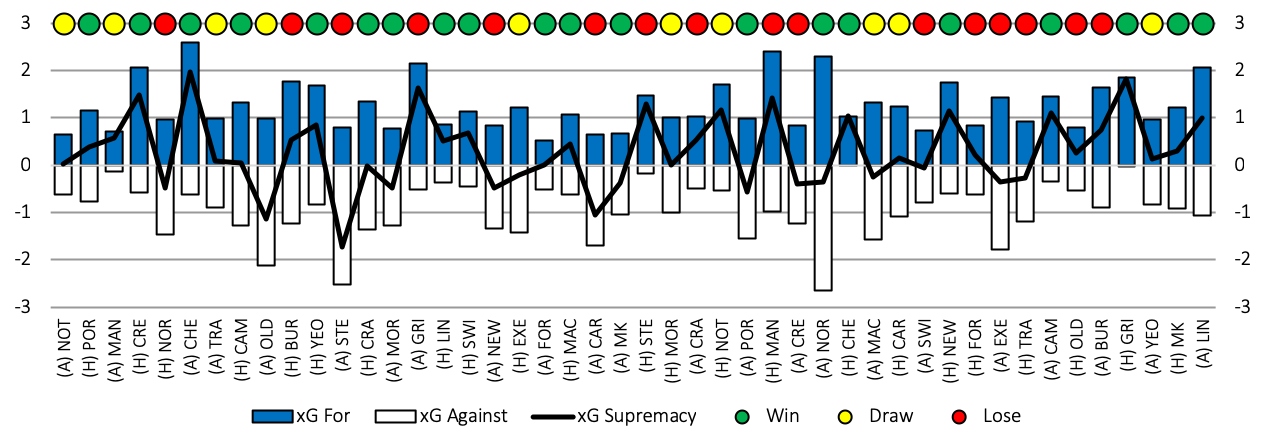
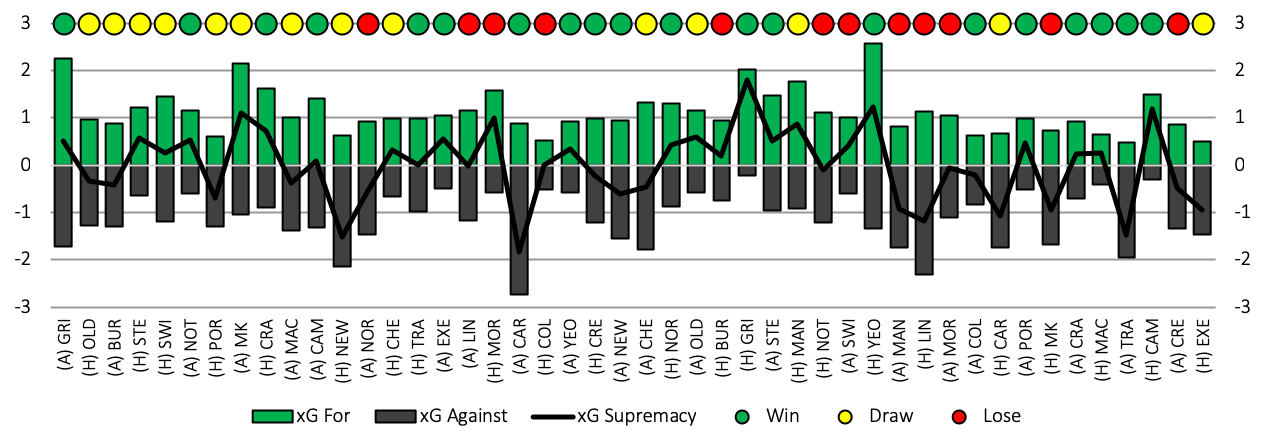
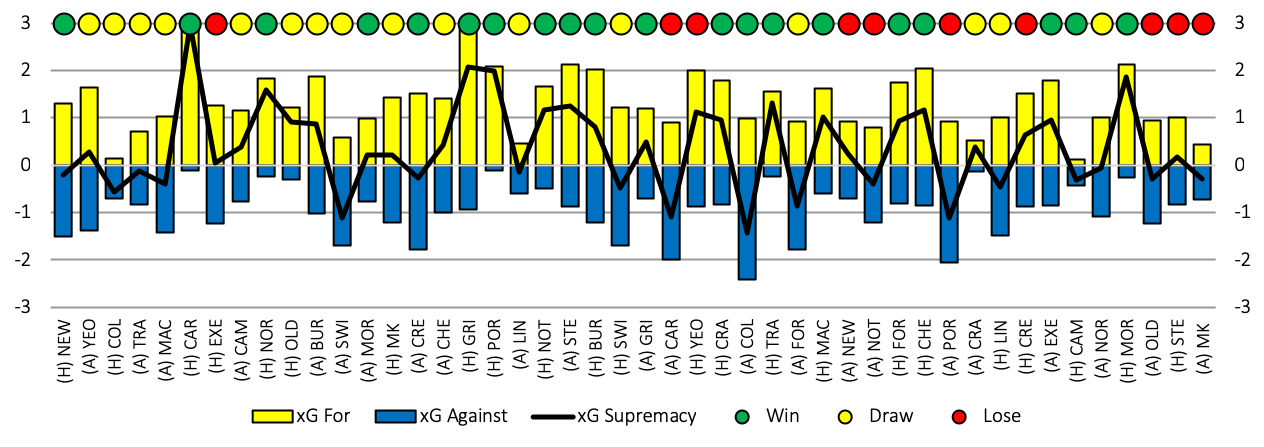
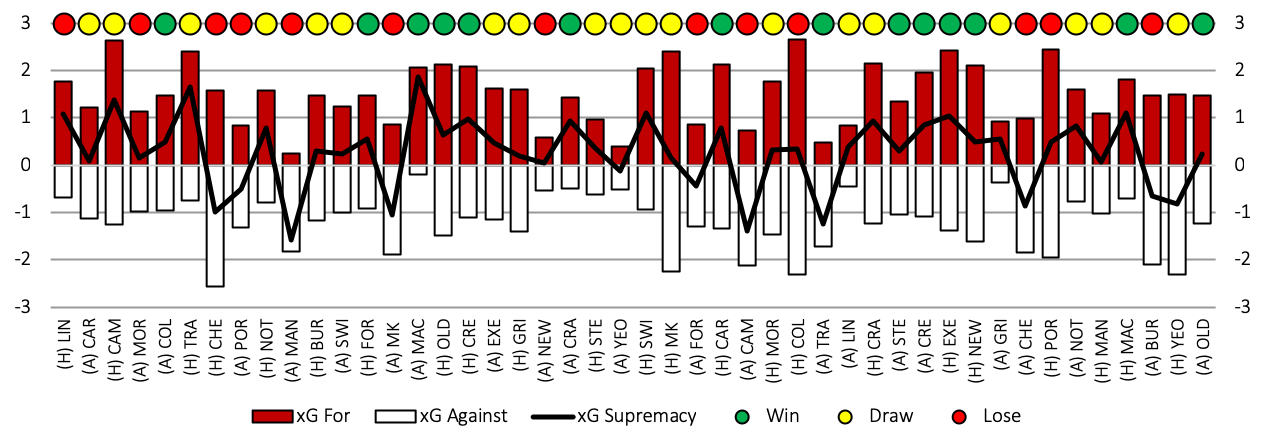
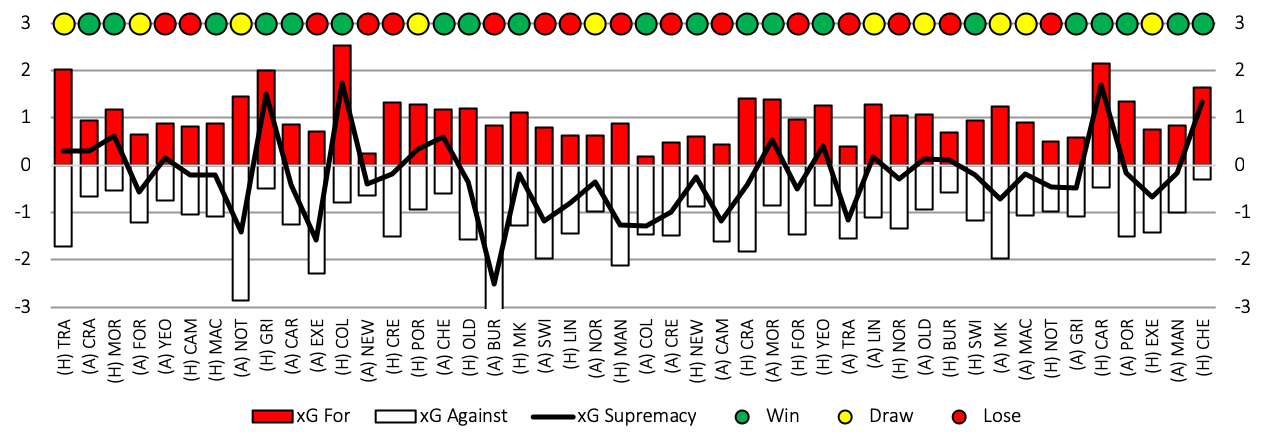
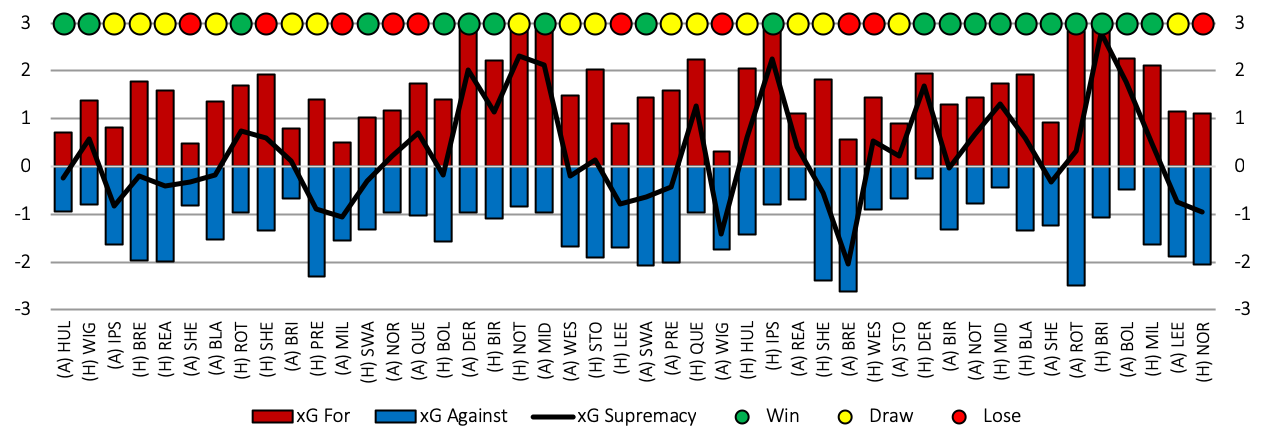
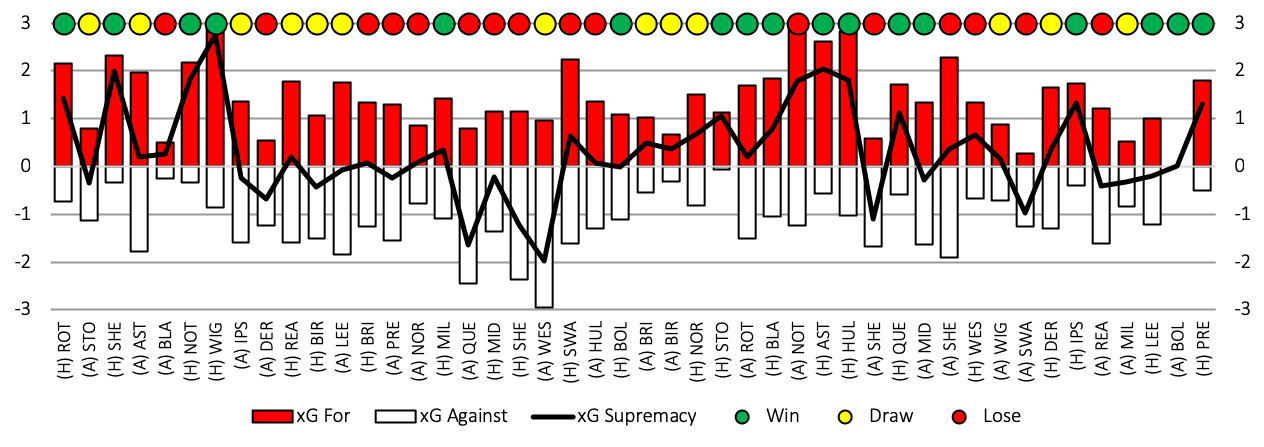
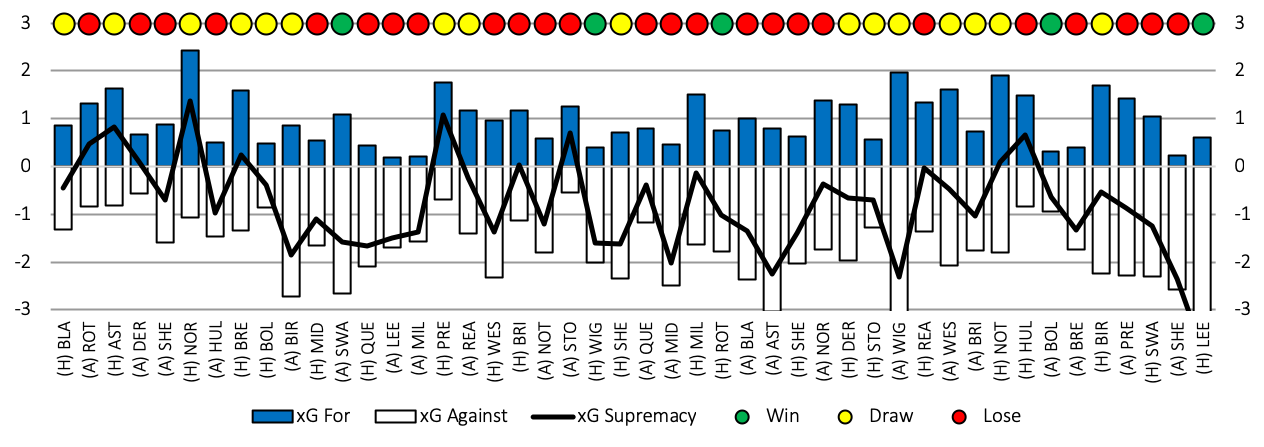
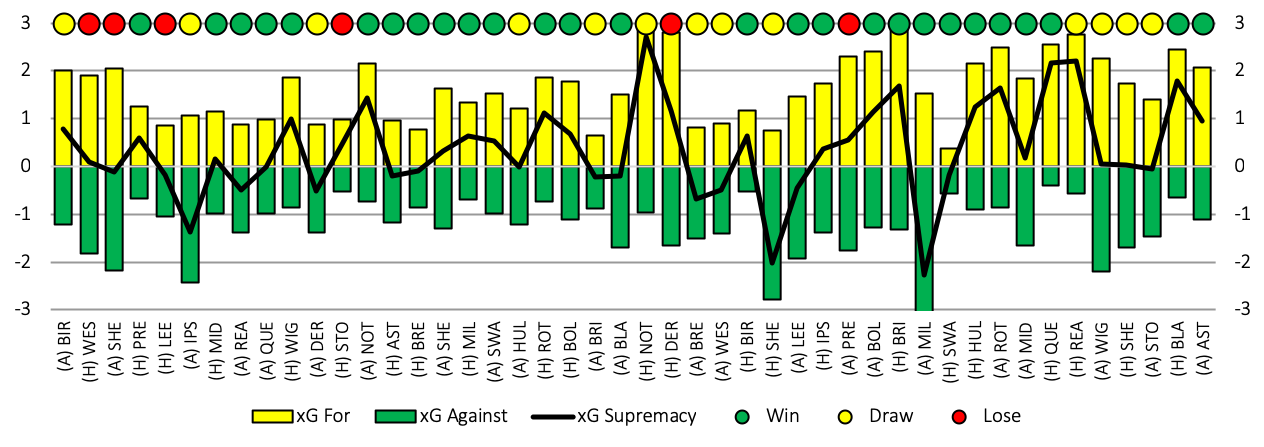
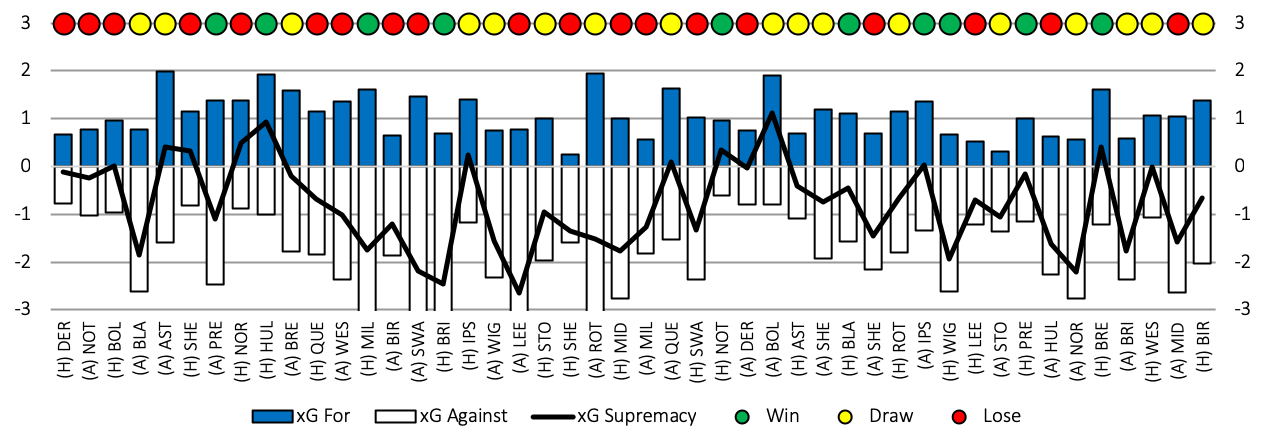
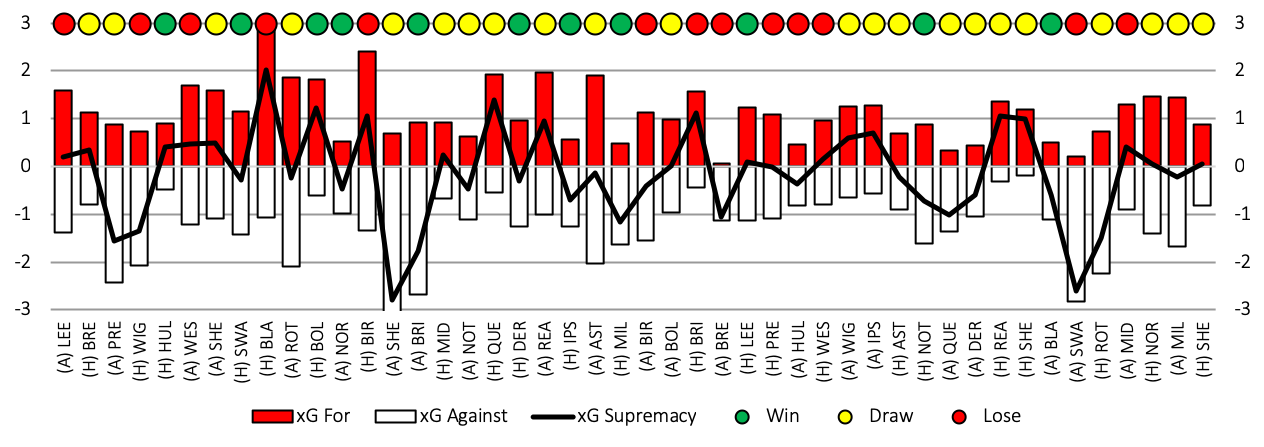
Brentford finished 3rd two points behind West Brom in the end with a win in either of the last two games good enough for an automatic spot. According to my expected goals model Brentford are the clear second best side in the league (behind Leeds United) and are the strongest of the play-off quartet. Brentford had the second best defence (ranked 1st by xG) and the highest scoring attack (joint second best by xG).
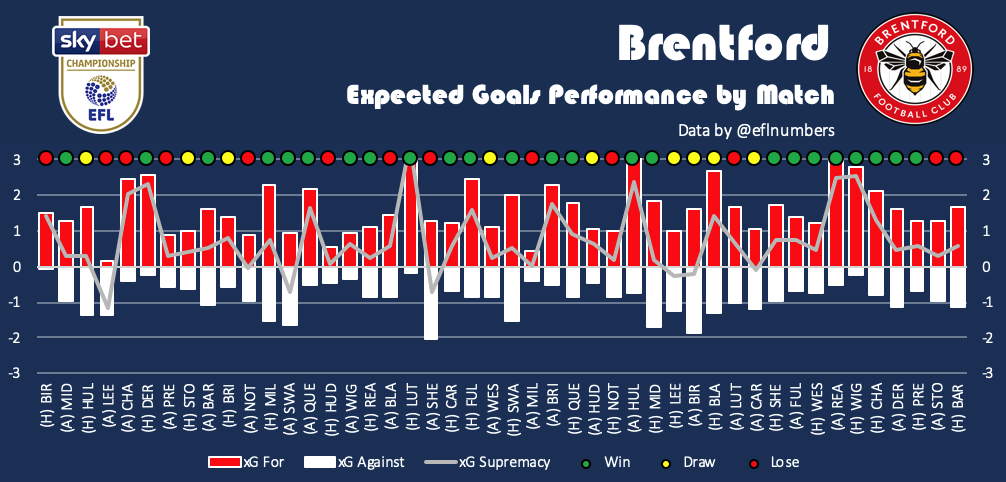
Brentford’s automatic chances were badly hampered by the slow start. The Bees essentially spent the first 3 months in the bottom half before their form picked up. The performance of the season came in the home match against Luton Town (won 7-0) and they weren’t dominated. They were 4th going into the enforced break and had no right to have a chance of the automatic spots before 7 consecutive wins put them right up there. Performances away to Reading (won 3-0) and home to Wigan Athletic (won 3-0) were of particular note.
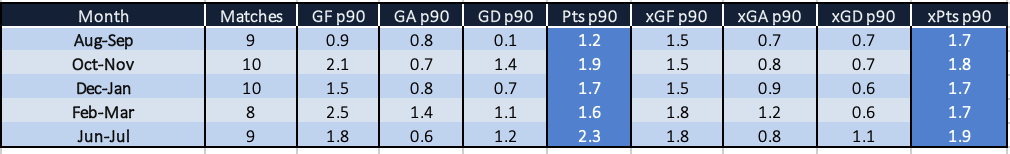
The Aug-Sep period of 9 games at the start of the season picked up just 1.2 points per game, let down by a lack of goals. The rest of the season was fairly strong before the post lockdown period went up a level with a W-D-L record of 7-0-2. It’s interesting to note that the expected goals performance was consistent throughout.
Thomas Frank only tried two formations all season, a 3-4-3 or a 4-3-3. The season started with 8 games in a 3-4-3 formation with a W-D-L record of 2-2-4. The expected goals data shows they deserved more and didn’t take the chances they created. From thereafter it was almost exclusively 4-3-3. The expected goals data shows they gave up more chances on average but more importantly created more. The expected points was only slightly higher but the actual points on the board was 2 points per game. If only they started the season in a 4-3-3.
Fulham
#
Team
G
W
D
L
GF
GA
GD
Pts
PPG
xGF
xGA
xGD
xPts
xPPG
xG#
4
Fulham
46
23
12
11
64
48
16
81
1.76
68
58
10
69
1.49
4
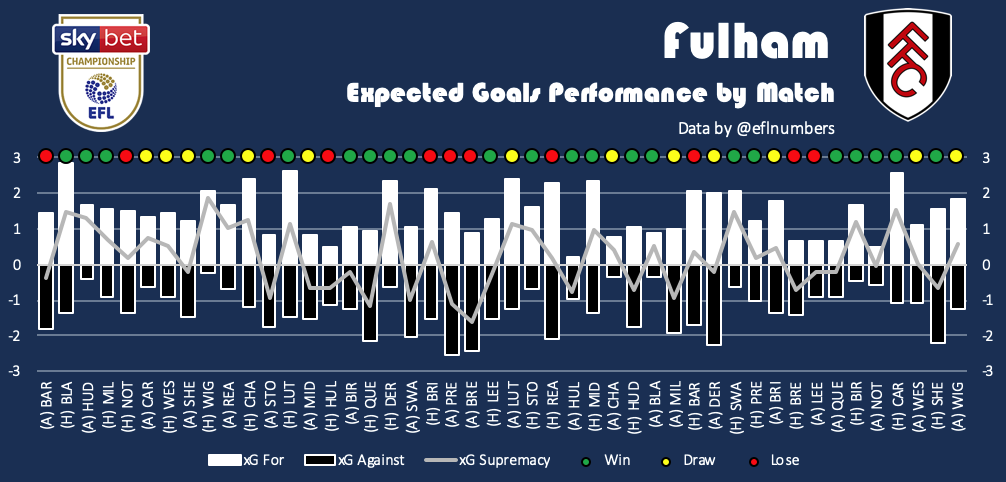
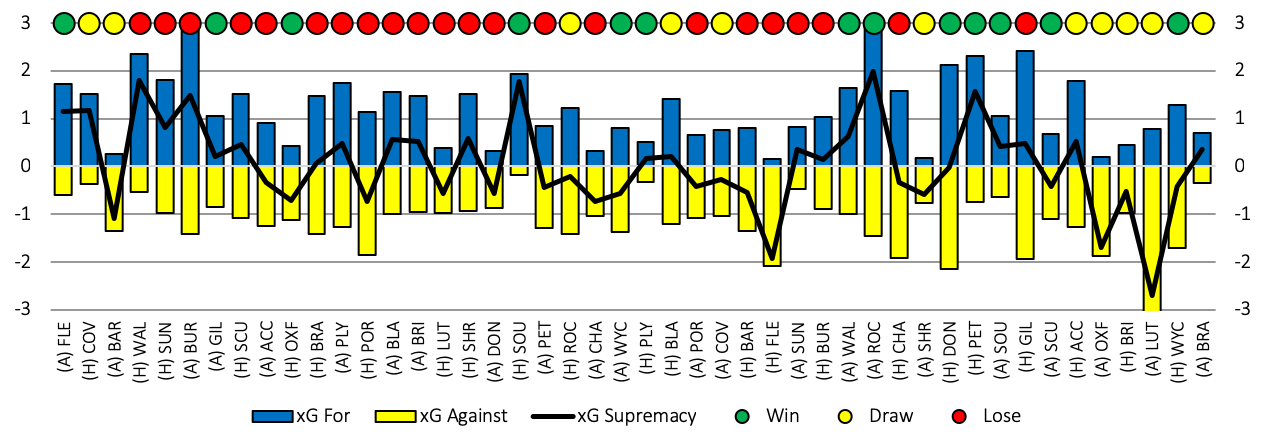
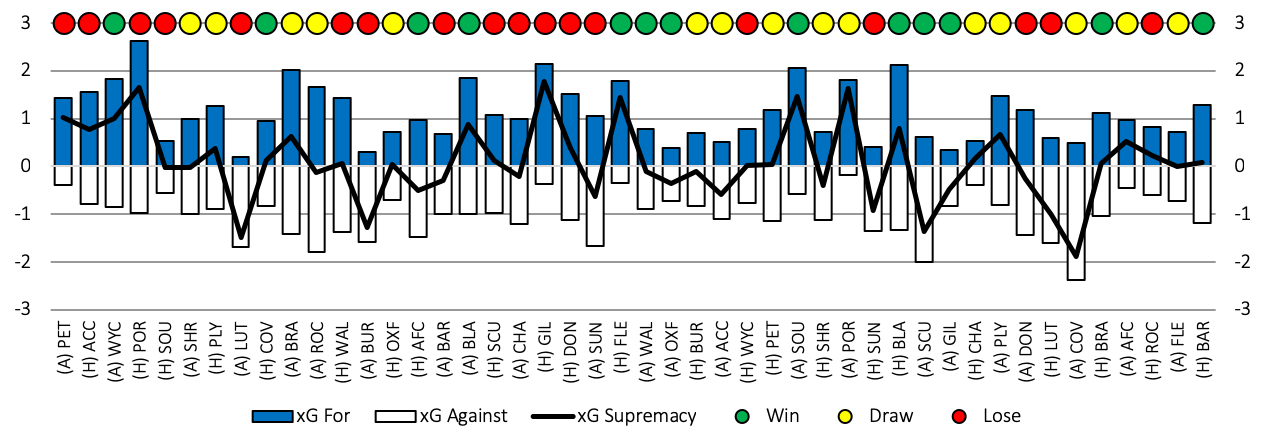
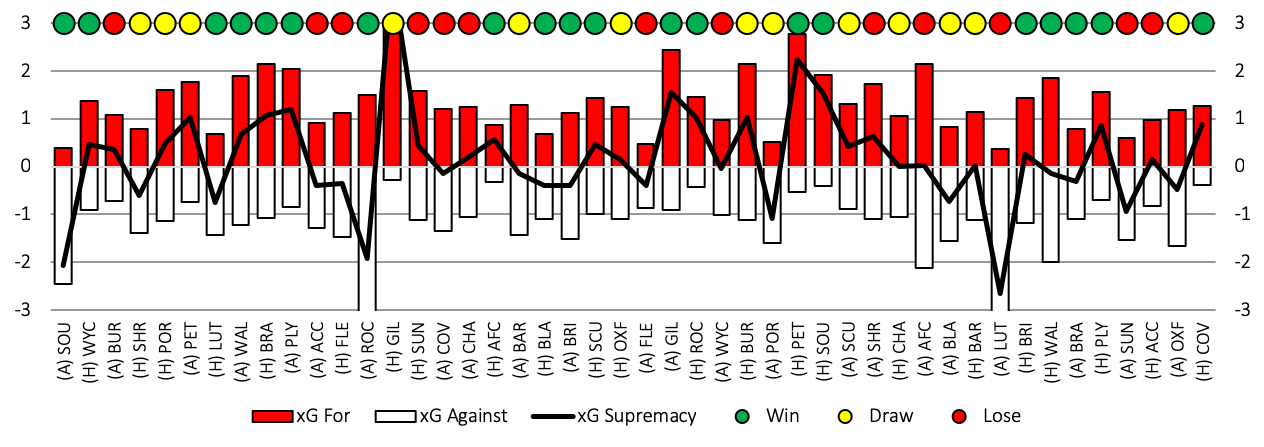
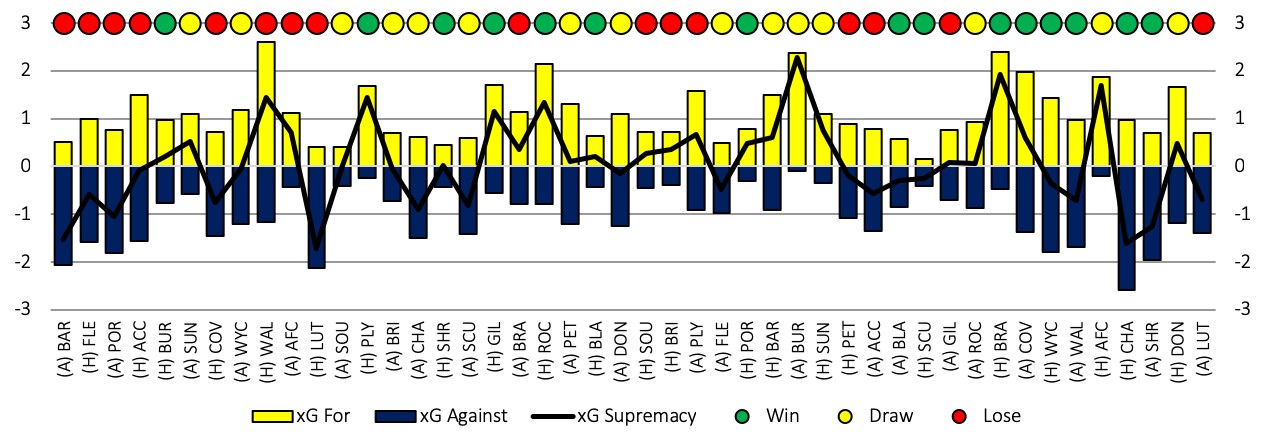
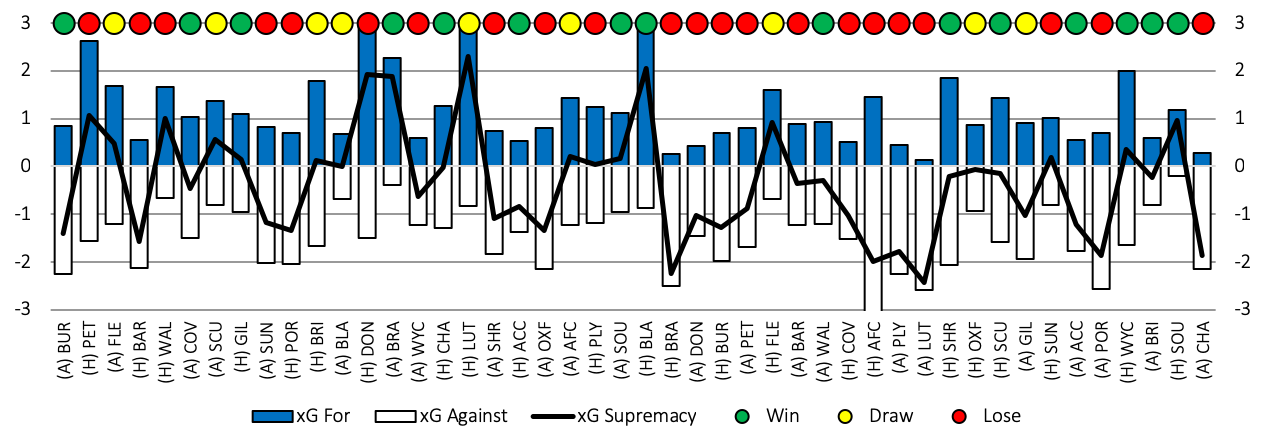
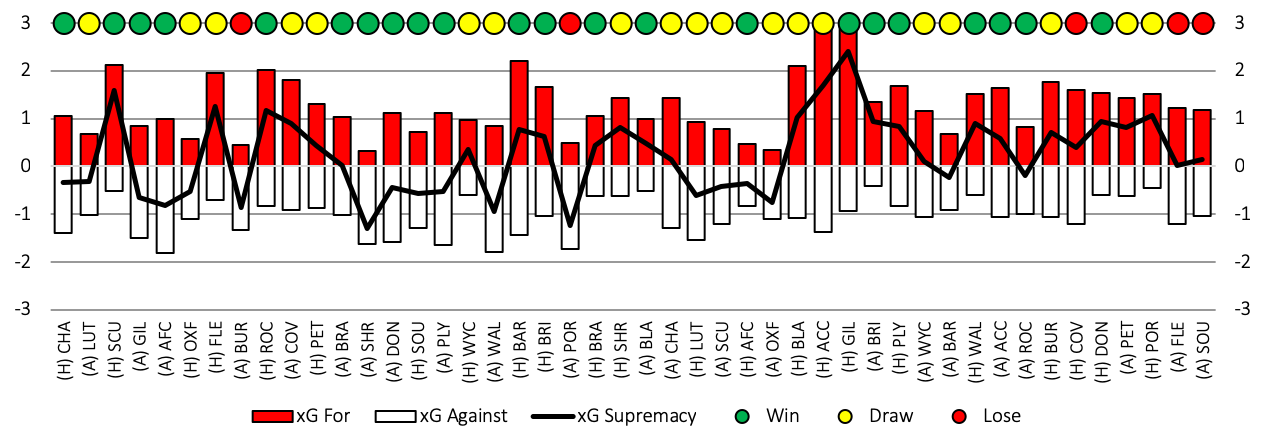
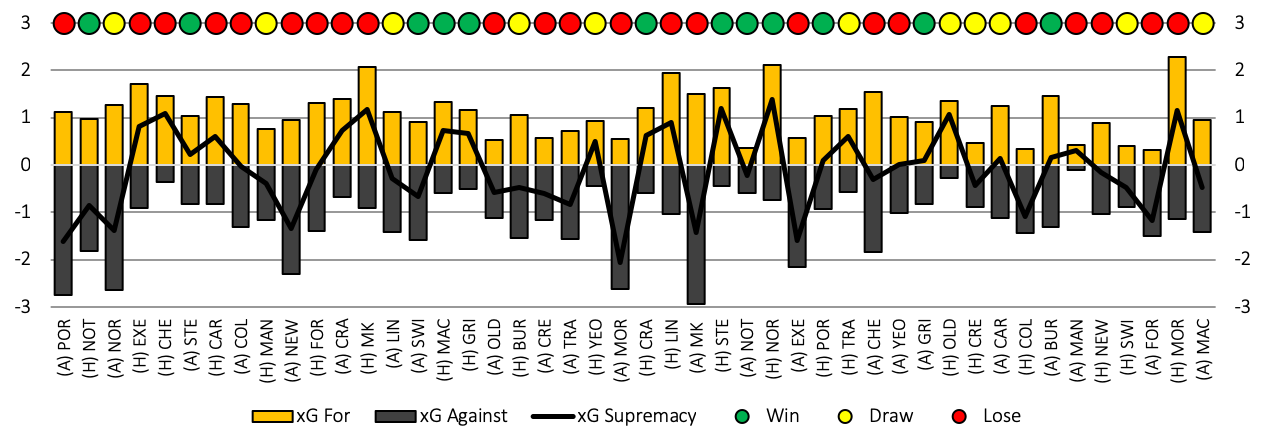
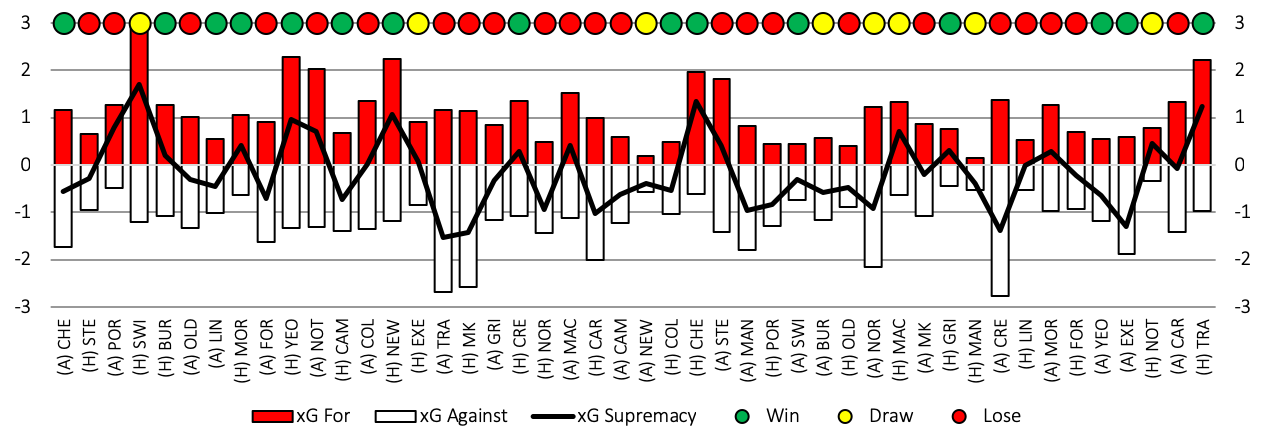
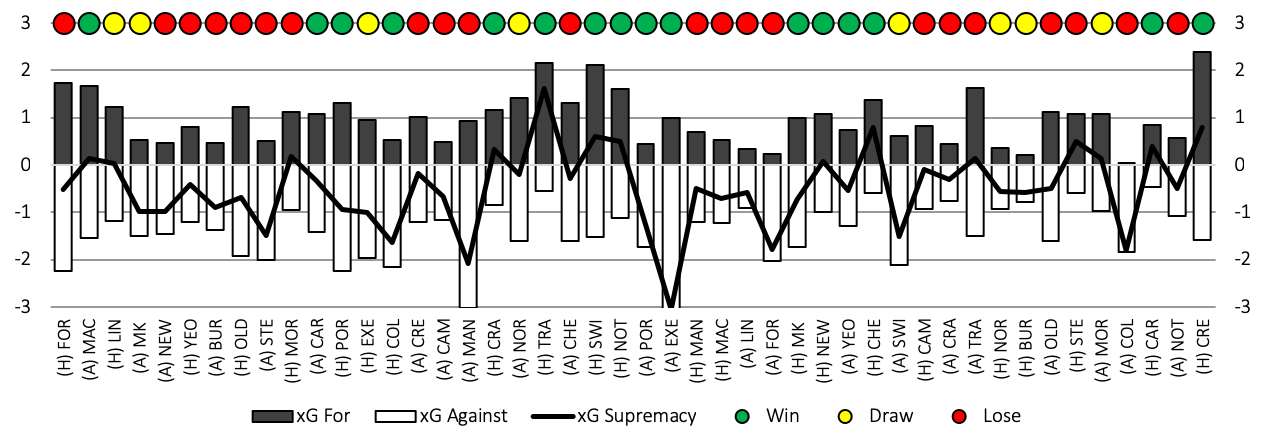
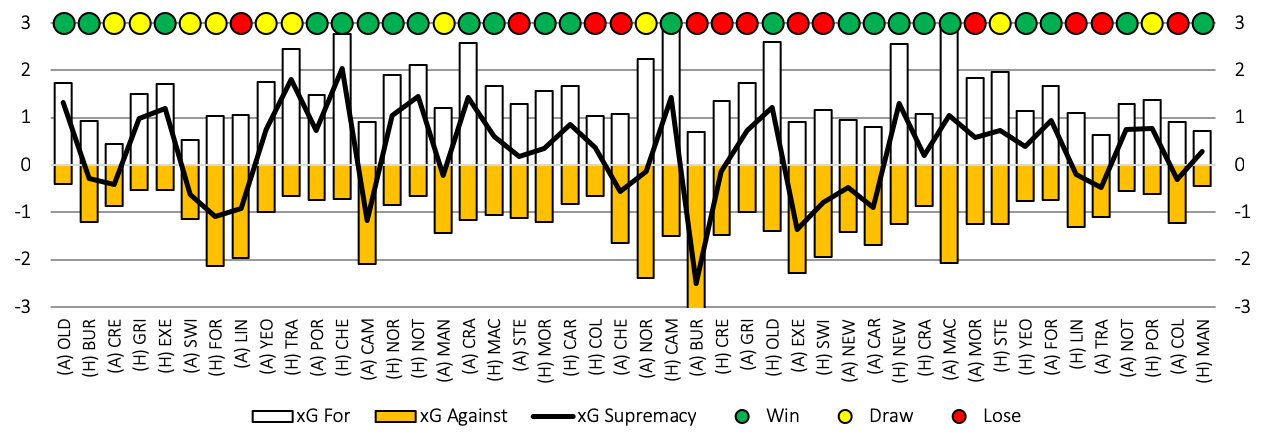
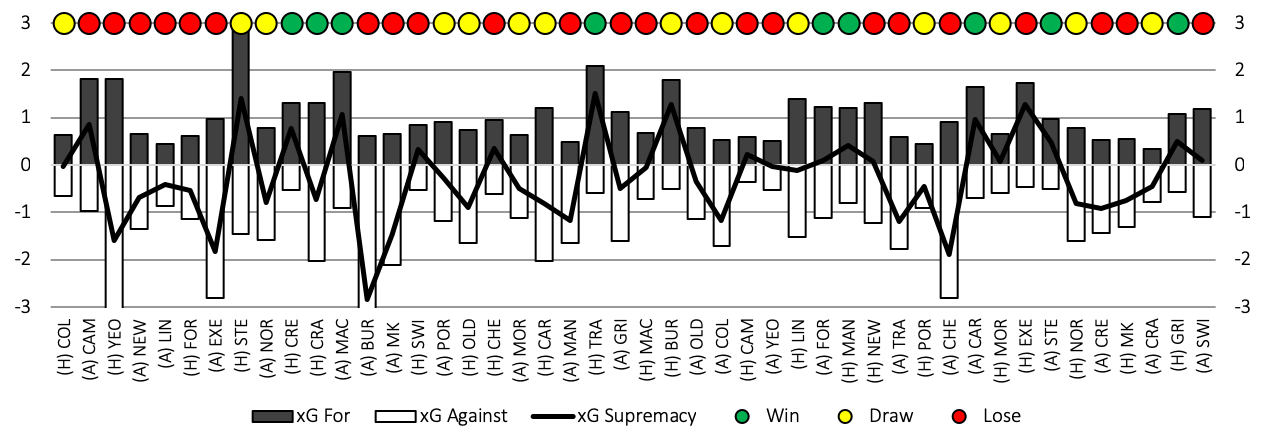
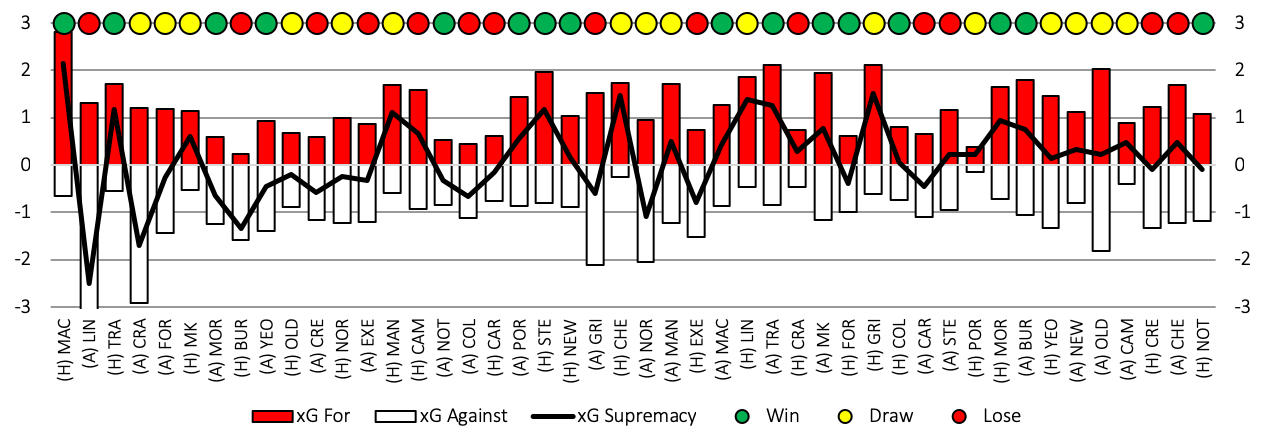
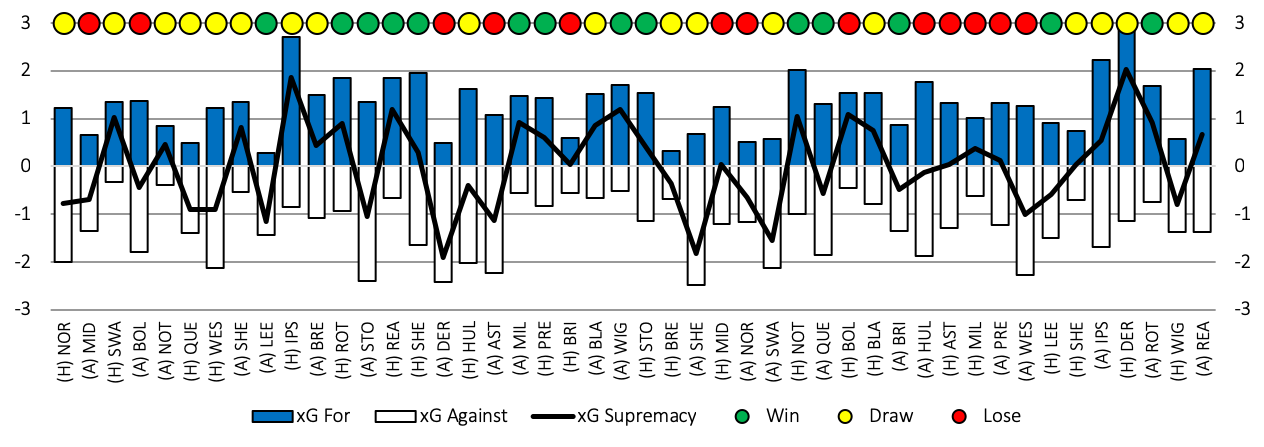
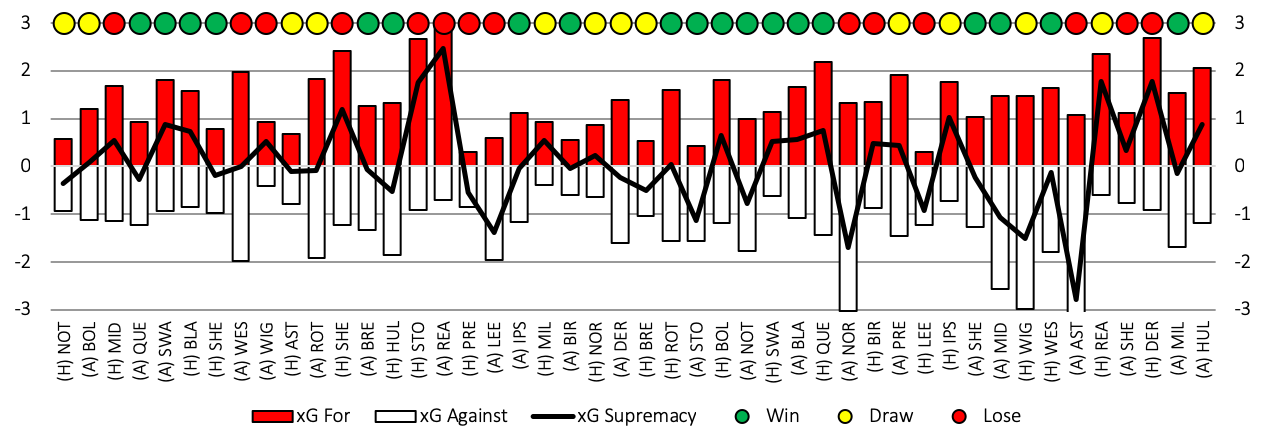
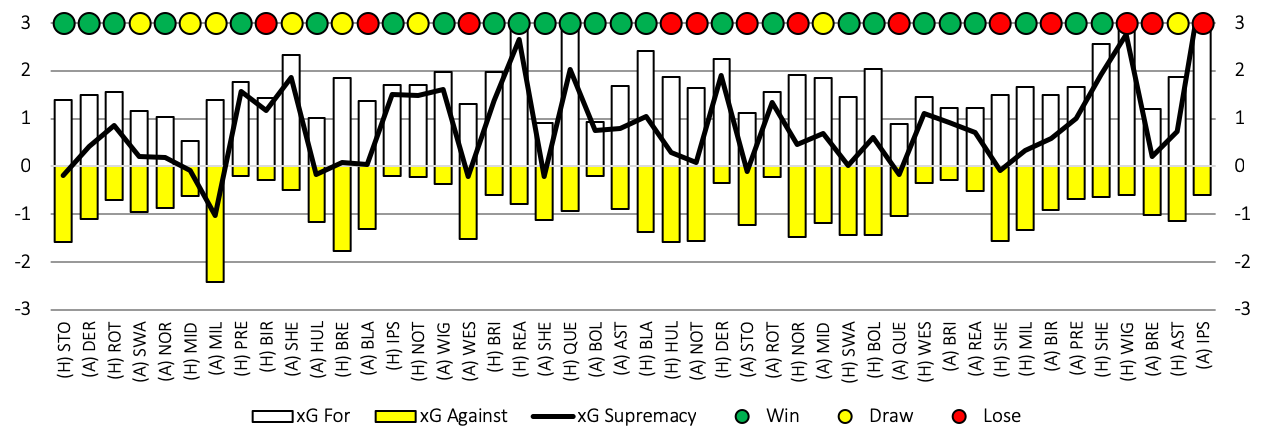
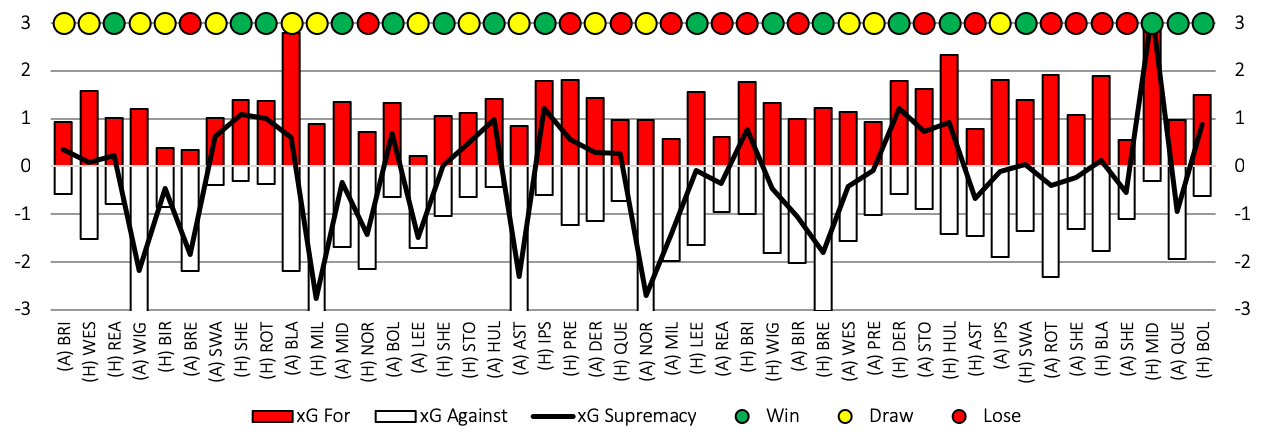
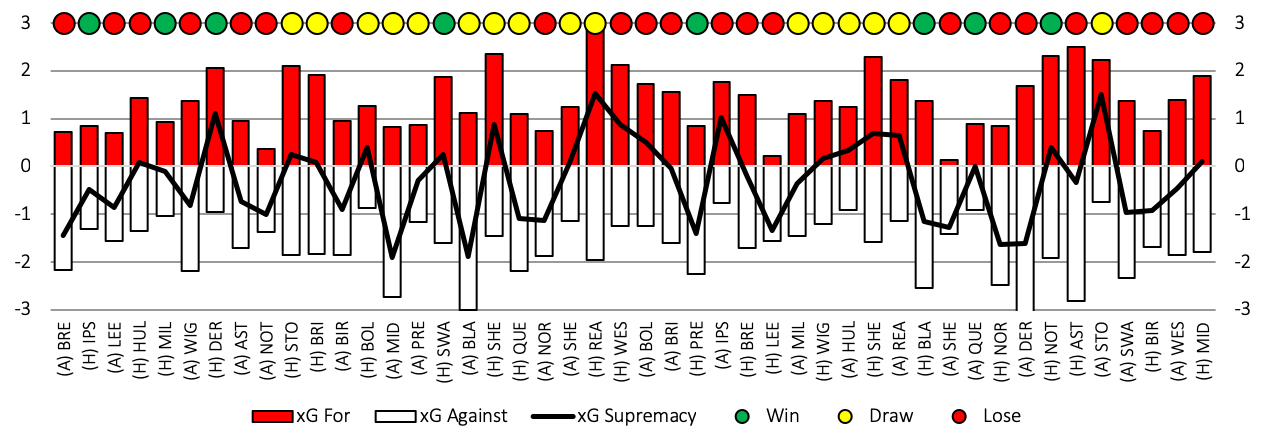
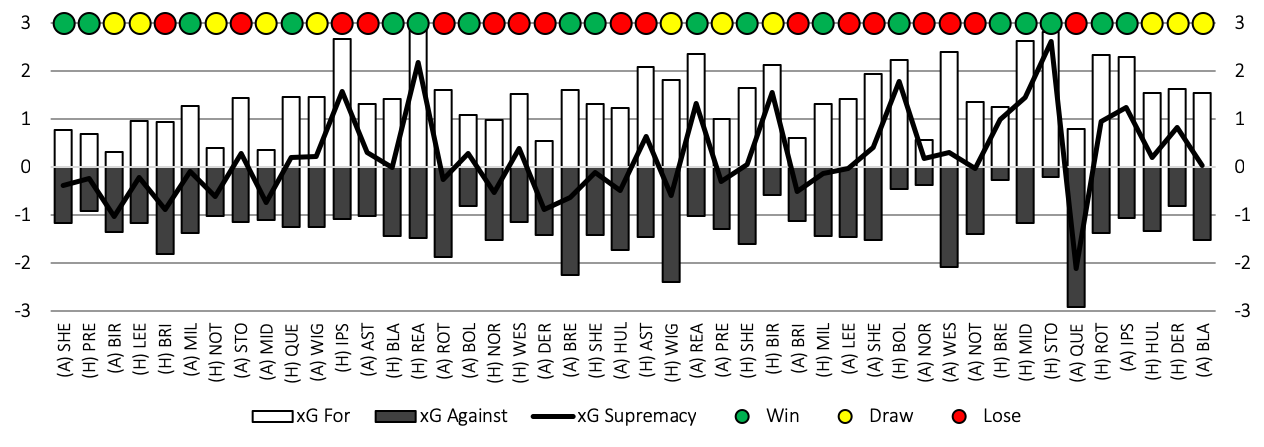
Fulham only had an outside chance of getting an automatic spot and just failed in the end. They finished in fourth exactly where the expected goals model placed them but finished the season well.
Fulham have spent a large section of the season in the play-offs. The Cottagers were in 12th following the early period of four winless games (3 draws and 1 defeat) but bounced back strongly. The following game at home to Wigan Athletic (won 2-0) was the best performance of the season.
The initial August – September ultimately ended in a W-D-L record of 4-3-2 and was the best expected goals performance all season. Thereafter the defence gave up more chances on average and consequently conceded more goals. The post lockdown June to July months was when the Cottagers created the poorest quality of chances.
Scott Parker started the season in a 4-3-3 formation which was largely used throughout. Come the end of the season it was the 4-2-3-1 formation which was used. Performance was largely similar with the 4-3-3 picking up slightly more points per game. Expected goals data would indicate that the 4-2-3-1 formation is the superior due to the fewer quality chances conceded.
Cardiff City
#
Team
G
W
D
L
GF
GA
GD
Pts
PPG
xGF
xGA
xGD
xPts
xPPG
xG#
5
Cardiff City
46
19
16
11
68
58
10
73
1.59
63
66
-3
62
1.34
14
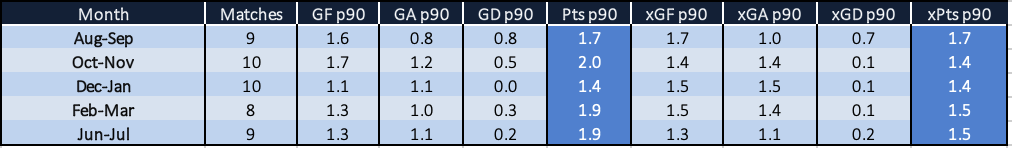
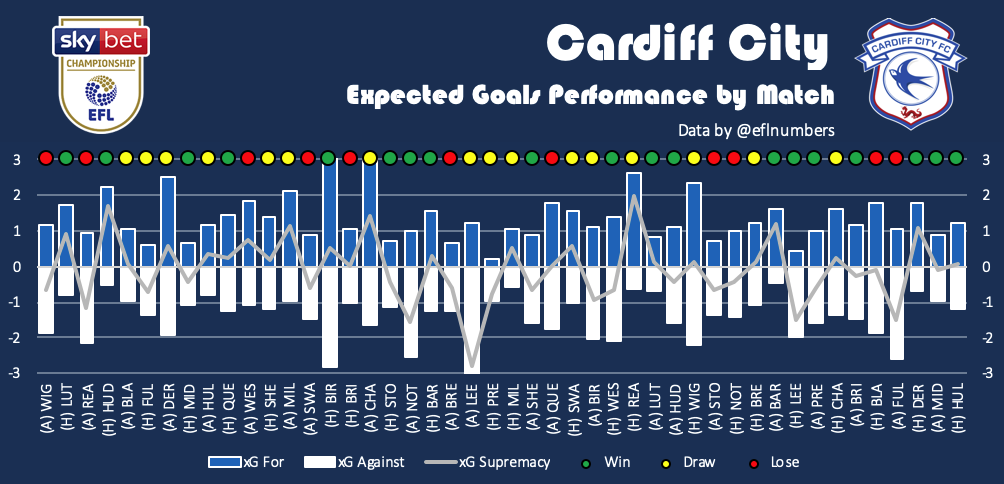
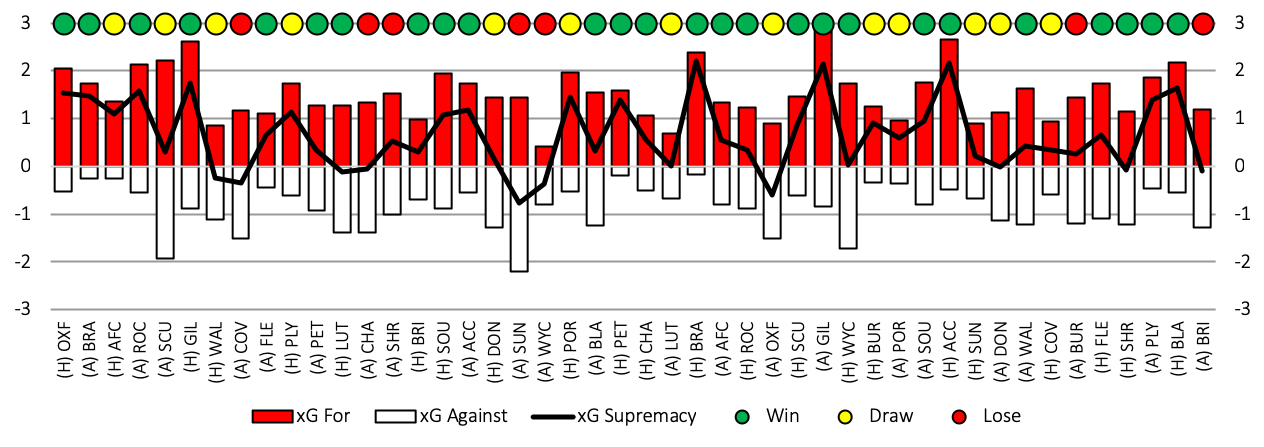
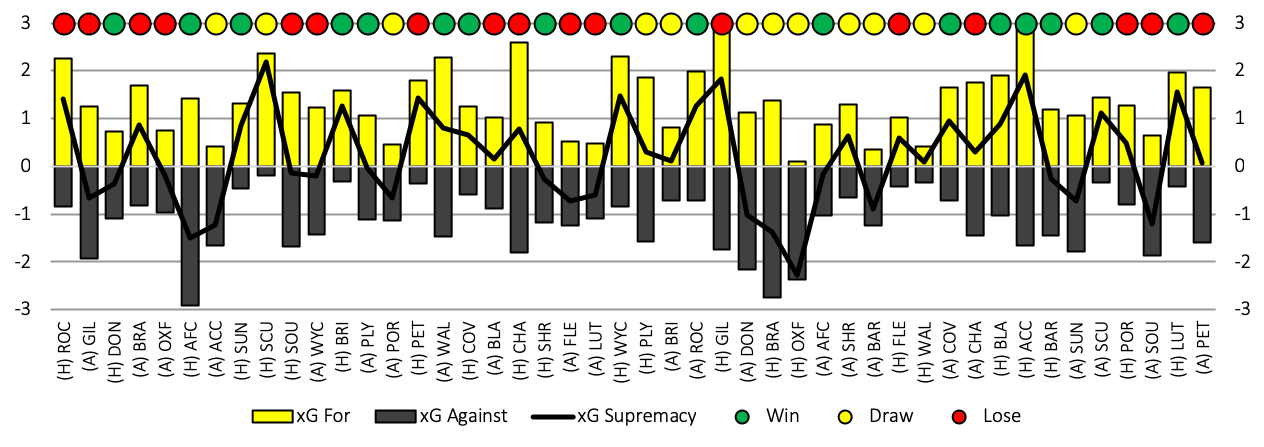
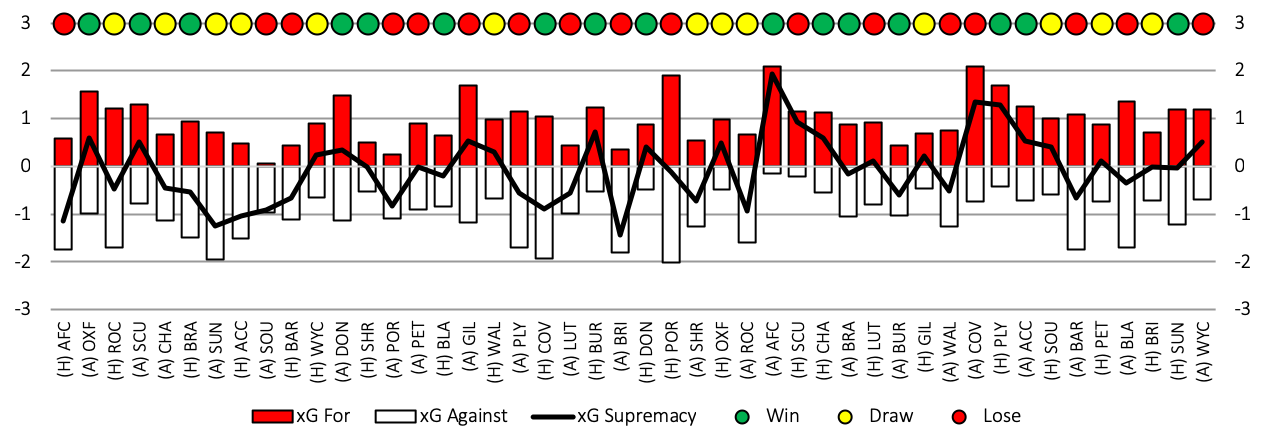
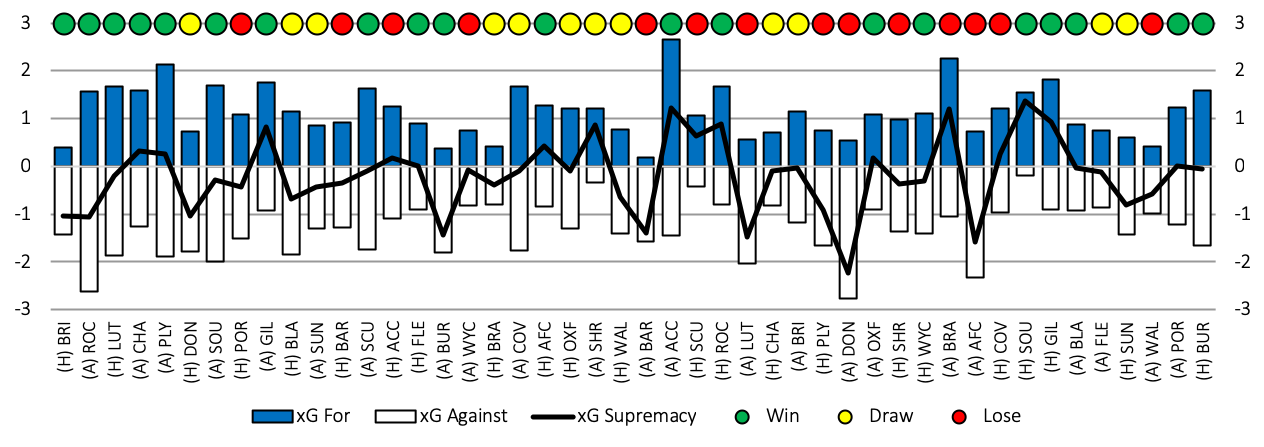
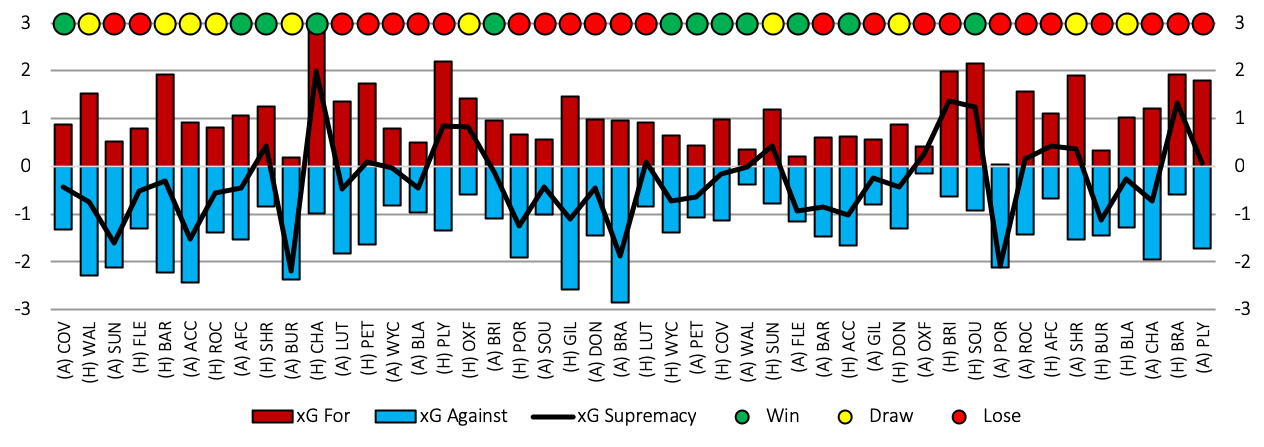
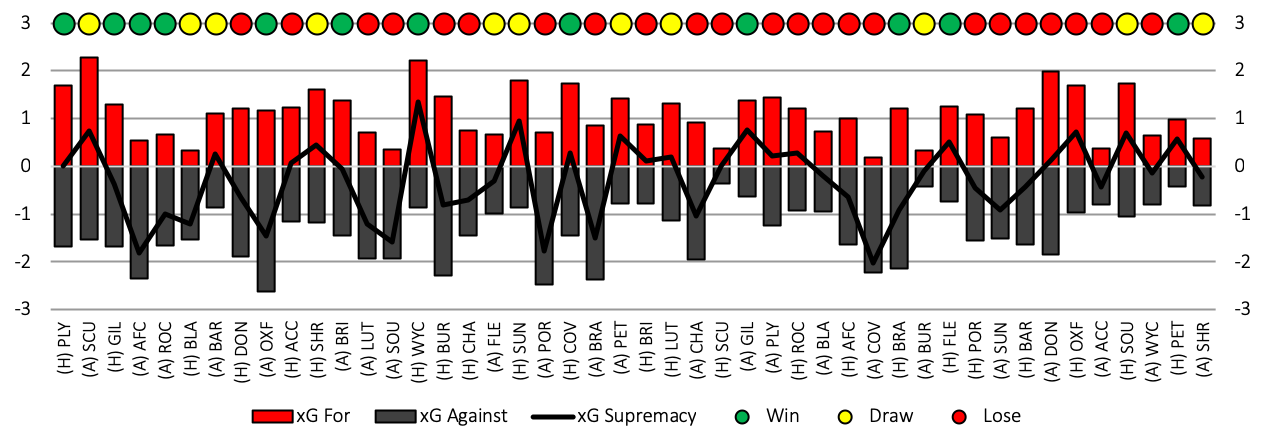
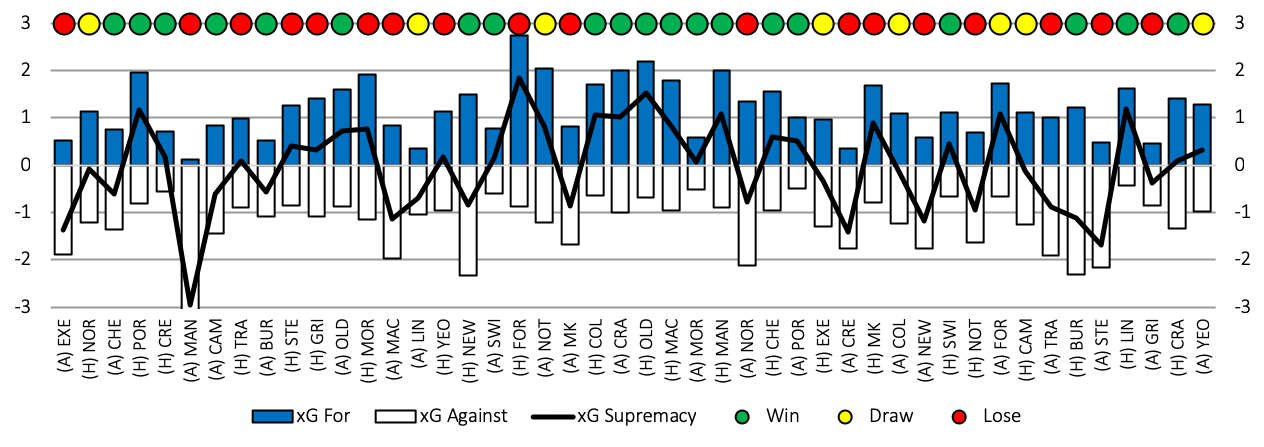
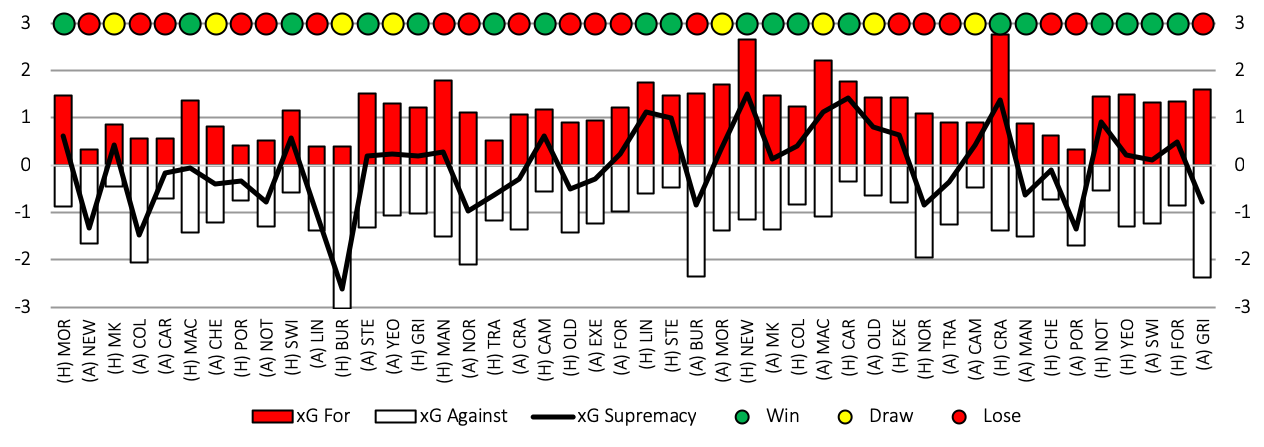
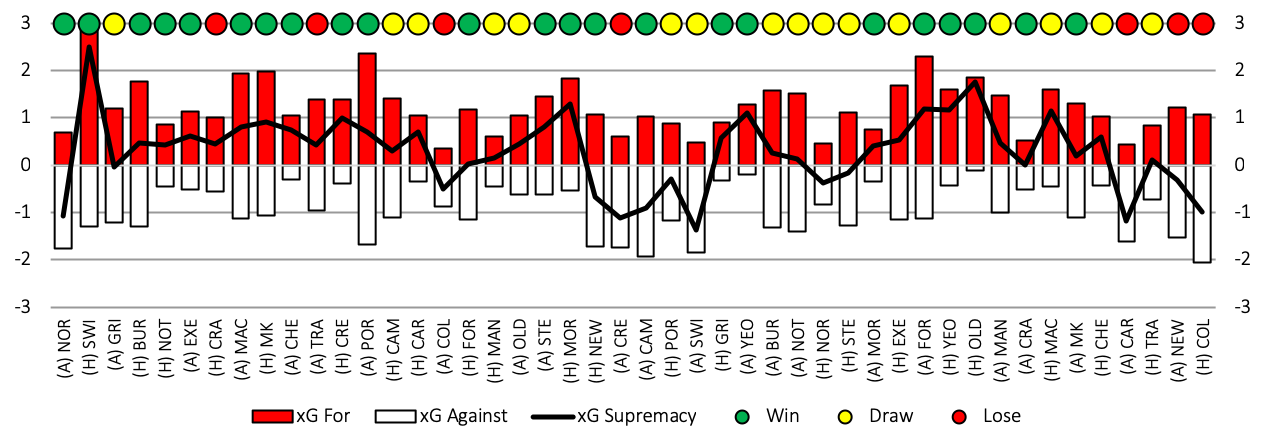
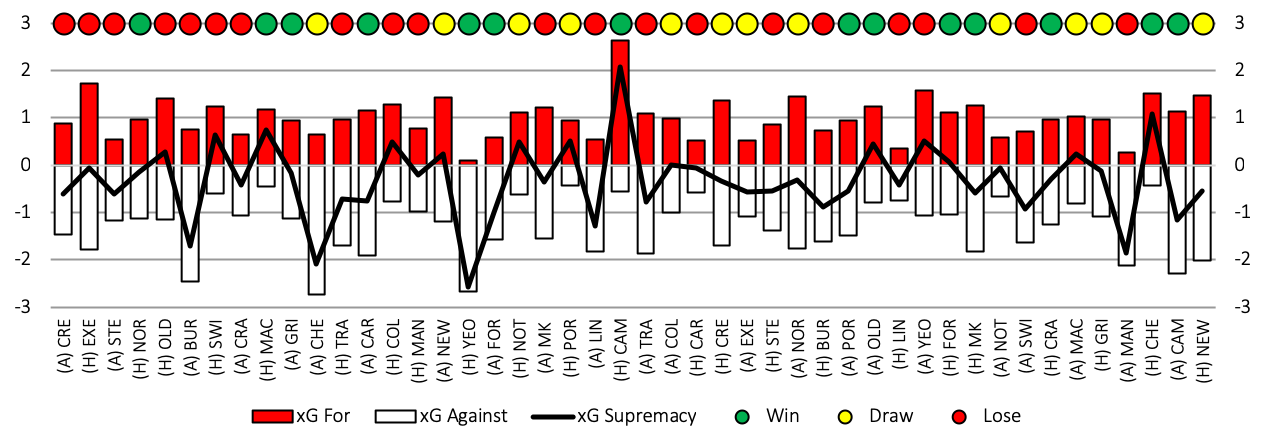
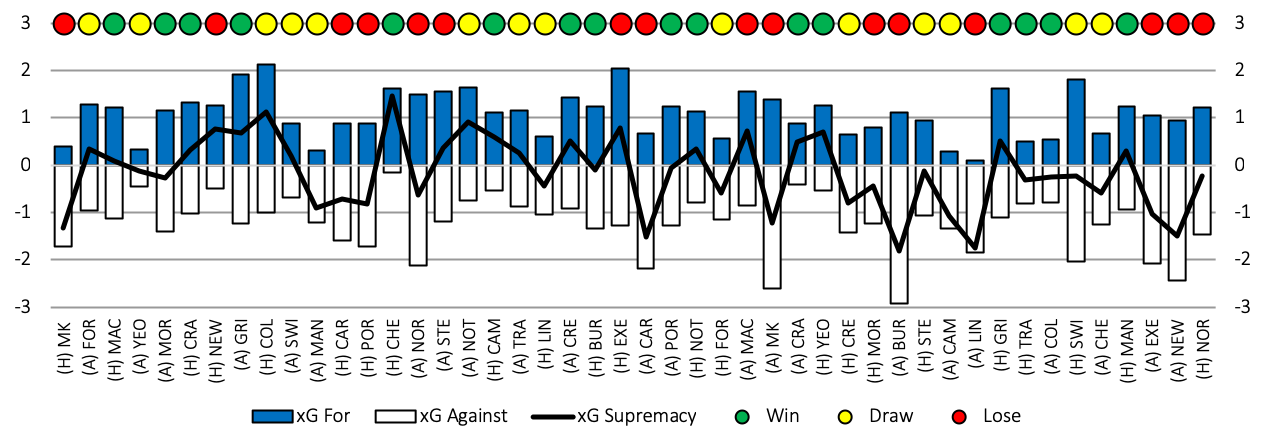
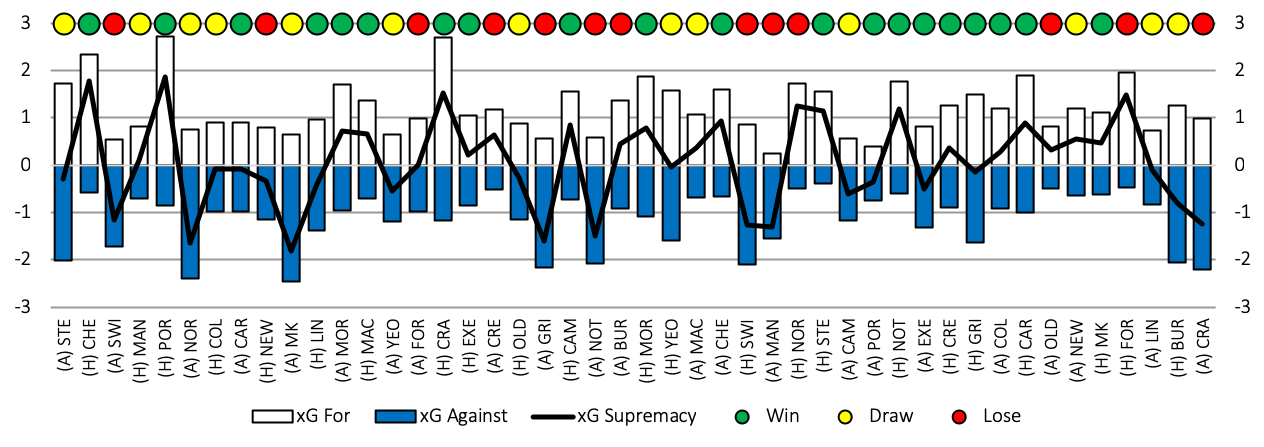
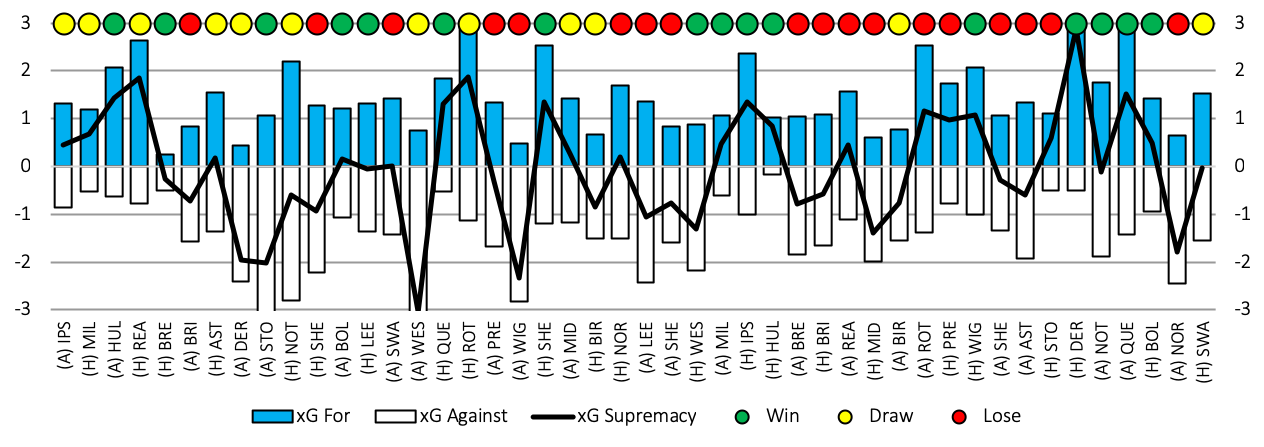
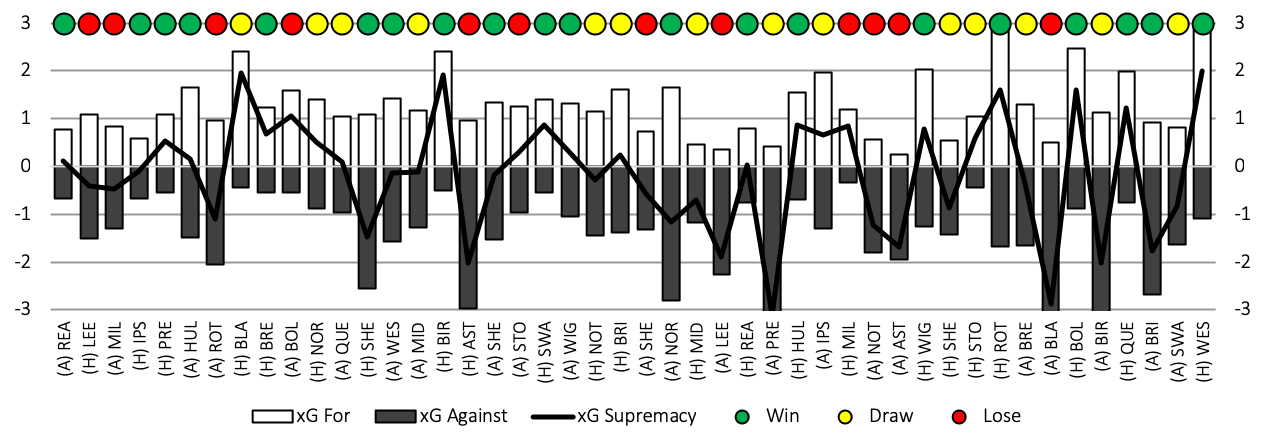
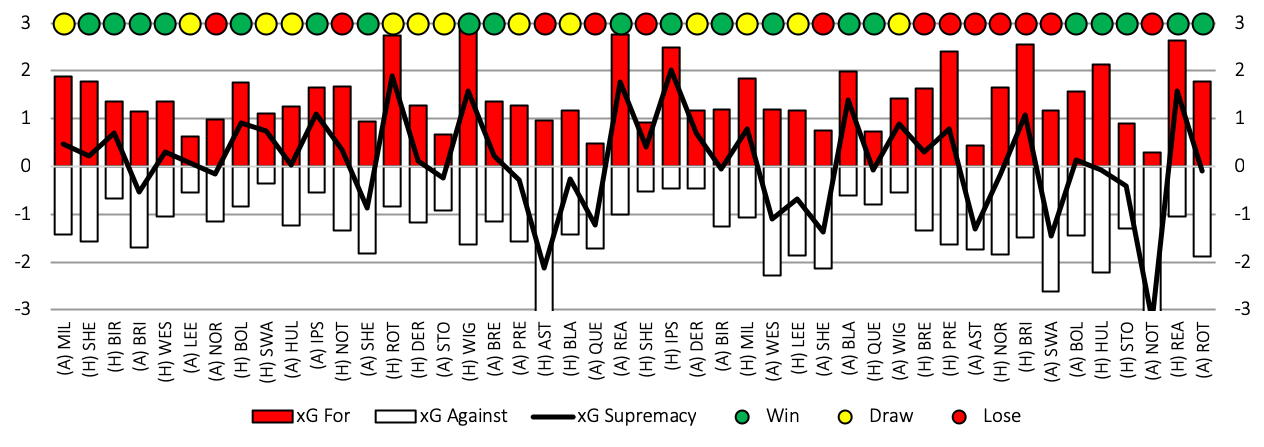
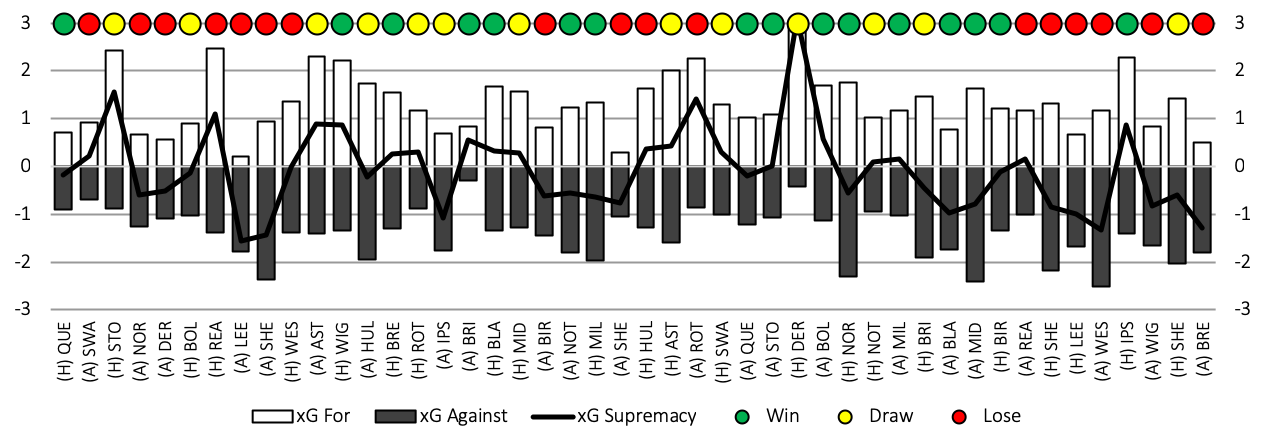
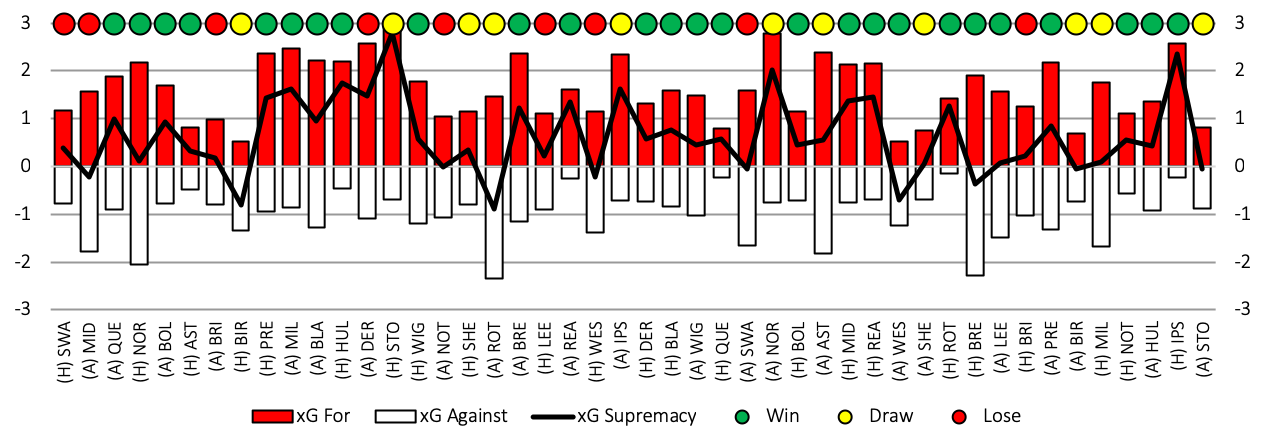
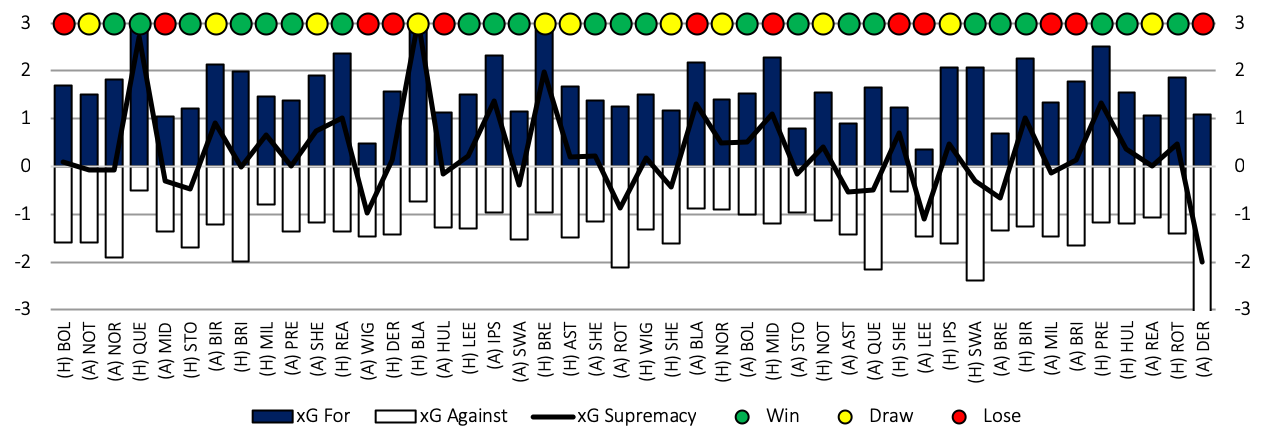
Cardiff City would have settled for 6th coming out of lockdown but ultimately finished in 5th due to a good run of form towards the end of the season. Although they finished in the play-offs spots the expected goals data only ranks them as the 14th best team in the league and the weakest to make the playoffs. The Bluebirds conceded 58 goals during the season, the highest of the playoff quartet so they will need to improve defensively, xG implies they should have conceded 66.
Cardiff’s start to the season was mixed and predominately spent in the bottom half resulting in Neil Warnock losing his job in November after defeat against Bristol City. The problem this season has been the good performances haven’t resulted in three points. Even in the post Warnock era both the visit to Charlton Athletic and the home game against Reading should have been comfortable wins but ended all square.
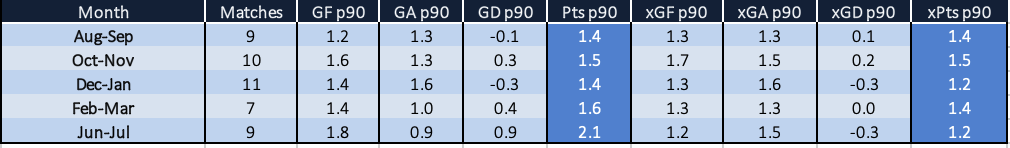
On the whole though many will say that Neil Harris has done a good job though, epitomised by the post lockdown form. The 9 game period in June and July resulted in a W-D-L record of 7-1-2. 2.1 points per game is Champions standard. The negative is that although results improved the process didn’t. Expected goals indicates Harris’ Cardiff were actually poorer than in Warnock’s time.
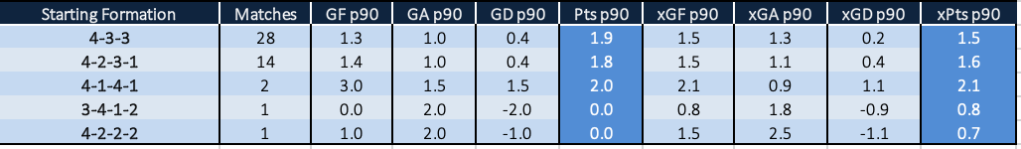
Both Warnock and Harris favoured the 4-2-3-1 formation but it’s interesting that the 4-3-3 wasn’t used more often. The Bluebirds never lost in 7 games in that setup (3 wins and 4 draws) scoring more and conceding fewer than the 4-2-3-1. Expected goals would back up that it’s the better formation.
Swansea City
#
Team
G
W
D
L
GF
GA
GD
Pts
PPG
xGF
xGA
xGD
xPts
xPPG
xG#
6
Swansea City
46
18
16
12
62
53
9
70
1.52
67
68
-1
62
1.35
12
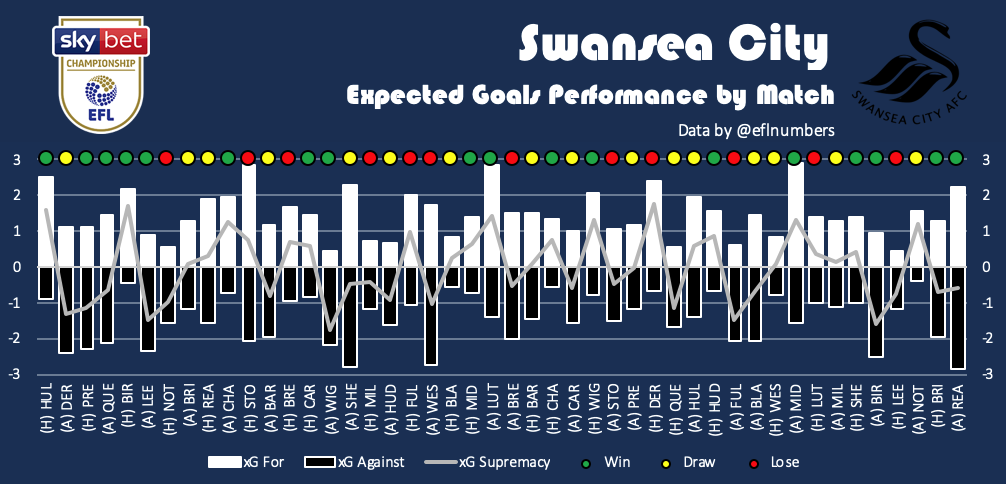
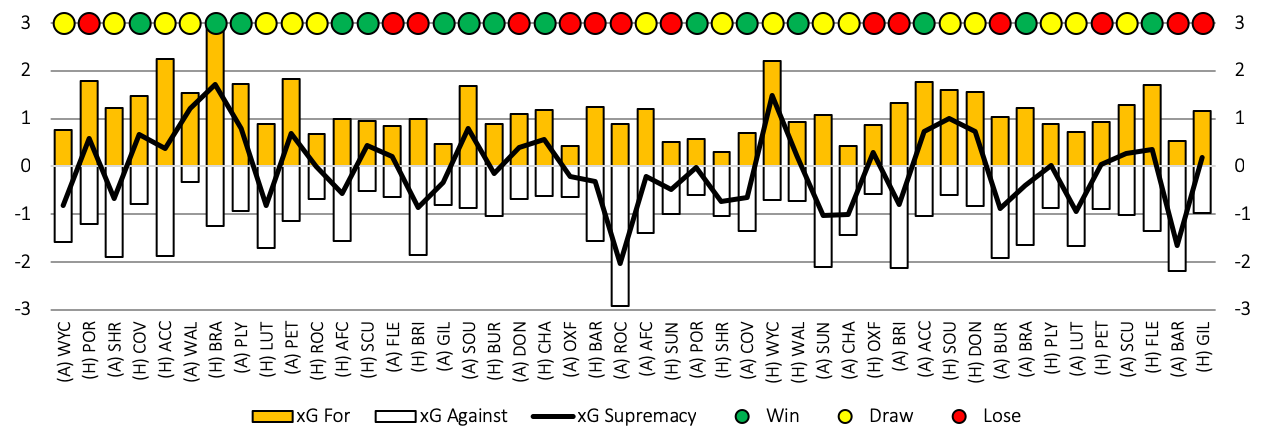
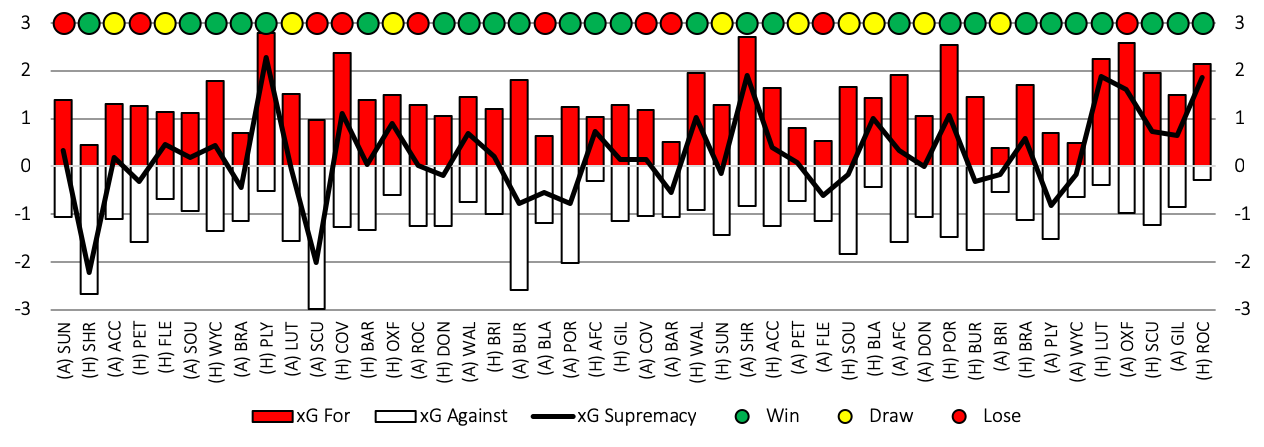
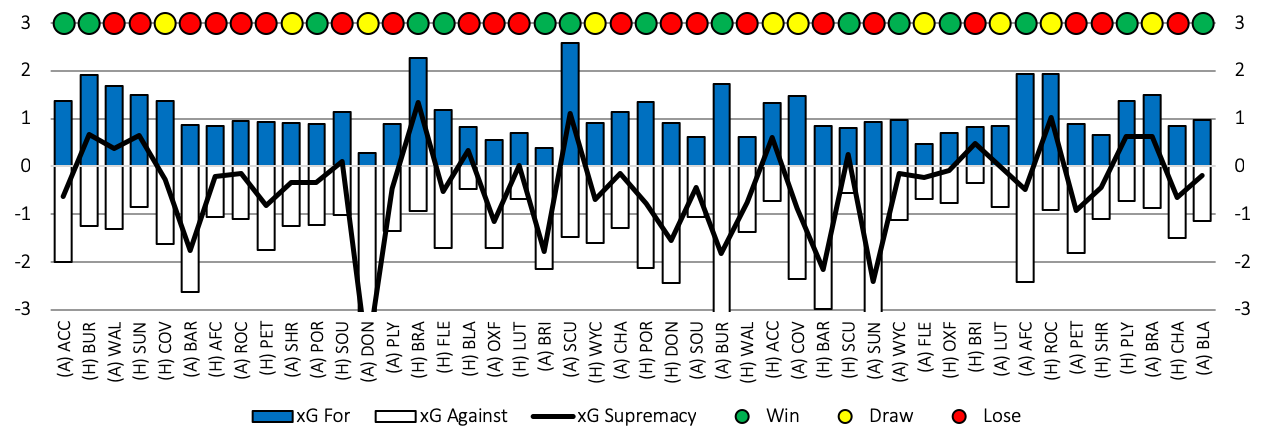
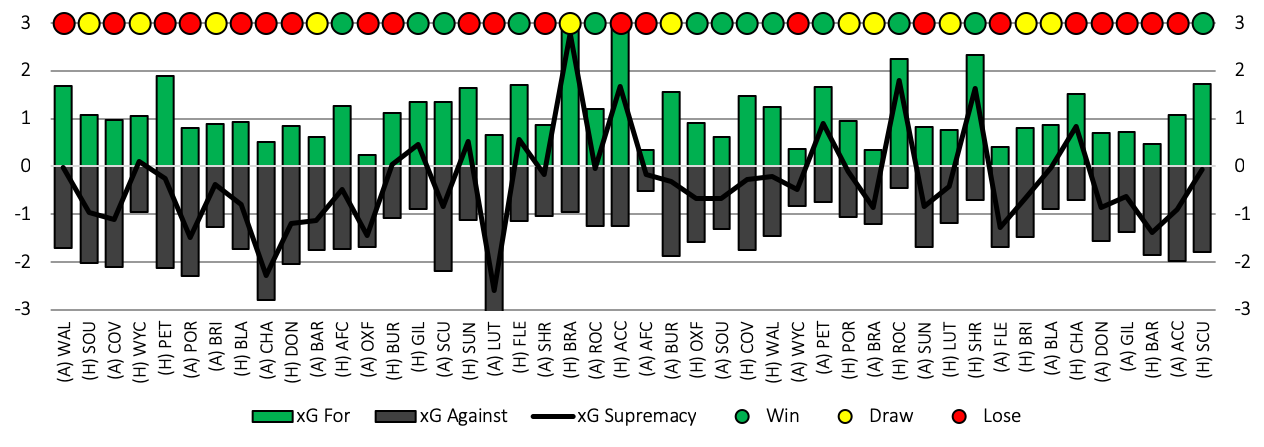
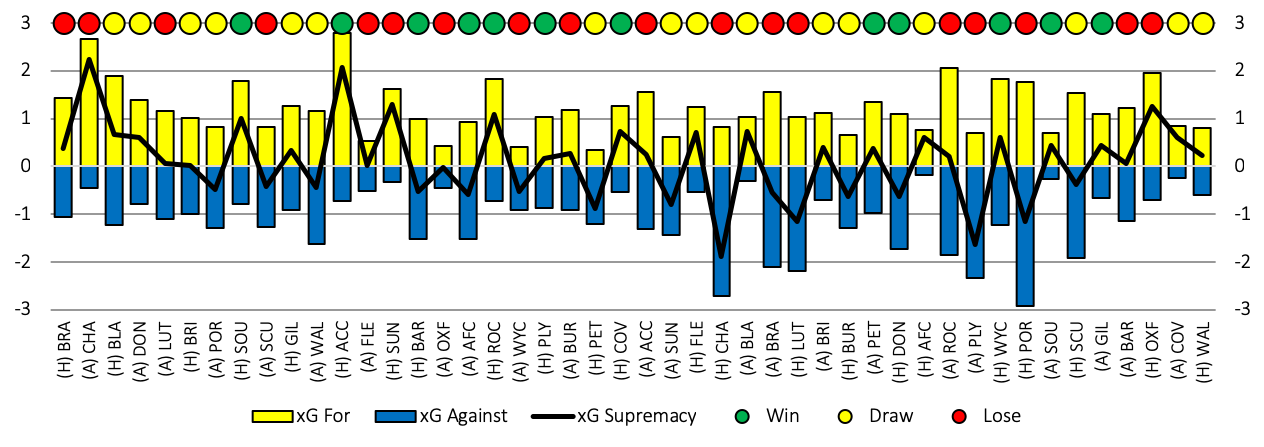
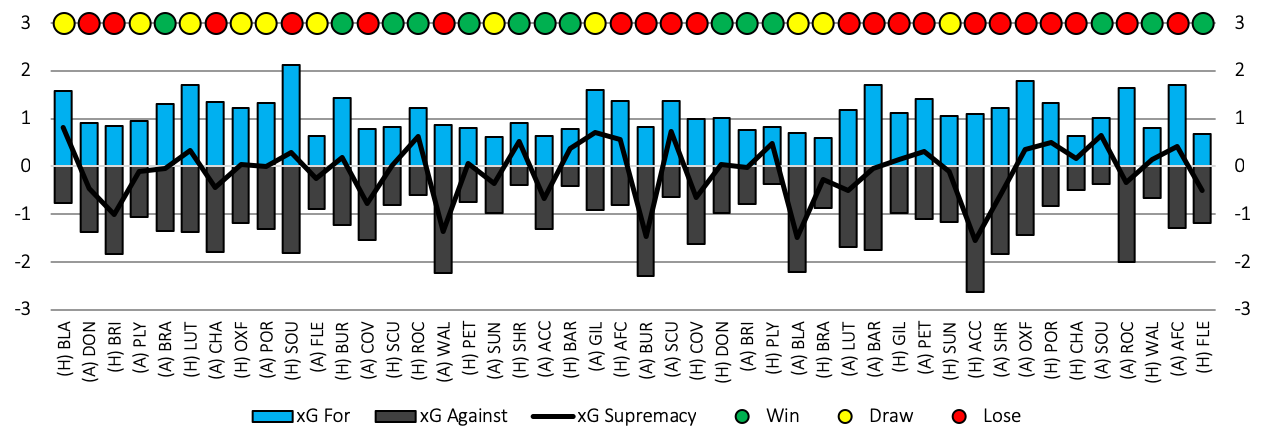
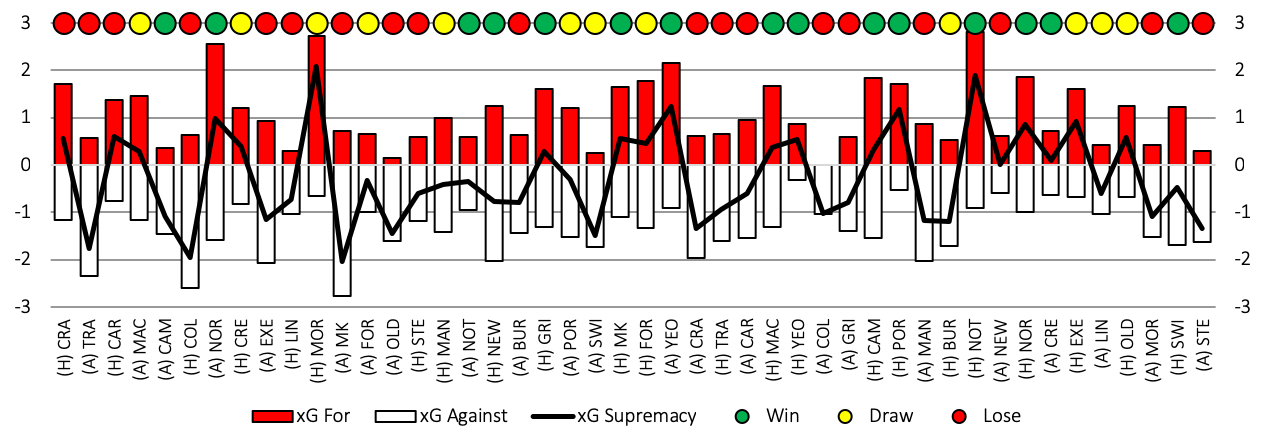
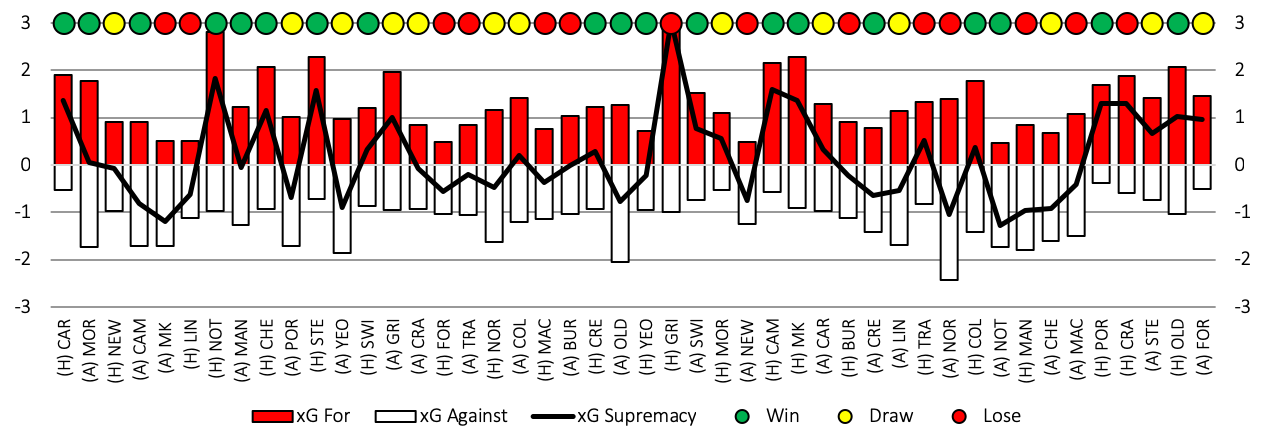
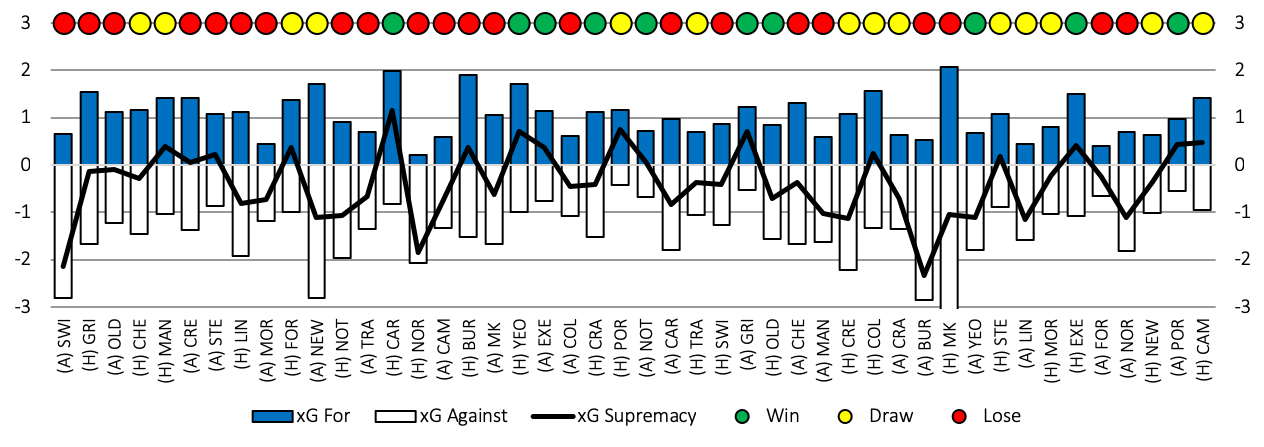
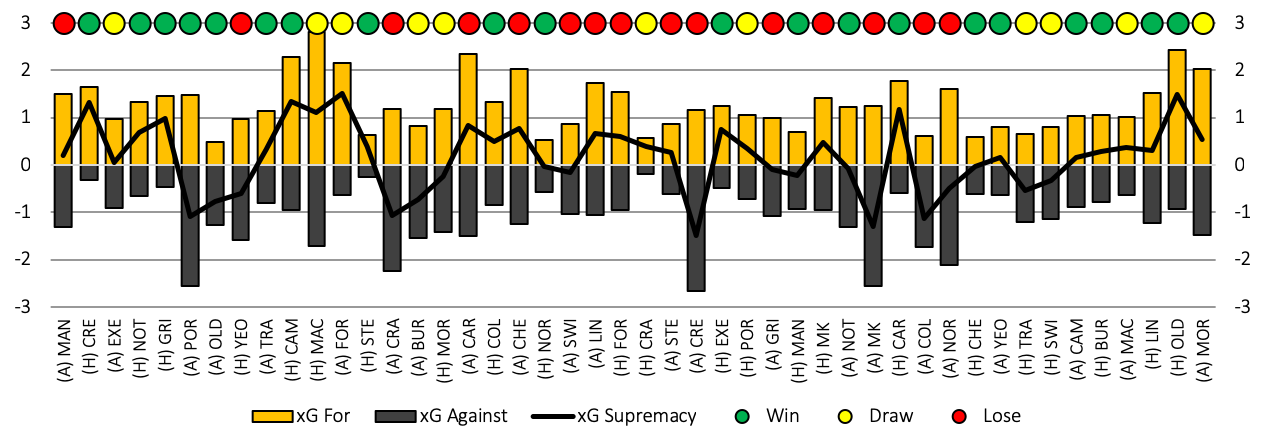
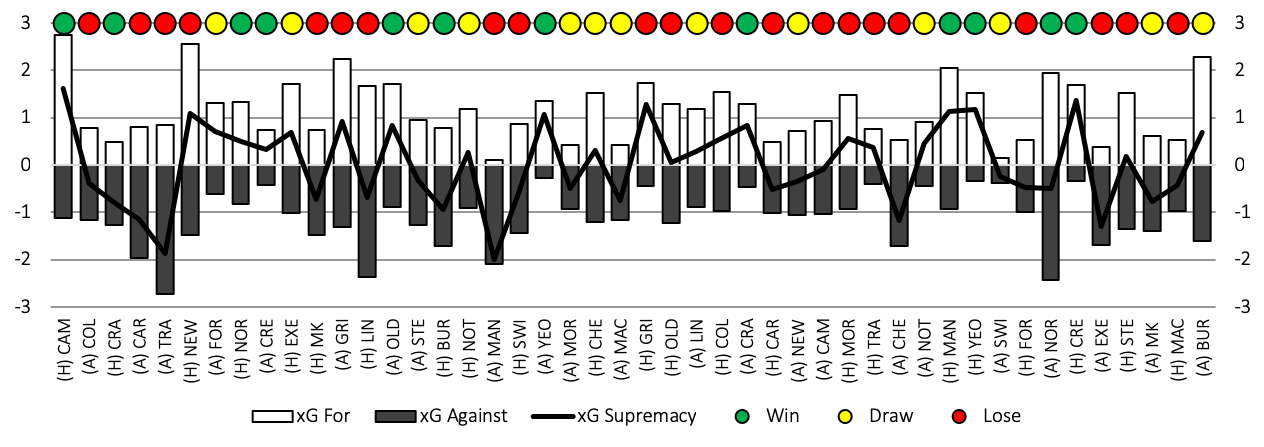
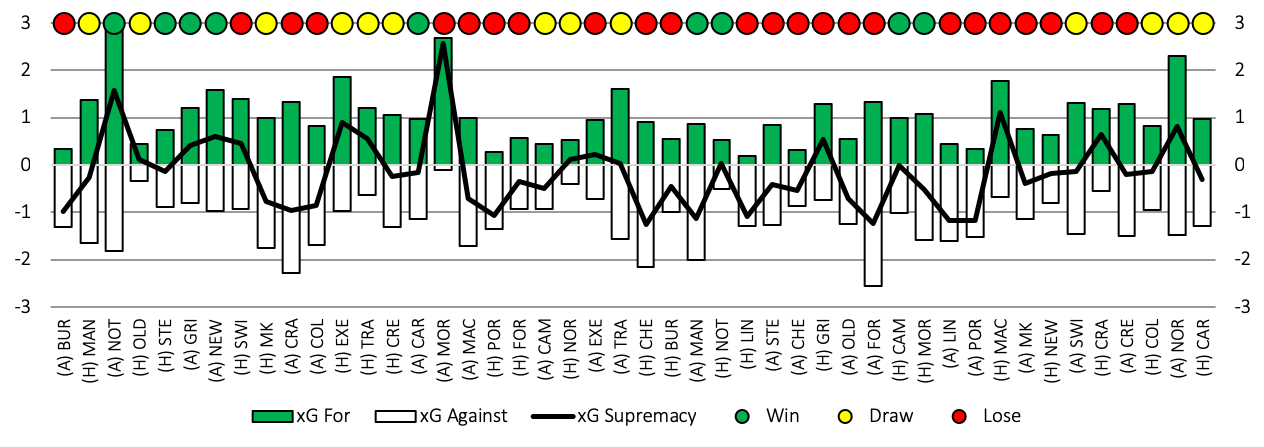
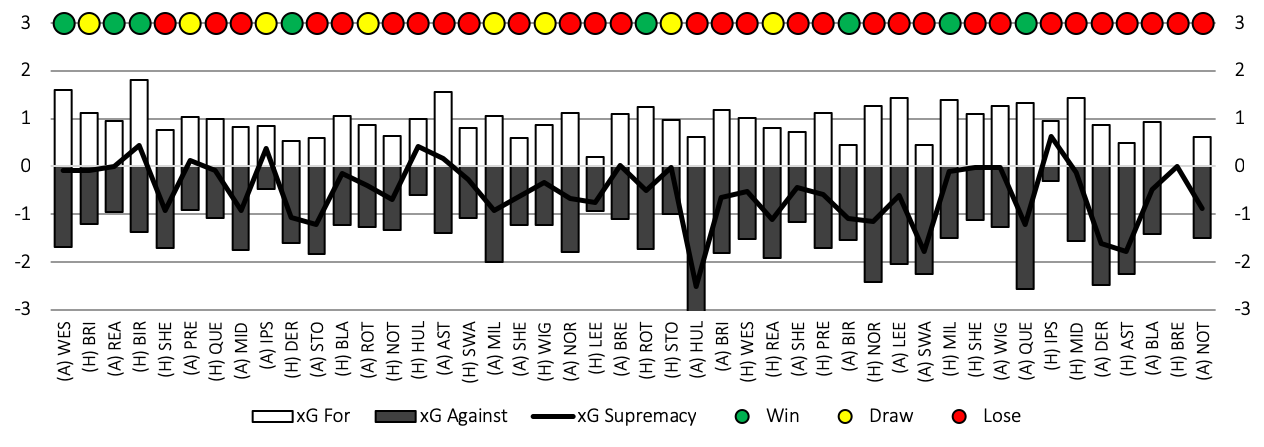
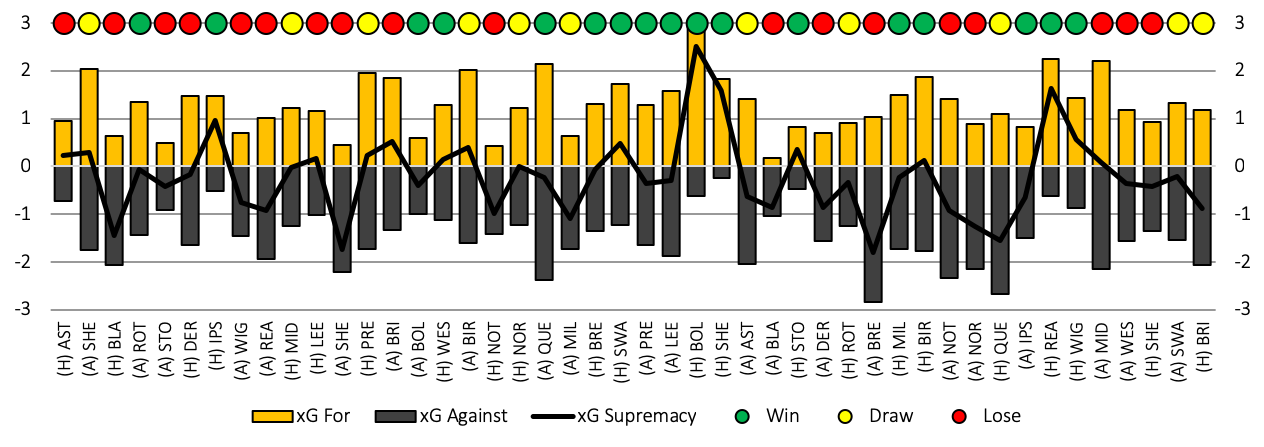
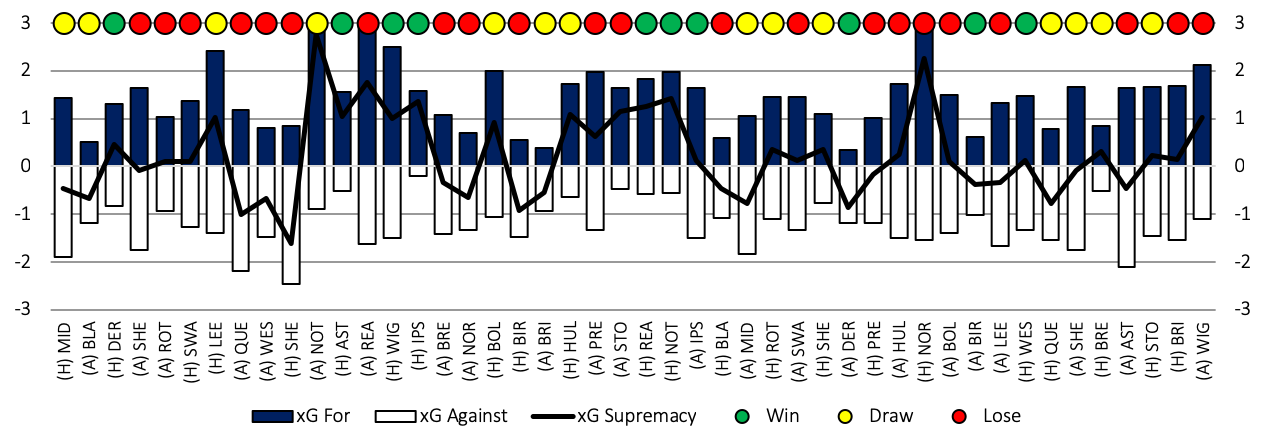
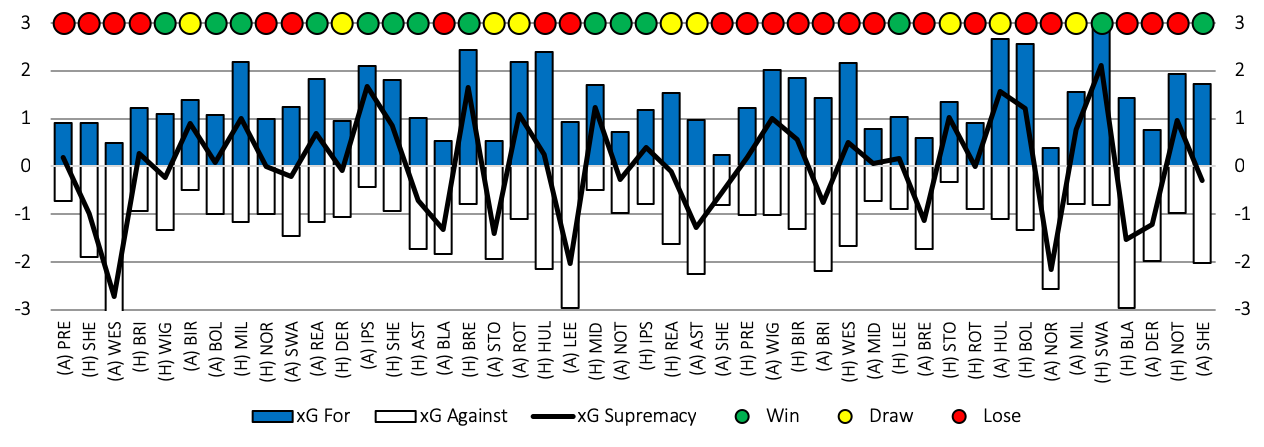
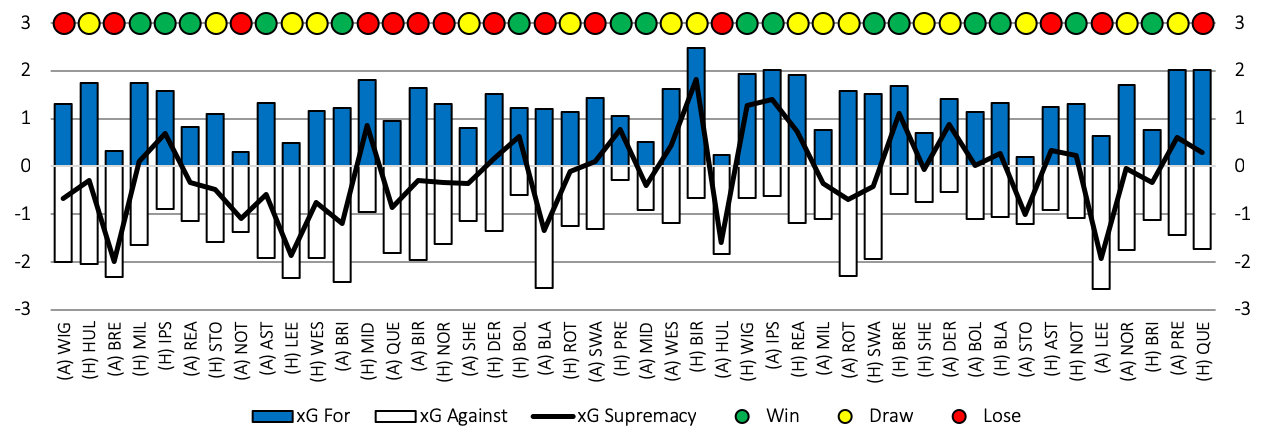
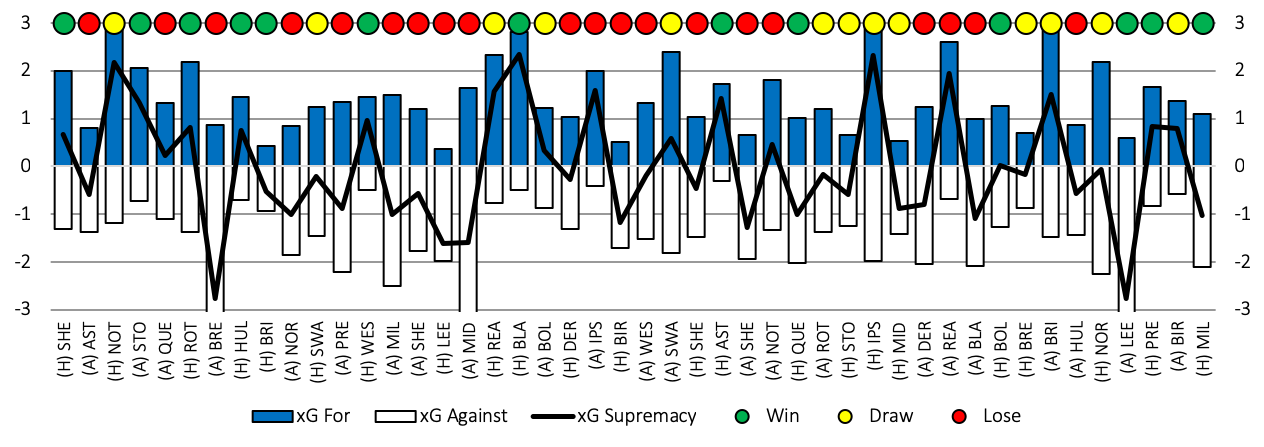
The last team of the play-off quartet did not finalise their place until injury time on the final day. The expected goals model indicating they shouldn’t have been this close, ranked at just 12th. They scored the fewest of the play-off hopefuls but xG does indicate they underperformed on that front. It was defensively where the goals conceded should have been 15 higher.
The Swans flew out of the traps ending August in 1st with a W-D-L record of 5-1-0 including an impressive salvo in the 2-0 win against Hull City on the opening day. They gradually slipped thereafter dropping to a low of 11th before rebounding into the play-offs following some late drama.
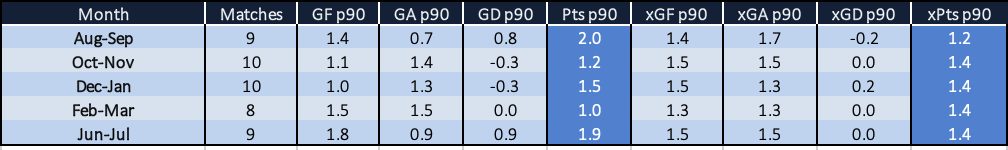
The season was bookended in terms of points per game with a strong start and a strong finish. The first spell helped by a strong defence and the second spell by free flowing scoring. Interestingly though the expected goals have been constant throughout. The opening two months was actually the poorest in terms of expected points due to the quality of chances conceded.
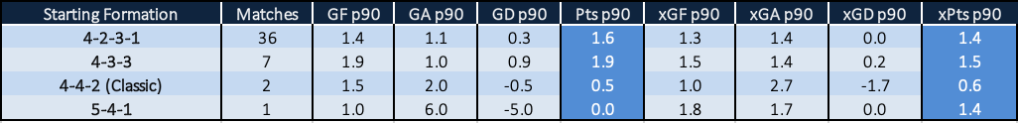
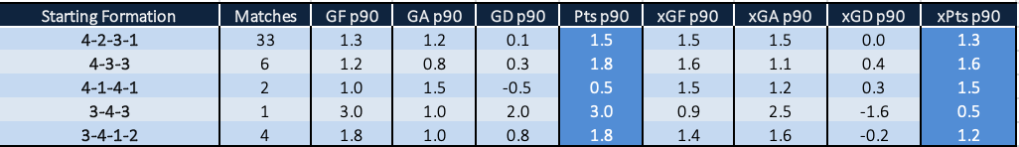
The 4-2-3-1 formation was the favourite, but similar to Cardiff City, it’s surprising the 4-3-3 wasn’t used more often. The 4-3-3 was used in a 6 game consecutive period in December/January and yielded 11 points (3 wins, 2 draws and 1 defeat) with expected goals also highlighting the strength of the alternative.
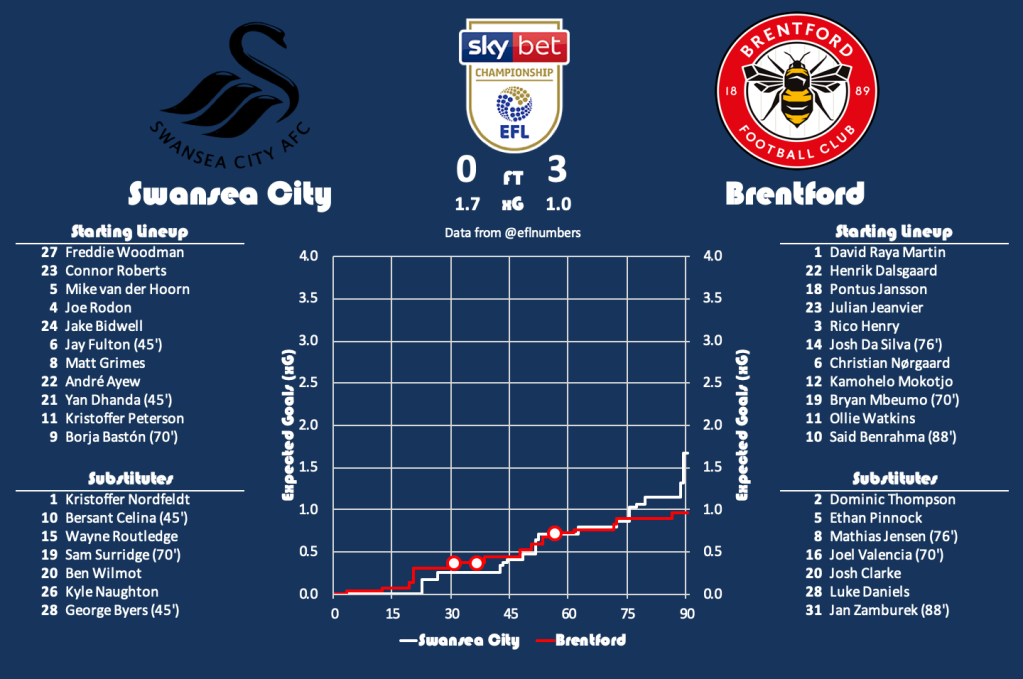
Swansea City (6th) v Brentford (3rd)
The play-offs kick off on Sunday evening with Swansea City hosting Brentford at the Liberty Stadium before the return leg at the Griffin Park three days later.
Swansea played host on the 22nd October 2019 in a 3-0 win for the Bees but the expected goals data indicated Swansea created the better chances that day.
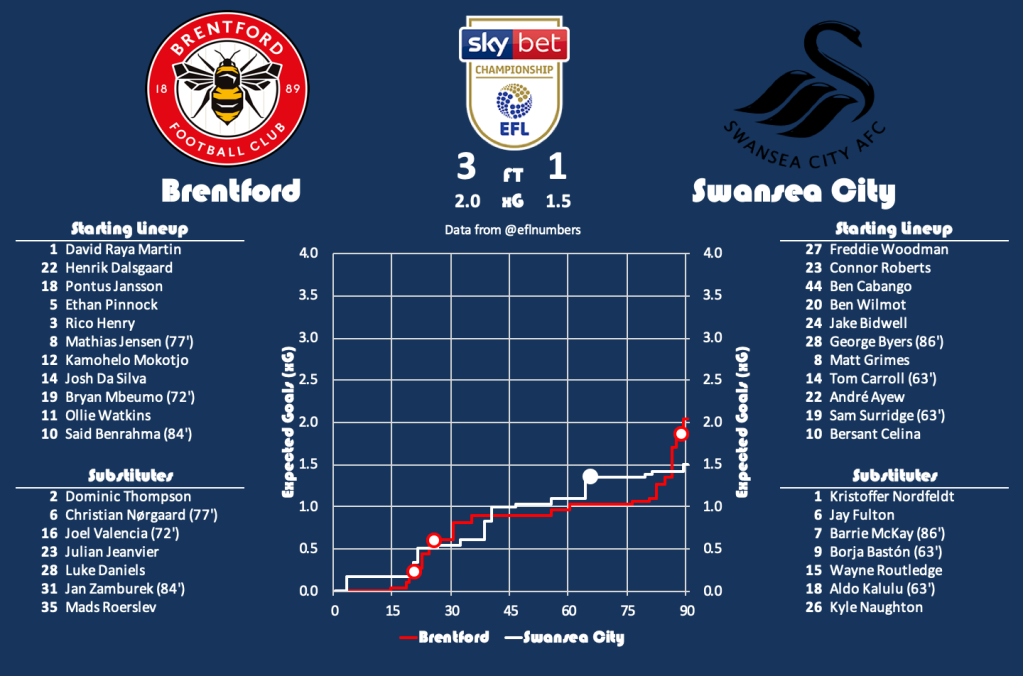
The return leg on the 26th December 2019 also saw a Bees victory, 3-1 this time, but again the expected goals data had the match closer than the final score.
Finishing 2nd (Brentford) and 12th (Swansea City) in my expected goals table implies both of these teams season should have been already over but that’s football and both now have an opportunity to reach Wembley. To calculate the expected match probabilities I use a rolling 46 game season of data to estimate the strength of each team.
A poisson distribution estimates the following probabilities for the number of combined goals scored across the ties.
0
1
2
3
4
5
6
Brentford
3%
10%
18%
21%
19%
13%
8%
Swansea City
15%
28%
27%
17%
8%
3%
1%
My model has Brentford as the strong favourites to make the final, even more likely than forecasted than the bookmakers, and therefore this is the value play.
Modelled Probability
Bookmakers Odds
Bookmakers Probability
Difference
Brentford
77.9%
4/11
73.3%
4.6%
Swansea City
22.1%
9/4
30.8%
-8.7%
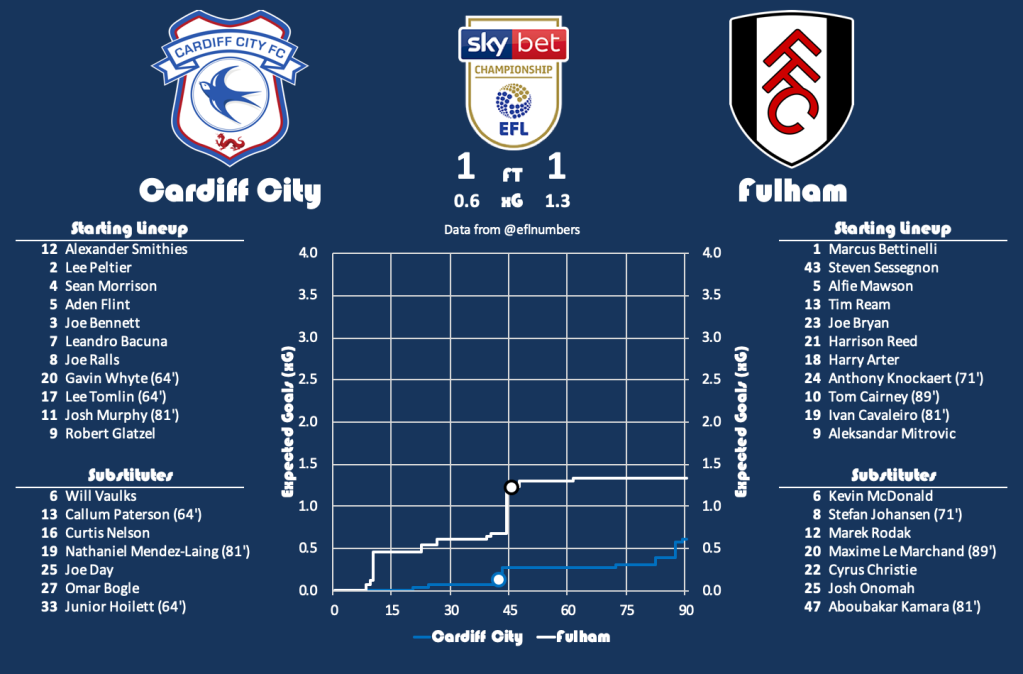
Fulham (4th) v Cardiff City (5th)
The first legs concludes with Fulham travelling to Cardiff on Monday with the reverse leg three days later at Craven Cottage Park.
The first head to head to head saw Cardiff City as the hosts in a 1-1 draw on the 30th August 2019. Fulham shaded it that day with Cardiff creating very little.
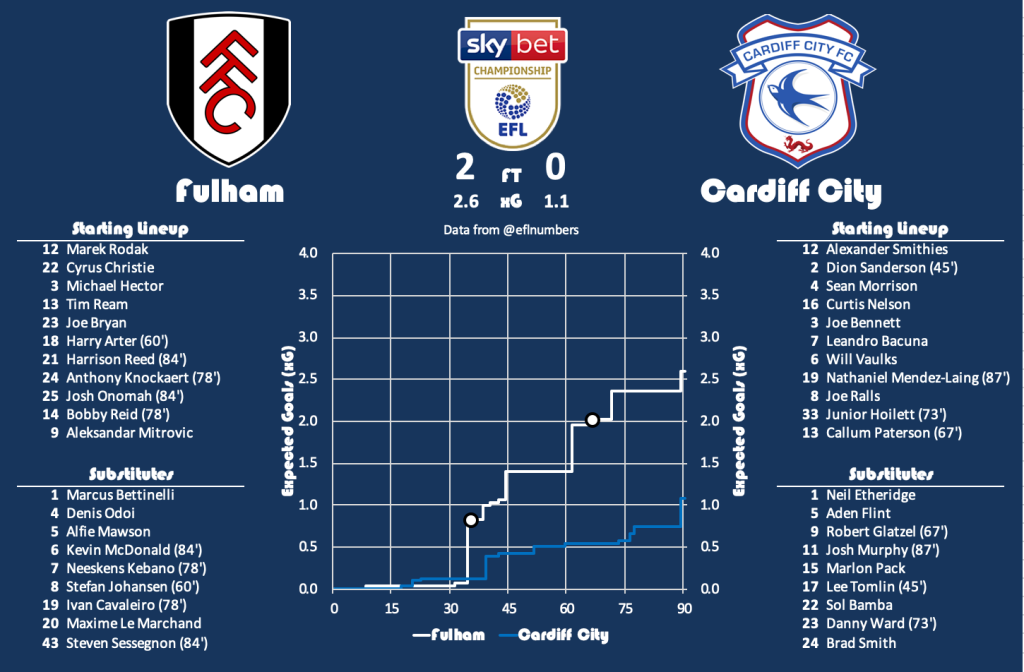
The second game was more open with Fulham running out 2-0 winners at Craven Cottage. After a quiet first 30 minutes Fulham broke the dreadlock and were deserved winners thereafter.
4th (Fulham) plays 14th (Cardiff City) based on my expected goals and this match is almost as one sided as the other match. As per the other play-off I will calculate the expected match probabilities using a rolling 46 game season of data to estimate the strength of each team.
A poisson distribution estimates the following probabilities for the number of combined goals scored across the ties.
0
1
2
3
4
5
6
Fulham
4%
13%
21%
22%
18%
11%
6%
Cardiff City
8%
20%
25%
22%
14%
7%
3%
The model rates Fulham as the favourites to reach Wembley, slightly more than the bookmakers, but is not above the 3% threshold for a betting selection and therefore nothing is advised.
Modelled Probability
Bookmakers Odds
Bookmakers Probability
Difference
Fulham
60.3%
8/11
57.9%
2.4%
Cardiff City
39.7%
11/10
47.6%
-7.9%
Outright
Given how the expected goals data rates it is not surprise it forecasts the final to be Brentford against Fulham. The model thinks Brentford are the right favourites with a 55% chance but thinks there is huge value in the price. The hierarchy of the remaining teams match those of the bookmakers but they are all equally bad value.
Following the previous posts detailing how I have created a betting a model using expected goals data, link below, and a prediction for the League Two play-offs it’s now time to turn Mystic Meg once again to predict the outcome of the League One play-offs.
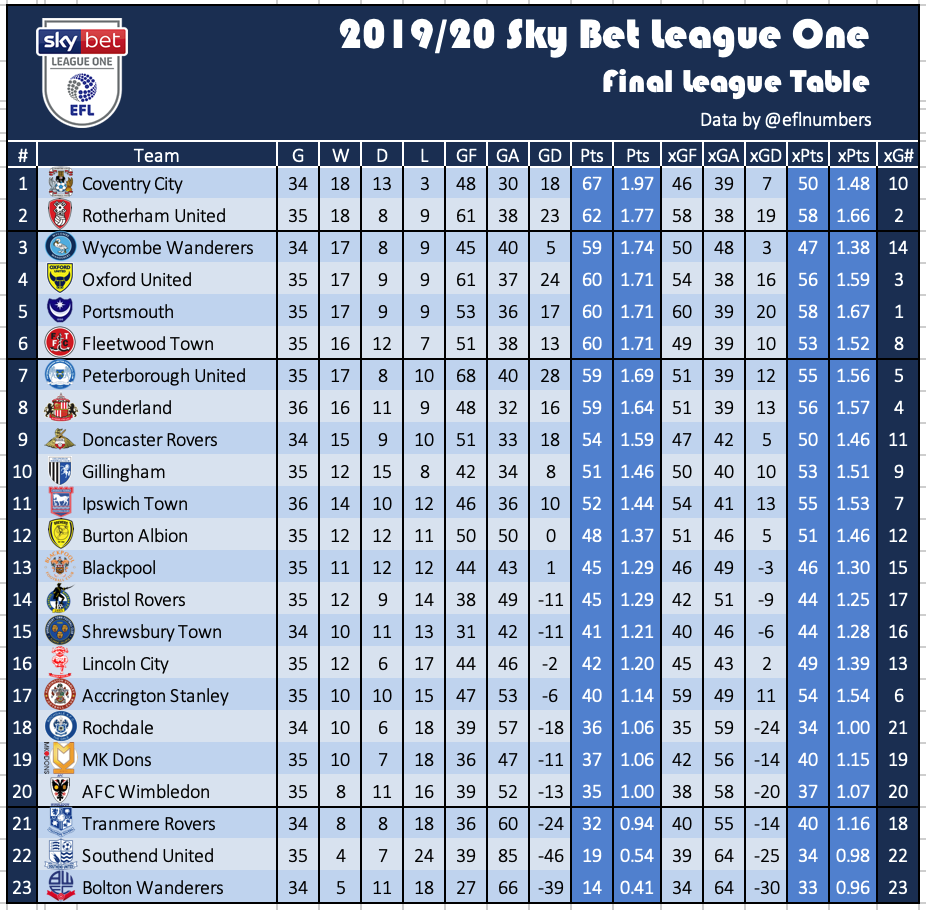
With Coronavirus halting football across England, League One ultimately (and reluctantly in some cases) followed League Two’s lead using points per game to finish the season. The automatic spots and a place in next season’s Championship went to Coventry City (ranked as 10th best by my model) and Rotherham United (2nd highest ranked). Behind that came the cavalry.
Six teams were separated by one point and with only four play-off spots available it was Wycombe Wanderers, Oxford United, Portsmouth and Fleetwood Town who still have an opportunity for glory.
Wycombe Wanderers
#
Team
G
W
D
L
GF
GA
GD
Pts
Pts
xGF
xGA
xGD
xPts
xPts
xG#
3
Wycombe Wanderers
34
17
8
9
45
40
5
59
1.74
50
48
2
47
1.38
14
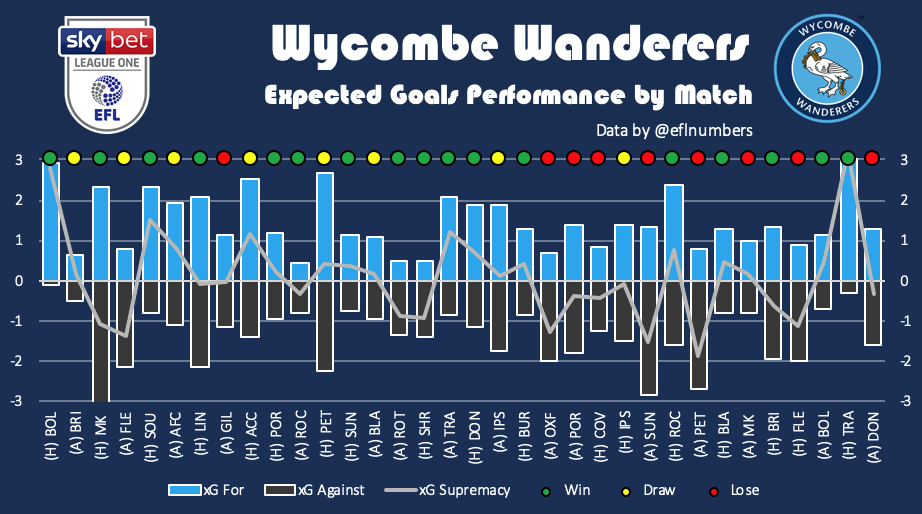
At the time of the halt Wycombe Wanderers were in 8th and the old adage of points on the board are better than games in hand was not correct in this instance with a points per game table catapulting them into 3rd. The table may appear to show them as the strongest of the play-off quartet but my expected goals data suggests they are the weakest. They only finished with a +5 GD, considerably lower than the teams around them, but my xG model calculates this should have been lower and only good enough for 14th place.
Wycome’s season is essentially summarised as good start, bad finish. The good included a 12 match unbeaten run, with 2 excellent performances at home to a weakend Bolton Wanderers on the opening day (won 2-0) and against relegated Tranmere Rovers (won 3-1). The bad involved a 5 match winless run in a particularly tricky period against multiple promotion rivals.
Prior to the away defeat at Oxford United during the end of December their W-D-L record was 12-7-1 and automatic promotion looked a formality. From that game onwards the form tailed off very quickly and a record of 5-1-8 means they are considered fortunate to have an opportunity in the play-offs. Put simply they became a lot more leaker at the back. Interestingly the expected goals data shows little fluctuation in performances between February and that awesome start but results ultimately were.
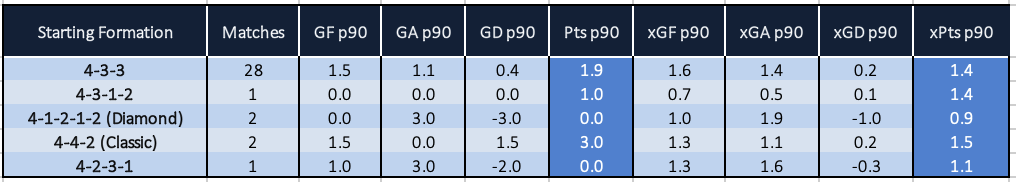
Gareth Ainsworth was pretty set in the 4-3-3 formation starting in that shape over 80% of the time, including both games against Fleetwood Town during the regular season, and is unlikely to change now. They have achieved 1.9 points per game in those games compared to 1.2 in the other 6 games aided by a 100% record in the two games in a classic 4-4-2. The expected goals implies it would be best to stick to the known.
Oxford United
#
Team
G
W
D
L
GF
GA
GD
Pts
Pts
xGF
xGA
xGD
xPts
xPts
xG#
4
Oxford United
35
17
9
9
61
37
24
60
1.71
54
38
16
56
1.59
3
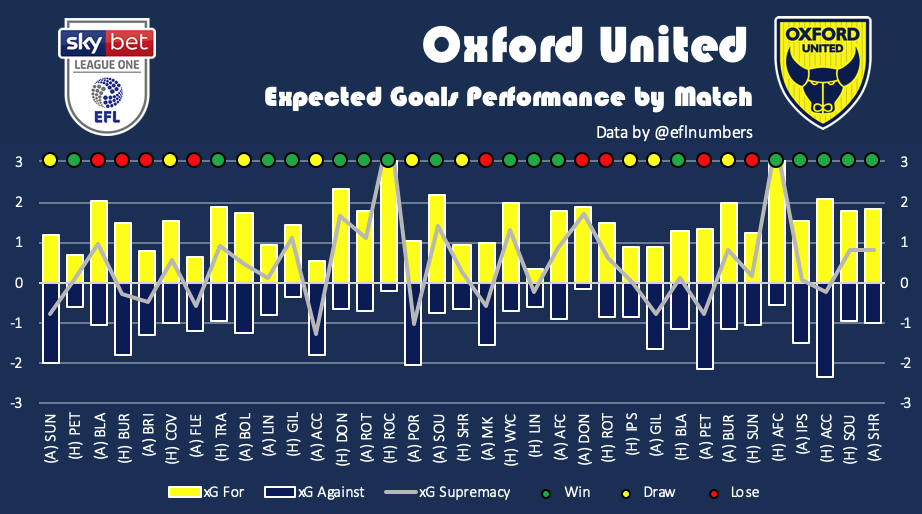
Oxford United were in third but dropped a place, leapfrogged by Wycombe Wanderers, due to an inferior points per game total. Oxford were the second highest scorers (61) in the division, behind only Peterborough, and although the expected goals data indicates they scored more than expected they still rank strongly. The xG model indicates they have joint best defence in the league and the Yellows are rated as the 3rd strongest overall.
For a second season in a row Oxford United started slowly but often ran hot. Oxford’s best performances both came at the Kassam Stadium against Rochdale (won 3-0) and AFC Wimbledon (won 5-0). In contrast, they were never dominated.
The season concluded with a five match winning run with the season perfectly captured in the last game away to Shrewsbury Town. At 2-0 down and then against 10 men, Oxford fought back with Josh Ruffels scoring another late minute winner. No goal there and Oxford’s season would already be over.
The initial August – September will be remembered as particularly poor but it was also the results across December – January, a W-D-L record of 3-3-3 which put pay to any automatic hopes. The expected goals data has Oxford United as strong throughout and with the form at the end of the season they would have been fancying their chances to catch either Coventry City or Rotherham United ahead of them.
Karl Robinson started the season in a 4-2-3-1 shape but due to the poor start that was binned in October in favour of a 4-3-3 shape with Alex Rodriguez the sole sitter allowing Cameron Brannagan to push further forward. The change in results was stark with the average goals conceded per match halved whilst still maintaining the attacking threat. This is backed up by the expected goals data. Interesting to note the trip to Fratton Park earlier in the season was the only match Robinson started in a 4-4-2 with Taylor and Mackie leading the line, elsewhere it’s tended to be either or.
Portsmouth
#
Team
G
W
D
L
GF
GA
GD
Pts
Pts
xGF
xGA
xGD
xPts
xPts
xG#
5
Portsmouth
35
17
9
9
53
36
17
60
1.71
60
39
20
58
1.67
1
Portsmouth shared an identical W-D-L record with Oxford United and could only be separated by goal difference. Pompey finished with a +17 GD but the expected goals data indicates it should have been more (+20 xGD) due to an underperformance in the goals scored column. They finished 5th in the table but I have them as the strongest team in the league.
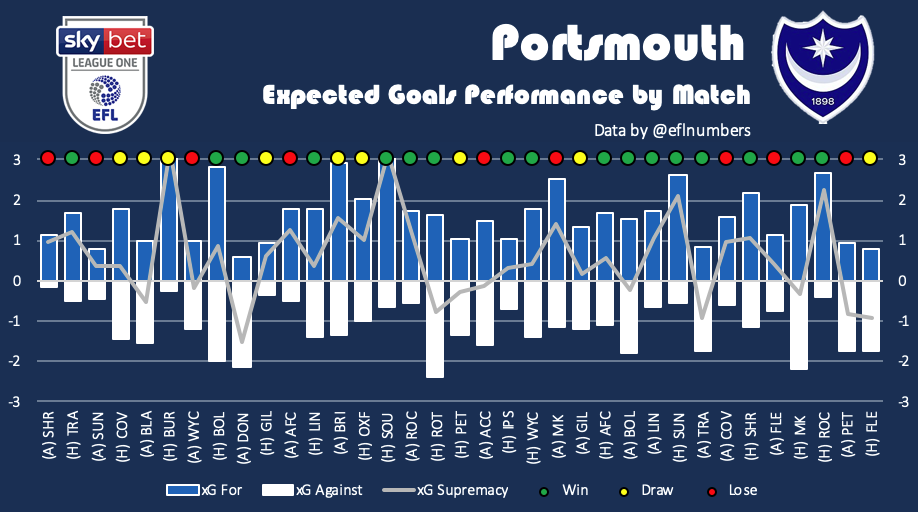
Another side with a poor start and due to having games in hand they found themselves as low as 20th by mid September with some calling for Kenny Jackett to be sacked. The start included their best performance of the season, as measured by expected goals, when drawing 1-1 at home to Burton Albion (3.5 – 0.3 xG). There were a number of other notable home performances in games against Southend (won 4-1), Sunderland (won 2-0) and Rochdale (won 3-0). The worst performance came away to Doncaster Rovers but they still managed to pick up all three points thanks to an Ellis Harrison stoppage time winner.
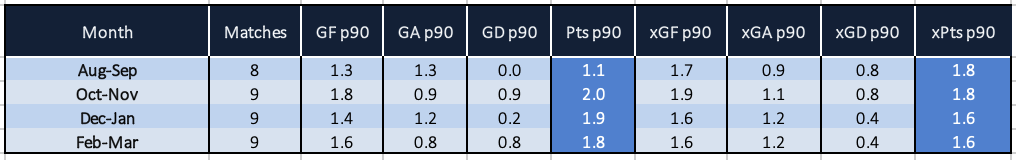
The poor start cost Pompey in the end with the expected goals data suggesting they were unfortunate to pick up so few points. Thereafter they were consistently picking up a high number of points and had the post October form started in August then they would have achieved an automatic finish. The expected goals shows how the results were no fluke as the consistently performed well.
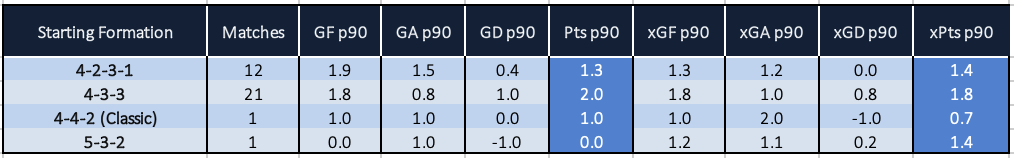
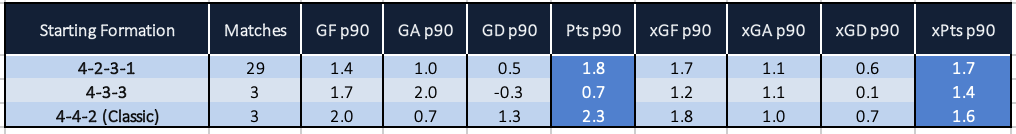
Kenny Jackett has used the fewest starting formations of the four playoff managers. The 4-2-3-1 is the most used, and was used at Fratton Park against Oxford United earlier in the season. A 4-4-2 shape has been used only three times this season but has a W-D-L record of 2-1-0 with strong expected goals data. The last 20 games of the season started with a 4-2-3-1 so the next one is unlikely to differ.
Fleetwood Town
#
Team
G
W
D
L
GF
GA
GD
Pts
Pts
xGF
xGA
xGD
xPts
xPts
xG#
6
Fleetwood Town
35
16
12
7
51
38
13
60
1.71
49
39
10
53
1.52
8
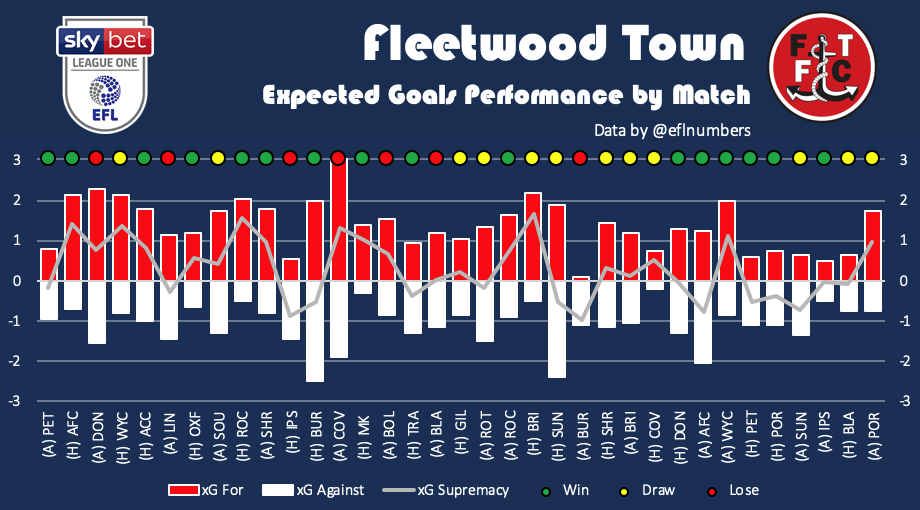
Fleetwood make up the play-off hopefuls, also finishing on 60 points. Impressively they were only beaten on 7 occasions in the league with champions Coventry City the other team with fewer. In all the performed similar to the expected goals data which ultimately has them scoring two fewer and conceding one more. This was good enough for 8th in the expected goals table but they’ll be more than happy with a 6th place finish.
A mixed bag of results with my eye drawn to the run towards the end of the season with just one defeat in 18 but dig a little deeper and that highlights the problem. Fleetwood Town were in the playoffs for the majority of the early part of the season but the sheer number of draws around the turn of the year ultimately meant they were losing ground on their rivals. It wasn’t until the run of 5 successive wins in February that they regained a playoff spot.
The season was bookended in terms of points per game with a strong start and an even stronger finish. The first spell down to a formidable attack, the second by a stubborn defence. The February – March spell featuring a 6-3-0 W-D-L record with just 6 goals conceded. Interestingly the expected goals data shows a different trend with expected goals decreasing as the season went with attacking threat diminishing as the season went on.
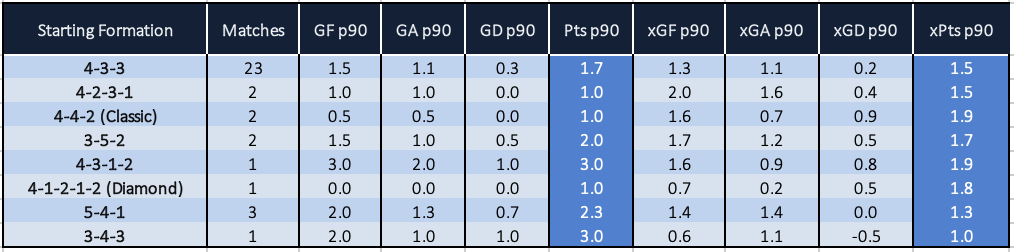
Joey Barton appears to have a tried and trusted but also has many tried and not necessarily trusted formations, playing the most formation of all four managers. The 4-3-3 is the most popular but was not seen in either match against Wycombe Wanderers this season. August’s home match started with a 4-2-3-1 formation whilst the February return was a 3-5-2. Which formation he starts is anyones guess here.
Oxford United (4th) v Portsmouth (5th)
The play-offs kick off on Friday evening with Portsmouth hosting Oxford United at Fratton Park before the return leg at the Kassam Stadium three days later.
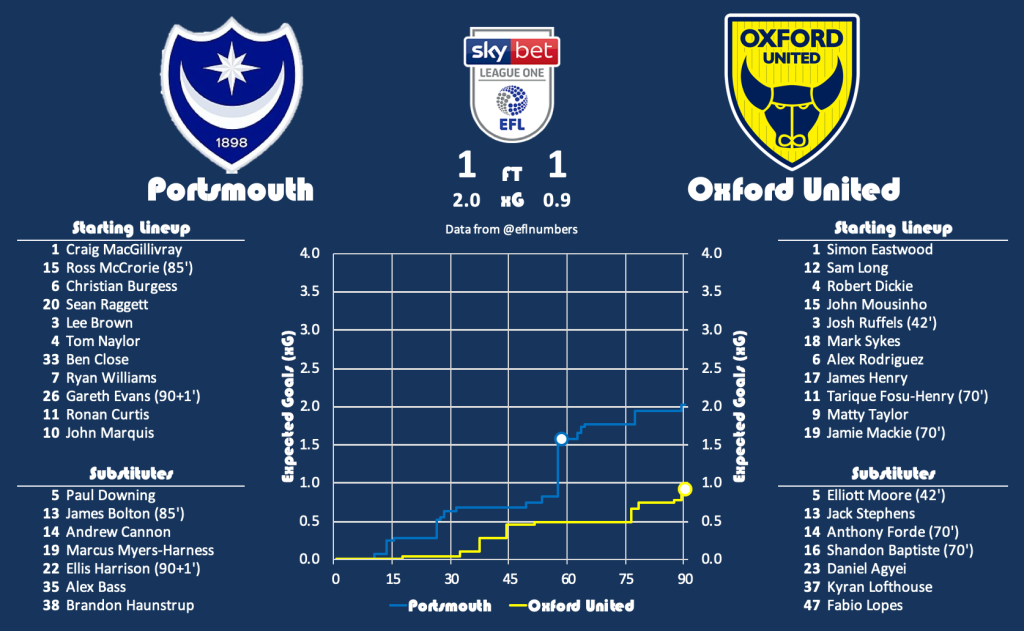
The teams have only faced each other once in the league this season with the scheduled return in March cancelled. Portsmouth played host on the 2nd November 2019 in a 1-1 score draw. The teams were evenly matched in the first half before Gareth Evans penalty put Pompey ahead on the hour mark. Noted previously this was the only time Karl Robinson started Oxford United in a 4-4-2 shape and the goal prompted the change with Mackie replaced with the visitors shuffling into a 4-3-3/4-2-3-1 shape. In the end Matty Taylor’s injury time equaliser secured Oxford United a point but Portsmouth will be rueing not being able to see the game out and secure all three points.
Finishing 1st (Portsmouth) and 3rd (Oxford United) in my expected goals table implies these two teams should not be facing each other in a play-off semi. This will be a close match up and is considerably stronger in teams of strength than the other semi. To calculate the expected match probabilities I use a rolling 46 game season of data which ordinarily would be a complete season but in this instance uses a handful of games from the season before.
A poisson distribution estimates the following probabilities for the number of combined goals scored across the ties.
0
1
2
3
4
5
6
Oxford United
6%
17%
24%
22%
15%
8%
4%
Portsmouth
5%
14%
22%
22%
17%
11%
5%
My model has Portsmouth as the favourites to make the final, pretty much identical to the bookmakers odds, and therefore no value play.
Modelled Probability
Bookmakers Odds
Bookmakers Probability
Difference
Oxford United
44.5%
6/5
45.5%
-0.9%
Portsmouth
55.5%
8/11
57.9%
-2.4%
Wycombe Wanderers (3rd) v Fleetwood Town (6th)
Friday’s action concludes with Wycombe Wanderers travelling to Highbury to face Fleetwood Town with the reverse tie also three days later at Adams Park.
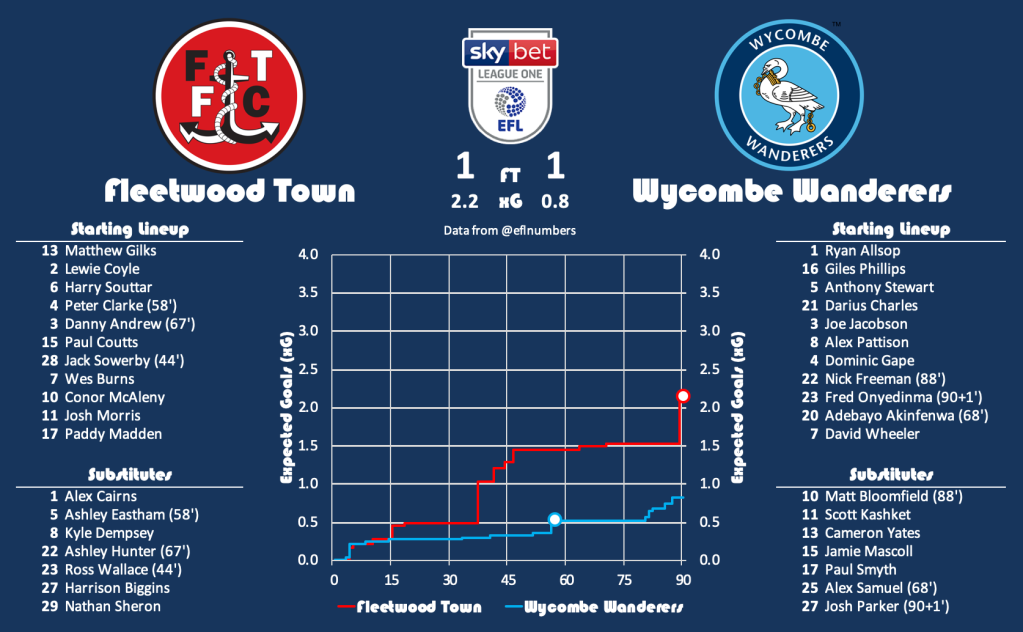
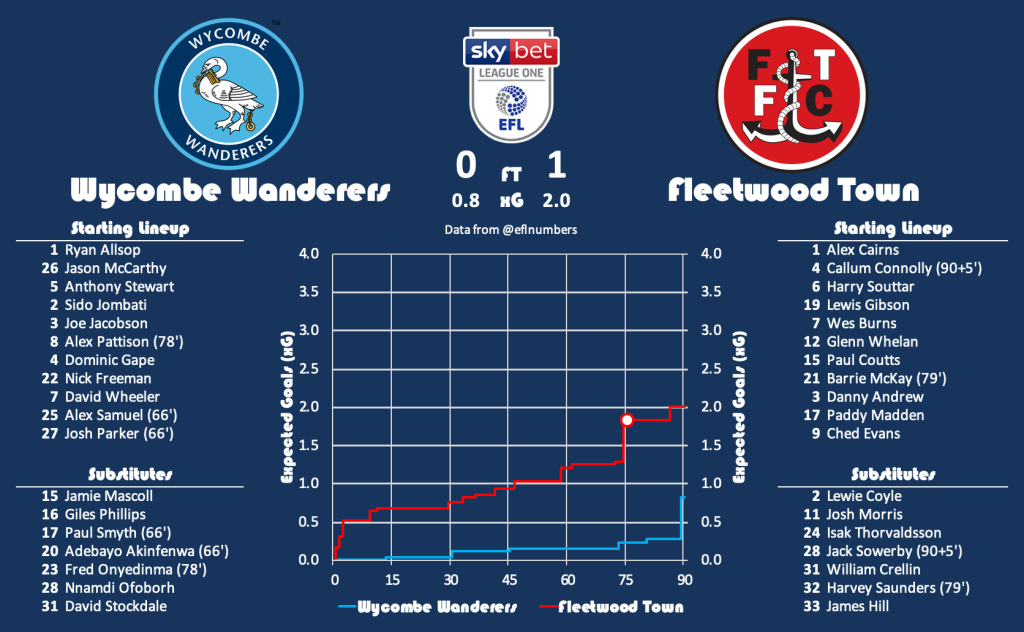
There’s been two heads to heads this season with the first happening on the 20th August 2019 with the teams playing out a 1-1 draw. Peter Clarke missed a good chance just after the half an hour mark with a number of half chances just before the break. Adebayo Akinfenwa put the visitors ahead early in the second half with the home response disappointingly non existent. Paddy Madden rescued a point at the death and is ultimately deserved on the balance of the play.
Wycombe Wanderers hosted the return on 11th February 2020 with Fleetwood taking all three points in a 1-0 victory. Paddy Madden the goalscorer again this time. It’s striking how similar the two expected goals results are and that will give Joey Barton great confidence going into the game. Gareth Ainsworth will need to have a plan up his sleeve and it is a worry they conceded 4.2 xG across the two games.
14th plays 8th in my expected goals and with neither apparently good enough for a play-off spot in my data. The winner of this tie will definitely be the underdog come Wembley. As per the other play-off I will calculate the expected match probabilities using a rolling 46 game season of data which ordinarily would be a complete season but in this instance uses a handful of games from the season before.
A poisson distribution estimates the following probabilities for the number of combined goals scored across the ties.
0
1
2
3
4
5
6
Wycombe Wanderers
9%
21%
26%
21%
13%
6%
3%
Fleetwood Town
5%
15%
22%
22%
17%
10%
5%
My model has Fleetwood Town as the most likely to make it to Wembley and is again near identical to the bookmakers odds with no betting selection suggested.
Modelled Probability
Bookmakers Odds
Bookmakers Probability
Difference
Wycombe Wanderers
39.1%
11/8
42.1%
-3.0%
Fleetwood Town
60.9%
8/13
61.9%
-1.0%
Outright
Given how the expected goals data rates the four teams the winner of the Oxford United – Portsmouth match should win the final and would be anticipated to do so.
The model thinks Portsmouth are the right favourites with a 33% chance matching the probabilities suggested by the bookmakers odds. Fleetwood Town are second favourites only due to facing the easiest opponents. Due to the proximity of my modelled probabilities and the bookmakers odds there is currently no value in placing in a bet and therefore no selection is made.
Following last week’s post detailing how I have created a betting a model using expected goals data, link below, I will be putting that into practice in an attempt to predict the outcome of the League Two play-offs.
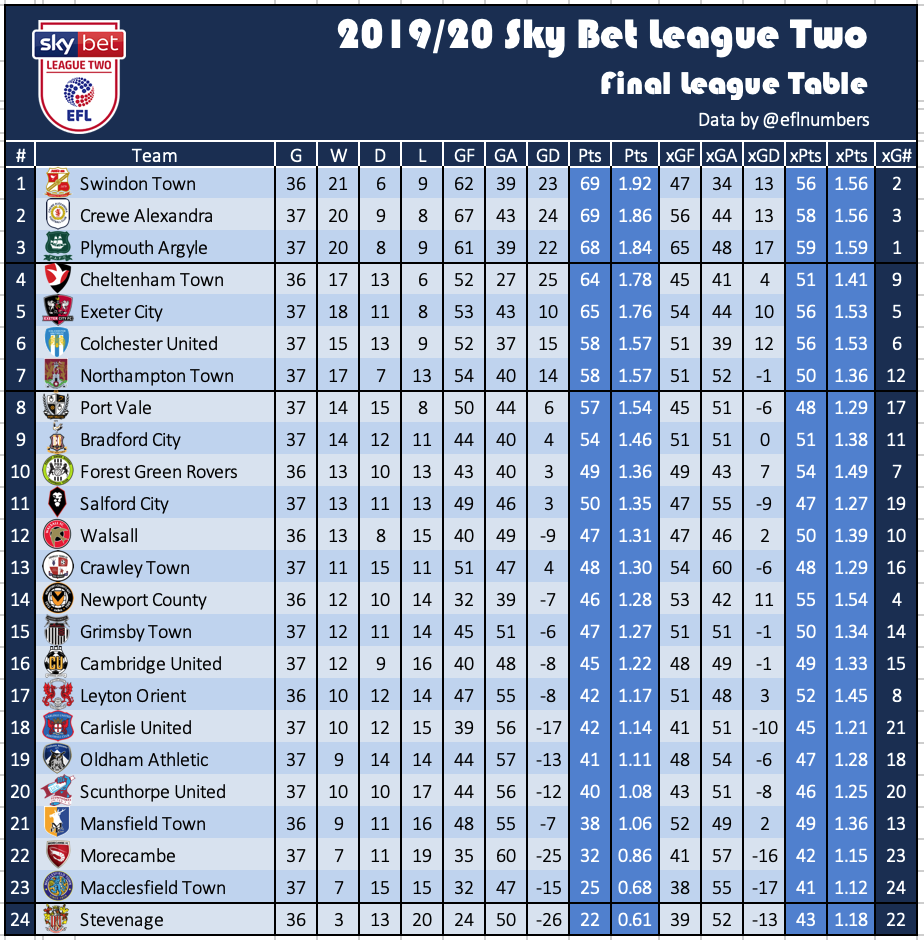
The season ended prematurely with Swindon Town, Crewe Alexandra and Plymouth Argyle filling the automatic spaces and a spot in League One next season. This leaves the next four placed teams, Cheltenham Town, Exeter City, Colchester United and Northampton Town to battle it out for the remaining promotion place via the dreaded play-offs where only one will be ultimately be successful.
Cheltenham Town
#
Team
G
W
D
L
GF
GA
GD
Pts
Pts
xGF
xGA
xGD
xPts
xPts
xG#
4
Cheltenham Town
36
17
13
6
52
27
25
64
1.78
45
41
4
51
1.41
9
Cheltenham Town grabbed 4th courtesy of their superior points per game finishing just ahead of Exeter City who achieved one point more from one fewer match. They may have ended up with 64 points and a +25 goal difference but my expected goals data suggests they over achieved this season. The model calculates an expected goal difference of just +4 with an over performance at both ends of the pitch scoring 7 more and conceding a whopping 16 fewer than expected. This ranks the Robins as the 9th best team this season.
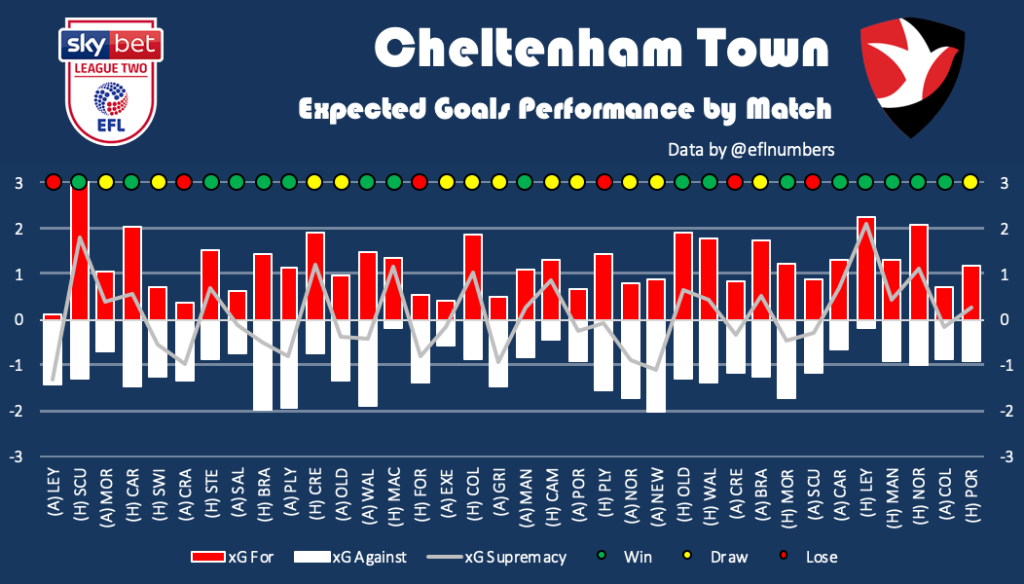
Cheltenham’s form was generally strong throughout and they didn’t experience back-to-back defeats at any point. In fact they finished with the fewest defeats (6) of all 24 teams. The two stand out performances, as rated by expected goals, came at the Jonny-Rocks Stadium (Whaddon Road) in home games against Scunthorpe United (won 4-1) and Leyton Orient (won 2-1). The worst performance came in the very first game of the season, away to the aforementioned Leyton Orient (lost 1-0), where they created next to nothing.
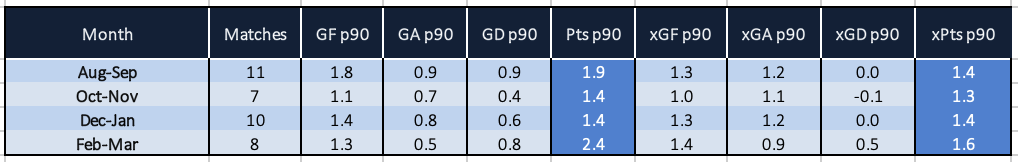
Whilst form was strong throughout it’s noticeable how the bookends of the season achieved the greatest points hauls. The 11 games in the August – September returned 21 points and 3rd place before a slight slump in the winter months saw the Robins drop into the play-off places and just outside for a temporary period. A strong finish with a 6-1-1 W-D-L record from February onwards would have given the fans dreams of the automatic spots before the premature end.
Michael Duff has almost religiously played a 3-5-2 this season and it would be a surprise for this not to continue into the play-offs. Three other formations have been used, and the Robins have never been beaten in those matches but expected goals data would suggest it’s best to stick to the known.
Exeter City
#
Team
G
W
D
L
GF
GA
GD
Pts
Pts
xGF
xGA
xGD
xPts
xPts
xG#
5
Exeter City
37
18
11
8
53
43
10
65
1.76
54
44
10
56
1.53
5
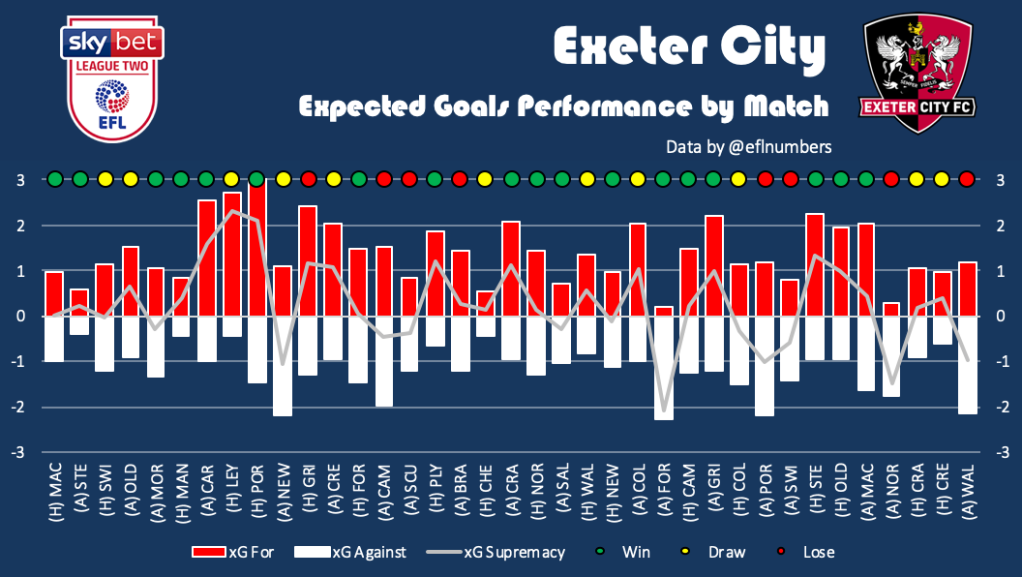
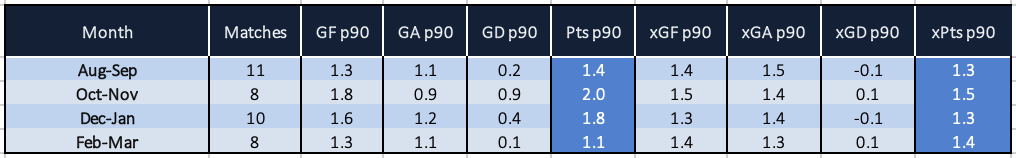
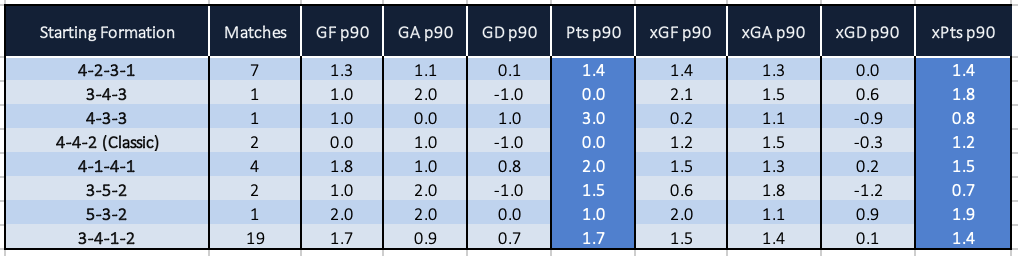
Exeter City finished with the 4th highest points haul but were ultimately relegated a place due to points per game. In this case my expected goals data suggests they finished exactly where they should have. A goal difference of +10 perfectly matches the expected goals estimated, good enough for a 5th place ranking for the Grecians.
Exeter never won more than 3 games in a row but there was a steady stream of them which saw them finish with the most victories of the play-off quartet (18). There was a great three game performances, as measured by expected goals, early in the season in matches away to Carlisle (won 3-1), home to Leyton Orient (drew 2-2) and home to Port Vale (won 2-0). The worst performance, away to Forest Green, still resulted in a victory.
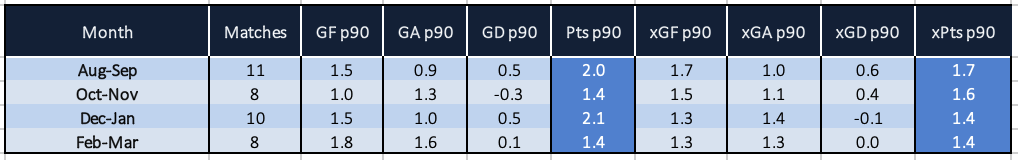
Highlighted above Exeter started the season strongly with 22 points in the opening 11 games and a long stint on top of the league before ending September in second place. 3 defeats across the next 8 games dropped the Grecians to 4th before a strong Christmas period and a W-D-L record of 6-3-1 returned them to 2nd and the automatic spot. The run didn’t continue and they must be ruing how the season ended with no win in four confirming it would be a play-off spot at best.
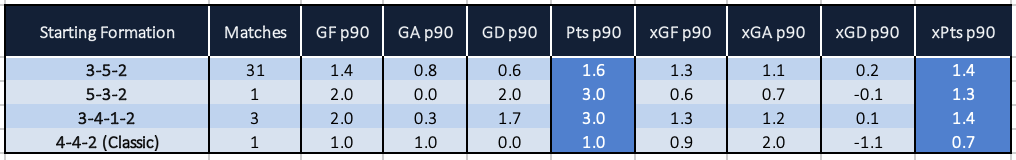
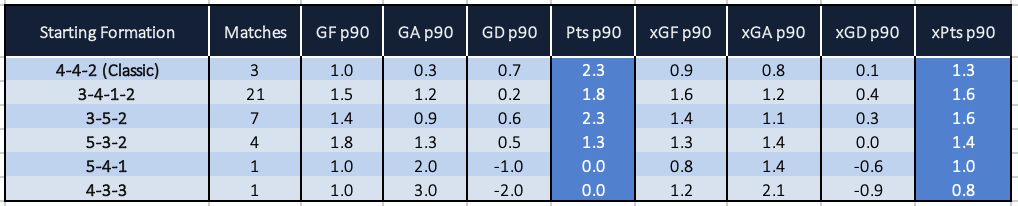
Matt Taylor started the first three games in a 4-4-2 formation and although this returned 7 points, the expected goals data didn’t point to the same domination and therefore it was not a surprise to see the team switch shape. A 3-4-1-2 was successfully used thereafter but was tinkered in favour of a 3-5-2/5-3-2 shape later on in the campaign. The expected goals data highlights the 3-4-1-2 to be the best option of the trio.
Colchester United
#
Team
G
W
D
L
GF
GA
GD
Pts
Pts
xGF
xGA
xGD
xPts
xPts
xG#
6
Colchester United
37
15
13
9
52
37
15
58
1.57
51
39
12
56
1.53
6
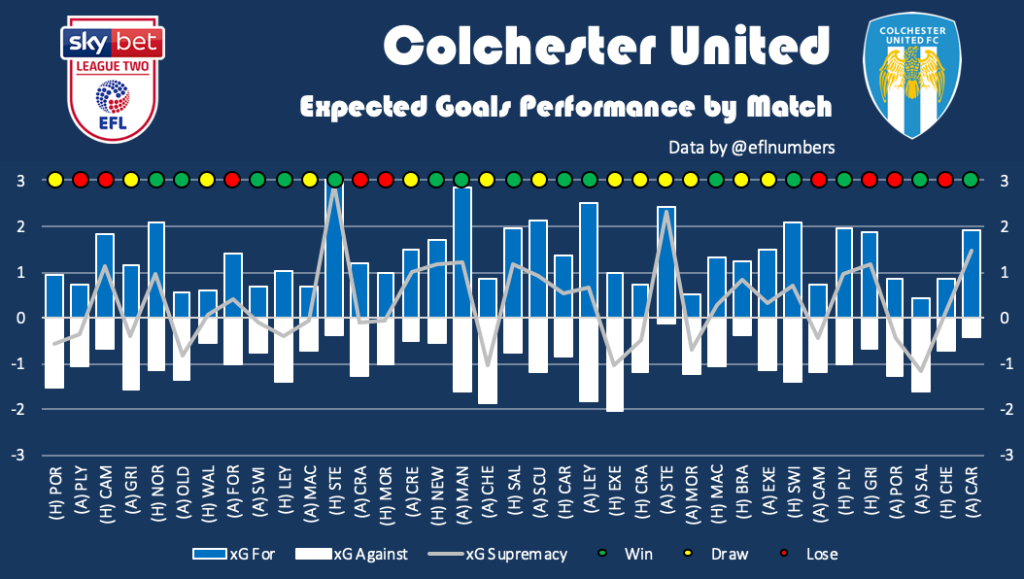
Seven points adrift of the first pair was Colchester United who finished in 6th, ahead of Northampton Town courtesy of a superior goal difference. Akin to Exeter City, the expected goals performance (+12 xGD) closely aligns with the actual goals performance (+15 GD). Ultimately this was enough to be ranked as the 6th best team in the league.
Colchester United started the season with 2 points from their first 4 games and must have been thinking it was almost season over but for a 16 game unbeaten run, the longest of the play-off four, later in the campaign. Their was a clear winner for performance of the season, as calculated by expected goals, coming in the 3-1 home win against Stevenage. There weren’t many bad days though.
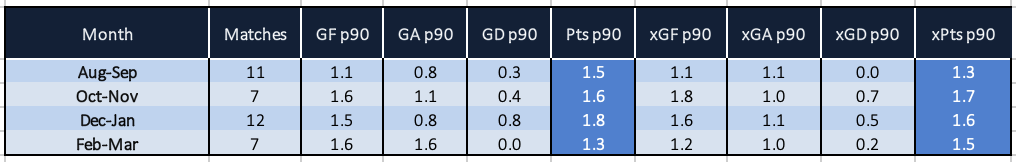
The poor start saw Colchester drop as low as 21st but they managed to end September in 9th. A constant supply of points across the middle part of the season saw a peak of 4th on Boxing Day. The U’s were 5th by end of January but will be disappointed by the end of the campaign finishing with a W-D-L record of 3-0-4 in the last 7 games.
Jon McGreal has typically used a 4-2-3-1 throughout the whole season, and has only started matches in three different shapes, the fewest of the play-off teams. It’s interesting that a 4-4-2 has only been used 5 times but has picked up 10 points in those matches. This has reduced the number of goals scored but has made them a much solid proposition defensively backed up by the expected goals data.
Northampton Town
#
Team
G
W
D
L
GF
GA
GD
Pts
Pts
xGF
xGA
xGD
xPts
xPts
xG#
7
Northampton Town
37
17
7
13
54
40
14
58
1.57
51
52
-1
50
1.36
12
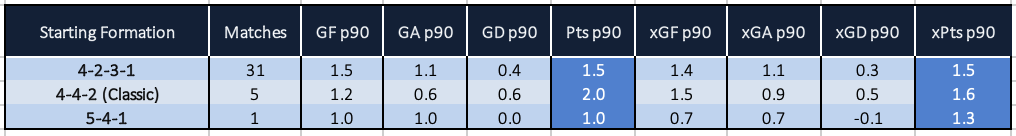
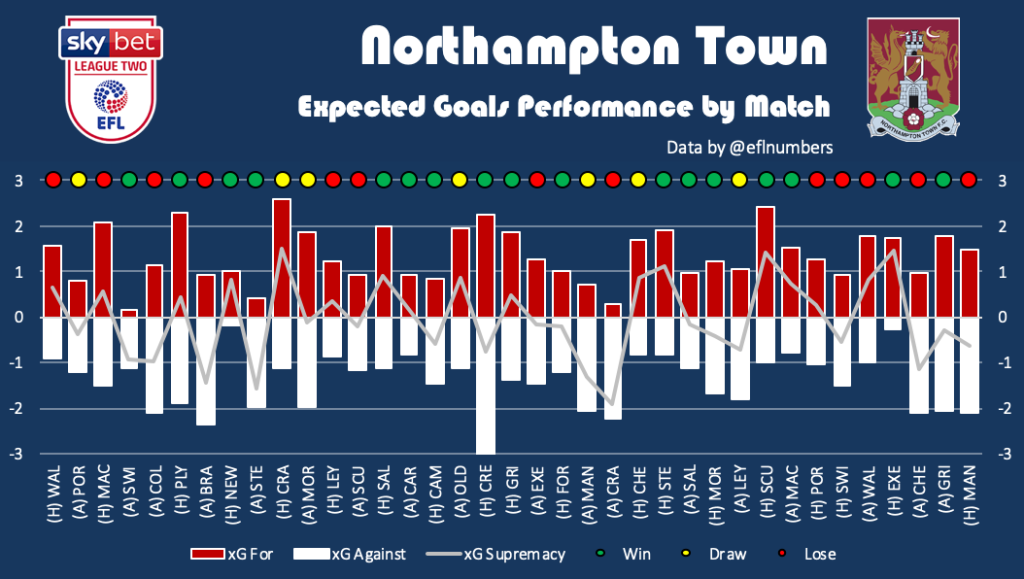
A 7th place finish and the remaining play-off spot went to Northampton Town. The Cobblers finished with a +14 GD but this is considered to be a large over performance based on the expected goals data, which estimated a -1 xGD across the season. This was largely due to the team conceding 12 goals fewer than suggested. The model ranks Northampton Town as the 12th best team in the league and therefore the weakest of the play-off quartet.
Northampton were another who started slow with 1 point from the first 3 matches. The Cobblers were beaten 13 times in all, the most of the play-off teams, which meant they ultimately didn’t draw very often to achieve the 7th place. There will be encouragement in the fact that one of their best performance, as measured by expected goals, was against a fellow promotion rival in the 2-0 victory against Exeter City. There was also the odd stinker though, notably the 4-0 drubbing at Crawley Town.
Northampton have had the trickiest journey in securing their play-off spot, by September they were still in the bottom half in 13th. Two defeats at the start of October saw them drop further to 18th before a very impressive 10-4-2 W-D-L record until the end of January rose them to 6th spot and into the play-offs. In the end it was another case of a disappointing February – March period, the poorest of the play-off hopefuls, where they just about managed to hold onto 7th.
Keith Curle started the season with a 4-2-3-1 but a poor start ultimately led to a reshuffle with Northampton using the most formations (8) of the four play-off teams. It’s interesting the most popular formation and the one used at the end of the season, a 3-4-1-2, was not used until mid November. They conceded few than one goal a game whilst using this set up but the expected goals data implies they were fortunate not to concede more.
Exeter City (5th) v Colchester United (6th)
The play-offs kick off on Thursday evening with Colchester United hosting Exeter City at the JobServe Community Stadium before the return leg at St James Park four days later.
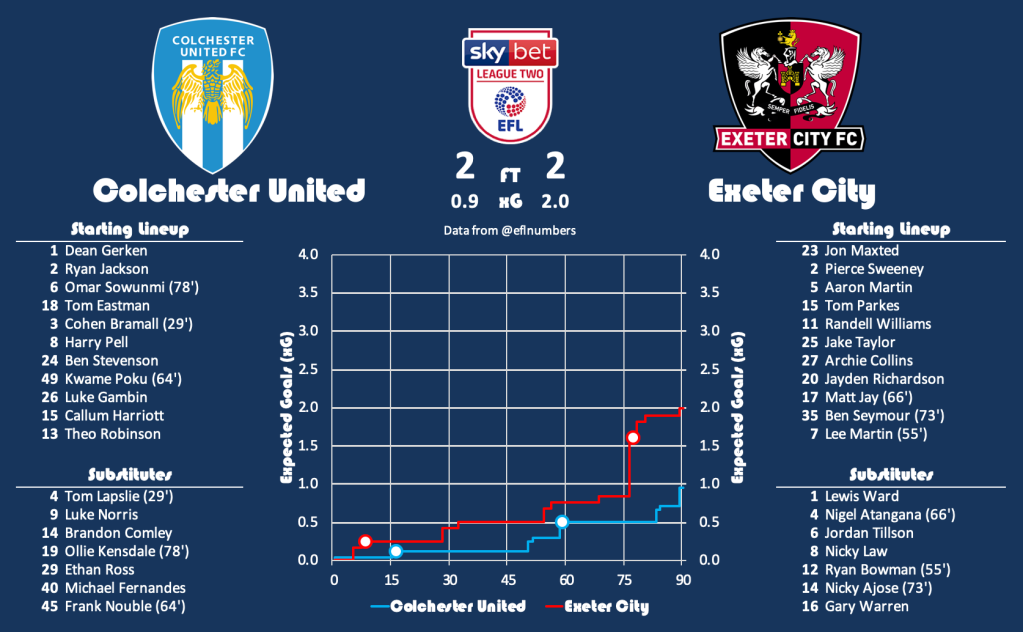
The teams have faced each other twice in the shortened season. Firstly on the 29th December 2019 in an open 2-2 draw with Ryan Bowman’s penalty late into the second half earning the visitors a point. Exeter had the better of the chances and arguably should have taken all three points though Colchester were content to sit back at 2-1 up.
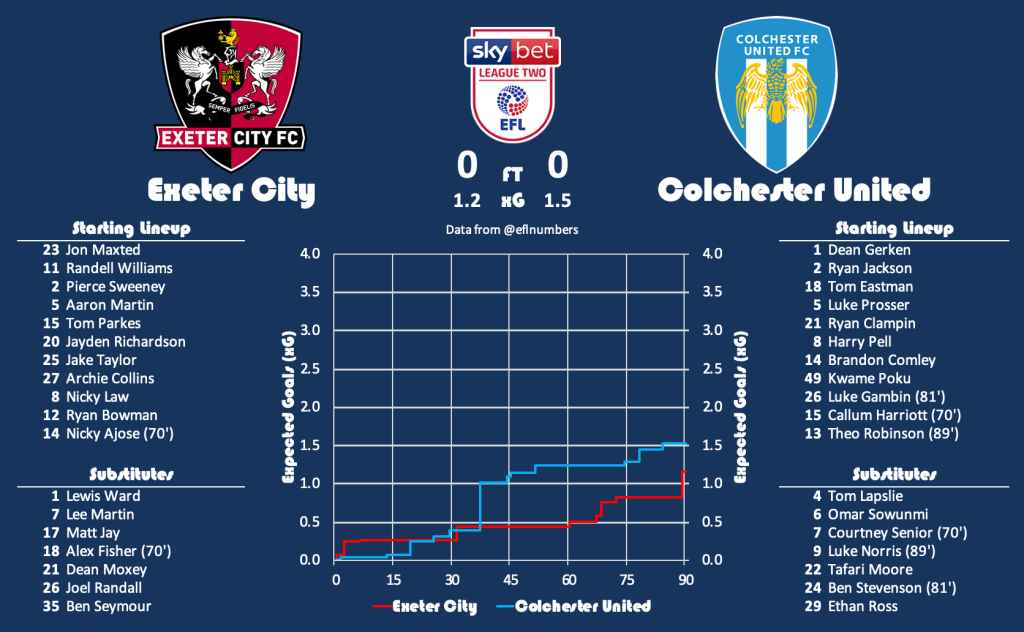
The reverse fixture on the 25th January 2020 also ended in a draw. Second time round the game was a little tighter with the teams cancelling each other for a deserved stalemate with the best chance falling to Colchester’s Callum Harriott shortly before half time.
Finishing 5th and 6th in both the actual table and my expected goals table, as well as two tight games this season indicates this is a close match-up. To calculate the expected match probabilities I use a rolling 46 game season of data which ordinarily would be a complete season but in this instance uses a handful of games from the season before.
A poisson distribution estimates the following probabilities for the number of combined goals scored across the ties.
0
1
2
3
4
5
6
Exeter City
10%
22%
26%
21%
12%
6%
2%
Colchester United
7%
19%
25%
22%
14%
7%
3%
My model has Colchester United as favourites to qualify for Wembley, a reversal of the bookmakers odds, and is the suggested selection for this match up.
Modelled Probability
Bookmakers Odds
Bookmakers Probability
Difference
Exeter City
44.7%
5/6
54.5%
-9.8%
Colchester United
55.3%
11/10
47.6%
7.7%
Cheltenham Town v Northampton Town
Thursday’s action concludes with Cheltenham Town travelling to Sixfields to face Northampton Town with the reverse tie also four days later at Whaddon Road.
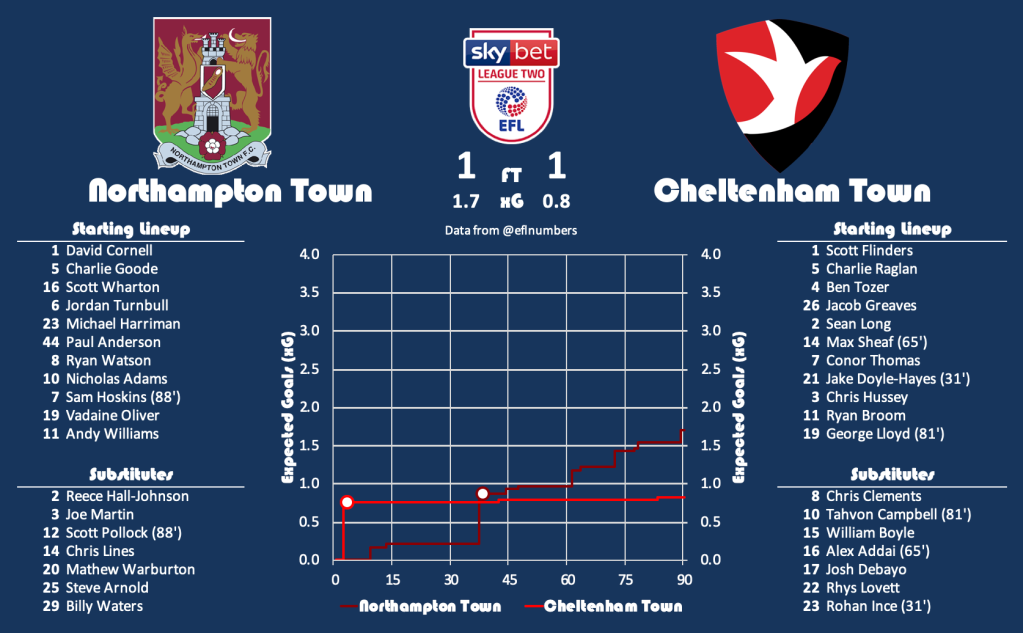
There’s been two heads to heads this season with the first also happening on the 29th December 2019 with the teams playing out an interesting 1-1 draw. Conor Thomas scored early for Cheltenham and they effectively shut up shop thereafter, likely to be the same tactic on Thursday should history repeat itself. Jordan Turnbull equalised just before half time and the hosts continued to push into the second half but didn’t manage to find a way to score a second.
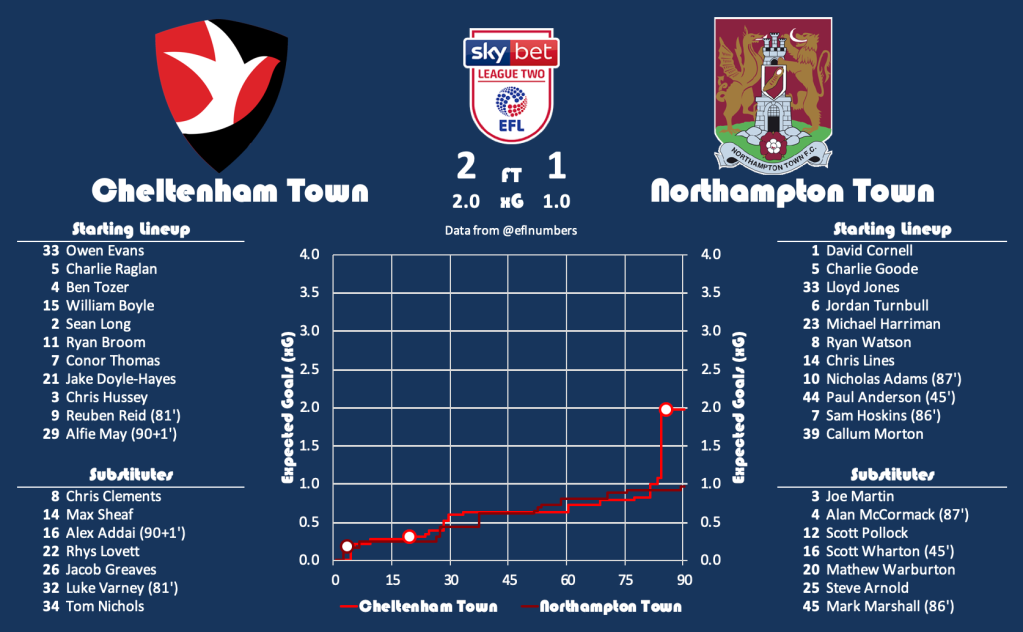
Cheltenham Town hosted the return on 25th February 2020 securing a 2-1 win identical to the estimated expected goals data. It was again the visitors who scored early but this time the home team levelled a lot earlier. Both teams had minor chances until Luke Varney’s close range goal won all three points.
This looks the weaker match according to the expected goals with neither performing well enough for a play-off spot in my table. Cheltenham took 4 points from the head-to-heads this season but the match data implies there was very little between the teams with both deserving to win the home ties. As per the other play-off I will calculate the expected match probabilities using a rolling 46 game season of data which ordinarily would be a complete season but in this instance uses a handful of games from the season before.
A poisson distribution estimates the following probabilities for the number of combined goals scored across the ties.
0
1
2
3
4
5
6
Cheltenham Town
6%
18%
24%
22%
15%
8%
4%
Northampton Town
7%
19%
25%
22%
14%
7%
3%
My model has Cheltenham Town as slight favourites to qualify for Wembley, mirroring the bookmakers odds, but no value for a betting selection.
Modelled Probability
Bookmakers Odds
Bookmakers Probability
Difference
Cheltenham Town
52.4%
5/6
54.5%
-2.1%
Northampton Town
47.6%
21/20
47.6%
0.0%
Outright
Given how the expected goals data rates the four teams it is no surprise that it thinks the winner of the Exeter v Colchester United game would be a 60-65% favourite to win promotion against the other two teams.
The model thinks Colchester United are most likely to go up and are estimated to have a 1 in 3 chance to do so. The bookmakers are a little more pessimistic at 3/1 (or a one in 4 chance) and therefore these are the suggested value play.
This post was only ever intended to be a brief summary but has ultimately turned into a story of my journey with the betting model interwoven. It’s ended up at over 6,000 words and is an open article of my inspirations, data sources and formulas used. The purpose is to cover everything needed for a like-minded individual to start on their own journey, so here goes…
Introduction to me
With the lockdown resulting in a temporary shutout of many sports, it has provided me with an opportunity for reflection, development and knowledge sharing – the aim of this blog post.
Search Twitter nowadays and there are an abundance of football analysts, some successfully making a living out of it and some who do it for the love it. I lack a scouting or coaching background and have a perception that the industry is difficult to crack so a year or two ago I started on a different path to see if I could use expected goals data to create a betting model.
First and foremost I’m a sports fan. I’ve always been interested in numbers and as I have become older this has naturally progressed into a fascination of data. With an abundance of resources available nowadays I’ve spent many hours manually collating and creating spreadsheets looking for interesting trends and patterns generally to help make predictions, sometimes with a financial investment attached.
I like to think I have a rough grasp of odds offered by bookmakers, be it a good price or a bad price. I’ve never been one to do an accumulator with several odds-on favourites at home, inevitably it would be let down by at least one and didn’t feel like great value, but I had no way of telling.
Moneyball and Mayhew
For a sports fan who loves data, the 2011 film Moneyball about the world of Baseball and advanced analytics would have seemed like a natural fit but I’ll be honest and say I don’t think it even registered on my radar. It wasn’t until 2017 that I can remember first watching the film with one particular scene lodging firming in my memory.
For those who haven’t seen the film, the scene revolves around the Oakland Athletics general manager Billy Beane played by Brad Pitt. The problem facing them summarised in one simple quote:
“There are rich teams, and there are poor teams. Then there’s 50 feet of crap. And then there’s us”
Billy Beane
With a limited budget available, Beane brings in assistant general manager Paul DePodesta to help build a roster of players using new sophisticated analytical metrics to identify undervalued talent often against the advice of the experienced traditional scout. If you haven’t watched and you think you may be like minded then watch the film, it’s highly recommended and is the inspiration for my journey.
I hadn’t the first idea about Baseball but assumed that something must be transferable to football. This was when I stumbled across a book by James Tippett called The Football Code: The Science of Predicting the Beautiful Game. It was a great introduction to a new concept to me, expected goals, and the use in the real world at SmartOdds and Brentford through owner Matthew Benham.
For those not familiar with expected goals (or xG for short) it is a metric to monitor the quality of a goalscoring chance. A value between 0 and 1 is assigned based on the probability the chance will result in a goal. A 1 in 20 long range shot will have a probability of 5% (an xG of 0.05) whereas a penalty roughly has a 3 in 4 expectancy and therefore an xG of 0.75.
Inspired by the idea of a new advanced metric I searched and read any related article I could find. It was at this point my searches led me to Ben Mayhew, who through his Twitter profile @experimental361, was creating data visualisations using expected goals data.
His website, www.experimential361.com, is full of great content and my interest was piqued further with the match xG timelines. Using a couple of recent examples from matches just before the lockdown in March shows how useful they are to provide a quick snapshot of how a match unfolded.
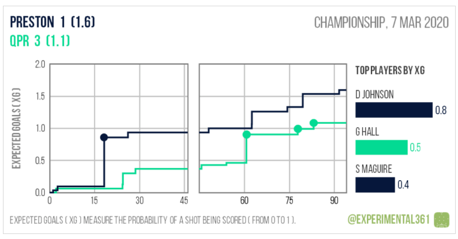
Firstly, a match between Preston North End and Queens Park Rangers could be summarised as: Preston scoring with their first real good chance with little happening in the subsequent 40 minutes. QPR equalised with their best chance of the match but were somewhat fortunate to win the game from thereafter with Preston creating the better chances.
QPR scored 3 goals but were expected to score 1.1 whereas Preston scored 1 goal but were expected to score 1.6. These are the type of games where a 1-1 draw or 2-1 home win would have felt a fairer representation to me based on the chances but also how the game panned out.
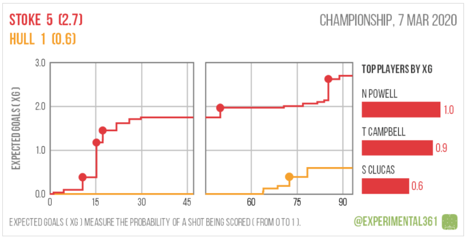
The match between Stoke City and Hull City is more straightforward in that Stoke were totally dominant from the start but are arguably flattered by the scoreline with the hosts scoring 5 goals but were expected to score 2.7.
Intrigued to find out more and keen to have a play around with some new data I wondered if it was possible to create expected goals myself and so I reached out to Ben to support.
Finding Data
I can’t remember whether I was expecting to receive a reply from Ben, and although he understandably didn’t share all his secrets, it was enough information to point me in the right direction and provide motivation to dive right in.
I wasn’t looking to invest financially into any data so it was important that the data was free, consistent and easily accessible. Those who follow the live text commentary from BBC Sport or Sky Sports website will notice that they are typically uniform in nature. Perfect to extract the information required with the text tending to be in a set format.
Each line of text describes an event that has occurred in the match with a couple of examples below from my preferred source, the SportingLife website.
A goal is typically structured as:
A non-scoring attempt structured as:
By recognising the set structure of the various types of events this can be manipulated through use of formulas in Excel or any other preferred coding language into something more useful:
Minute
Event
Attempt Player
Team
Attempt Type
Shot Location
Shot Placement
Assist Player
Assist Type
19
Goal
Daniel Johnson
Preston North End
Left footed shot
Penalty
Bottom right corner
25
Attempt Missed
Jordan Hugill
Queens Park Rangers
Header
Centre of the Box
Misses to the left
Ryan Manning
Corner
This is obviously just two incidents within one match but collating this for numerous events across numerous leagues across numerous seasons quickly builds a database containing thousands of records.
Not keen to manually copy the information I gathered there must be a smarter way. A quick Google search identified a free software called R which could extract the data needed from the websites in bulk. For a beginner Stack Overflow was a great tool to help me pull the data I needed. The time invested was definitely worthwhile and has saved a lot of time in the long term.
The Expected Goals Model
If you are still reading at this point, thanks! The next section and lynchpin for the whole article is creating the expected goals model. The first step is to have a large database of events, the more the better ideally. As shown in the table previously you can extract numerous data items such as the attempt type, shot location, shot placement and assist type. For my model I use just two pieces of information:
– Attempt Type – namely was the attempt a shot or a header
– Shot Location – where on the pitch was the attempt taken from
Now it’s important at this stage to highlight that the quality of an expected goals model is dependent on the quality of the data used. My model is at the simpler end as it’s using free basic descriptive data. Every other model will use different input data in a different way to calculate an expected goals value for an attempt. This is why values from different providers have different values.
The data I use is suitable for my needs as it is free, easy attainable and allows myself to be in control of the calculation. For those looking to find data, FBref, WhoScored and Infogol are three data suppliers who have more detailed data than mine and are a good source for information.
Anyway back to the data I use. By linking the different attempt type and shot location provides various combinations detailing the attempt. For each of these you will be able to calculate the number of times that attempt combination occurred and how often it resulted in a goal. This is the basis of the expected goals formula:
xG value = The number of goals scored / The number of attempts taken
From my database of around 150,000 attempts and just under 17,000 goals I have the following percentages for each type of attempt and the corresponding expected goals value:
Attempt Type
Attempts
Goals
Goal %
xG Value
Penalty
2869
2158
75.2%
0.752
Shot from Very Close Range
3170
1738
54.8%
0.548
Header from Very Close Range
2536
885
34.9%
0.349
Shot from Side of 6 Yard Box
3098
684
22.1%
0.221
Shot from Centre of Box
29592
5149
17.4%
0.174
Free Kick
2712
395
14.6%
0.146
Header from Side of 6 Yard Box
2624
362
13.8%
0.138
Header from Centre of Box
18270
1566
8.6%
0.086
Shot from Difficult Angle
2576
208
8.1%
0.081
Shot from Side of Box
21876
1527
7.0%
0.070
Shot from Long Range
1930
96
5.0%
0.050
Shot from Outside of Box
54510
1948
3.6%
0.036
Header from Side of Box
1058
30
2.8%
0.028
Header from Outside of Box
79
2
2.5%
0.025
Header from Difficult Angle
282
3
1.1%
0.011
It’s at this point the realisation of how infrequent long range goals are scored may refrain a few from shouting “Shooooot” the next time a player has the ball around 25 yards out.
Once each event has been assigned an expected goals value then the possibilities are endless. You can calculate the expected goals for both teams in any given match, the expected goals a player should have scored over a season or the data I use for my betting model: the expected goals scored and conceded by each team over a rolling seasons period.
There’s no wrong way to measure team strength. I’ve chosen a seasons period as I feel it gives a truer reflection of a team’s ability. Shorter 6/10 game periods are useful context and reflect the latest information more quickly but can be biased due to the fixture strength experienced.
Expected Goals in the Real World
Enough of the theory, Here’s an example of the expected goals data I have calculated, in this instance the final table for the 2018-19 Championship table. An important finding to note is that the spread in expected goals scored (xGF) and expected goals conceded (xGA) is a lot narrower than the actual goals scored and conceded.
The ability of the teams within the league are closer than people think. In most cases the teams at the top are good but overperforming somewhat. Think of it as those teams who seem to win lots of games by a single goal when it probably should have been a draw.
Rank
Team
GF
GA
GD
Pts
xGF
xGA
xGD
xPts
xPts Rank
1
Norwich City
93
57
36
94
80
59
21
75
3
2
Sheffield United
78
41
37
89
76
46
30
80
2
3
Leeds United
73
50
23
83
81
43
38
83
1
4
West Bromwich Albion
87
62
25
80
75
64
11
68
6
5
Aston Villa
82
61
21
76
76
63
13
69
5
6
Derby County
69
54
15
74
59
65
-6
61
16
7
Middlesbrough
49
41
8
73
67
63
5
66
9
8
Bristol City
59
53
6
70
64
62
2
65
11
9
Nottingham Forest
61
54
7
66
61
68
-7
61
17
10
Swansea City
65
62
3
65
71
60
11
67
8
11
Brentford
73
59
14
64
66
54
13
69
4
12
Sheffield Wednesday
60
62
-2
64
58
66
-8
59
18
13
Hull City
66
68
-2
62
60
69
-9
57
20
14
Birmingham City
64
58
6
61
60
59
1
64
12
15
Preston North End
67
67
0
61
61
68
-6
58
19
16
Blackburn Rovers
64
69
-5
60
66
68
-2
62
13
17
Stoke City
45
52
-7
55
54
58
-3
62
15
18
Wigan Athletic
51
64
-13
52
69
70
-1
62
14
19
Queens Park Rangers
53
71
-18
51
66
62
3
66
10
20
Reading
49
66
-17
47
50
85
-35
45
23
21
Millwall
48
64
-16
44
69
60
9
67
7
22
Rotherham United
52
83
-31
40
64
79
-15
55
21
23
Bolton Wanderers
29
78
-49
32
44
70
-26
48
22
24
Ipswich Town
36
77
-41
31
45
82
-37
45
24
Summarising the table above can help identify the following based on the underlying expected goals numbers:
– Sheffield United were the strongest team promoted.
– Leeds United were unlucky not be promoted and were the strongest team remaining in the league.
– Derby County overachieved to reach the playoffs and appear to be of mid-team quality.
– Brentford, Swansea City and almost relegated Millwall were superior to their finishing positions and were of a playoff pushing quality.
– Hull City and Reading were the weakest two teams to remain in the league.
– Rotherham United were the strongest team to be relegated.
Fast forward to this season and it’s striking how many of those have come to realisation. From my experience I have found expected goals to be a much better indicator of future performance than actual goals. This is the main reason why I place some much value in the use of this particular metric.
Expected Points
For those interested in expected points, labelled as xPts in the table, this is an additional metric using expected goals. My method is to look at the difference in expected goals of the two teams for a particular match.
Using one of matches highlighted earlier of Preston North End 1 (1.6) – Queens Park Rangers 3 (1.1), provides a xG difference of +0.5 for Preston and -0.5 for QPR. The next step is to look at how often a team actually wins, draws or loses with this difference and multiplying this by the points earned for each outcome.
This is a simplistic approach as it just looks at the total xG not the number and quality of the individual chances which would impact the xPts. There are calculators available online to plug in the attempts to provide the probability but in absence of doing this in bulk I have devised this methodology.
For example if a team with +0.5 xG difference wins half of the matches, draws 30% of the time and loses the remainder this could be calculated as:
Expected points for a team with +0.5 xG difference
= (Team wins 50% of the time * 3 points for a win) + (Team draws 30% of the time * 1 point for a draw) + (Team loses 20% of the time * 0 points for a loss)
= (50% * 3) + (30% * 1) + (20% * 0)
= 1.8
Expected points for Preston North End would be 1.8.
On the contrary this would mean the team with a -0.5 xG difference would lose half of the matches, draw 30% of the time and win the remainder. This would be calculated as:
Expected points for a team with -0.5 xG difference
= (Team wins 20% of the time * 3 points for a win) + (Team draws 30% of the time * 1 point for a draw) + (Team loses 50% of the time * 0 points for a loss)
= (20% * 3) + (30% * 1) + (50% * 0)
= 0.9
Expected points for Queens Park Rangers would be 0.9.
The combined expected points won’t add up to 3 points as while a win distributes a total of 3 points, drawn games only distribute a total of 2 points.
Due to the nature of the calculations it is best to group together similar values to ensure each banding has significant volume and also helps create a smooth curve to ensure the xPts increases as the xG difference increases.
The table below shows the values I use and show Preston’s xPts to be 1.77 and QPR’s xPts to be 0.95 for the match in question.
xG Difference
xPts Value
>3.20
2.78
>2.70 to 3.20
2.62
>2.10 to 2.70
2.45
>1.50 to 2.10
2.28
>1.00 to 1.50
2.11
>0.75 to 1.00
1.94
>0.45 to 0.75
1.77
>0.30 to 0.45
1.60
>0.00 to 0.30
1.43
>-0.30 to 0.00
1.27
>-0.45 to -0.30
1.11
>-0.75 to -0.45
0.95
>-1.00 to -0.75
0.80
>-1.50 to -1.00
0.66
>-2.10 to -1.50
0.52
>-2.70 to -2.10
0.39
>-3.20 to -2.70
0.26
<= -3.20
0.15
Calculating Score Probabilities
Now the expected goals data are summarised for each team can be used to predict the outcome of a future match. This is done by calculating the average projected goals using a Poisson distribution. A Poisson distribution is used as the shape of the distribution closely follows the distribution of goals scored in football matches. For those looking for a little bit more detail then the article written below on the Pinnacle website is helpful.
To demonstrate the calculation for a match I will use my version of the 2018-19 Championship table shown earlier in the article to project the outcome of a fictional match between Preston North End and QPR assumed to be on the first day of the 2019-20 Championship season.
The first step is to calculate the average expected goals scored and expected goals conceded for the Championship. Across the whole season there were 1542 expected goals according to my model (1473 actual goals scored), 857 expected for the home team (836 actual) and 686 expected for the away team (637 actual) with the 24 championship teams playing 23 times at home (552 home teams in total) and 23 times away from home (552 away teams in total). These numbers can be used to calculate a number of formulas.
Average expected goals scored by the home team = 857 / 552 = 1.55 goals per match
Average expected goals conceded by the home team = 686 / 552 = 1.24 goals per match
Average expected goals scored by the away team = 686 / 552 = 1.24 goals per match
Average expected goals conceded by the away team = 857 / 552 = 1.55 goals per match
To calculate the values for specific teams we need the expected goals data split by home and away performance. My data for the 2018-19 Championship table is shown below with values at 2 decimal places.
Team
HxGF
HxGA
HxPts
AxGF
AxGA
AxPts
Aston Villa
44.45
30.81
38.67
31.44
32.13
30.59
Birmingham City
32.74
25.01
35.85
27.66
34.07
28.10
Blackburn Rovers
37.15
28.33
35.78
29.16
39.74
26.57
Bolton Wanderers
21.44
31.75
25.11
22.56
37.87
22.83
Brentford
40.53
22.16
41.16
25.65
31.34
28.31
Bristol City
32.46
25.26
35.70
31.15
36.48
28.86
Derby County
34.68
24.22
37.61
23.89
40.54
23.23
Hull City
32.55
29.50
32.76
27.17
39.68
23.84
Ipswich Town
25.63
39.12
24.82
19.77
43.07
19.72
Leeds United
46.04
21.80
44.62
34.80
21.48
38.27
Middlesbrough
39.28
29.37
37.20
27.90
33.30
28.91
Millwall
35.98
27.05
36.95
32.90
33.17
30.18
Norwich City
42.03
23.78
42.02
38.10
35.20
32.98
Nottingham Forest
33.61
29.22
34.56
27.46
38.73
26.18
Preston North End
36.79
32.23
33.22
24.40
35.37
24.55
Queens Park Rangers
38.05
27.92
37.06
27.68
34.43
28.88
Reading
24.23
36.76
25.42
25.36
48.00
19.66
Rotherham United
37.41
40.45
29.76
26.56
38.18
24.99
Sheffield United
37.53
20.73
40.78
38.83
25.37
38.79
Sheffield Wednesday
33.36
29.46
33.73
24.99
37.03
24.78
Stoke City
29.39
24.00
34.75
25.06
33.92
27.28
Swansea City
41.49
27.18
38.34
29.16
32.83
28.64
West Bromwich Albion
44.73
29.42
39.59
30.69
34.93
28.48
Wigan Athletic
35.19
30.19
33.71
33.38
39.86
28.32
League Total
857
686
686
857
League Average
35.70
28.57
28.57
35.70
Match Average
1.55
1.24
1.24
1.55
In the hypothetical example of Preston North End v QPR we will need to calculate the average expected goals specific to both teams by assessing their attacking strength, the opponent’s defending strength and league average performance using the following formulas:
Preston’s average expected goals at home to QPR
= Preston’s home attacking strength x QPR’s away defending strength x average home goals scored
Preston’s home attacking strength
= Preston’s HxGF / League Average HxGF
= 36.79 / 35.70
= 1.031
Anything over 1 implies better than the league average, or in this case Preston are expected to score 3.1% more at home than an average Championship team
QPR’s away defending strength
= QPR’s AxGA / League Average AxGA
= 34.43 / 35.70
= 0.964
Anything under 1 implies better than the league average, or in this case QPR are expected to concede 3.6% fewer away than an average Championship team
Preston’s average expected goals at home to QPR
= Preston’s home attacking strength x QPR’s away defending strength x average home goals scored
= 1.031 x 0.964 x 1.55
= 1.543
QPR’s average expected goals away to Preston
= QPR’s away attacking strength x Preston’s home defending strength x average away goals scored
QPR’s away attacking strength
= QPR’s AxGF / League Average AxGF
= 27.68 / 28.57
= 0.969
Anything over 1 implies better than the league average, or in this case QPR are expected to score 3.1% fewer away than an average Championship team
Preston’s home defending strength
= Preston’s HxGA / League Average HxGA
= 32.23 / 28.57
= 1.128
Anything under 1 implies better than the league average, or in this case Preston are expected to concede 12.8% more away than an average Championship team
QPR’s average expected goals away to Preston
= QPR’s away attacking strength x Preston’s home defending strength x average away goals scored
= 0.969 x 1.128 x 1.24
= 1.351
To conclude we would expect the average scoreline to be:
Preston North End 1.543 – Queens Park Rangers 1.351
Obviously teams do not score a decimal amount of goals therefore we need to distribute this average using Excel’s Poisson formula. The formula is structured in the form of
= POISSON(x, mean, cumulative)
You can calculate the probability the team scores a specific amount of goals by replacing the x with the number of goals, replacing the mean with the average expected goals calculated above and setting cumulative to false.
For example, the probability of Preston scoring 0 goals at home to QPR can be calculated as:
=POISSON(0, 1.543, FALSE)
=0.214
=21.4%
Repeating this for both teams up to 5 goals will produce the following values
Team
0
1
2
3
4
5
Preston North End
21.4%
33.0%
25.4%
13.1%
5.0%
1.5%
Queens Park Rangers
25.8%
34.9%
23.7%
10.7%
3.6%
1.0%
Calculating Match Probabilities
My model assumes that goals are scored independently of each other and therefore the probability of specific scorelines can be calculated by multiplying the two scores together. A 0-0 scoreline would have a probability of 5.5% (21.4% x 25.8%) whereas a 1-1 will have a probability of 11.5% (33.0% x 34.9%).
Calculating the probability of a Preston win is simply a case of adding together all of the favourable scorelines (1-0, 2-0, 2-1, 3-0, 3-1, 3-2 etc.) which comes out as 41.8%. The probability of any draw is 24.7% and a QPR win is 33.5%.
Armed with probabilities for the theoretical match, the next step is to compare these with the bookmakers odds to highlight if there are any differences and by how much. Bookmakers odds are traditionally either shown as fractions or decimals and some hypothetical odds for the match would be shown as the following.
Fractional Odds
Preston North End
Draw
Queens Park Rangers
11/10
5/2
11/4
Decimal Odds
Preston North End
Draw
Queens Park Rangers
2.1
3.5
3.75
To be able to assess where the model differs from the bookmakers odds it is important to convert the odds back to probabilities. This can be done using the following formulas for either of the odds to calculate the probabilities.
Match Outcome
Fractional Odds
Formula
Decimal Odds
Formula
Probability
Preston North End
11/10
=10/(11+10)
2.1
=1/2.1
47.6%
Draw
5/2
=2/(5+2)
3.5
=1/3.5
28.6%
Queens Park Rangers
11/4
=4/(11+4)
3.75
=1/3.75
26.7%
You may have noted that the bookmakers probabilities total more than 100%, or 102.9% in this case. This is called the overround and is always above 100% to ensure the bookmakers make an overall profit on the match assuming they are able to obtain a fair split of bets across the various outcomes according to the probabilities.
With the odds shown in probabilities this can then be compared to the probabilities from the expected goals model to see where there are any discrepancies.
Match Outcome
Modelled Probability
Bookmakers Probability
Difference
Preston North End
41.8%
47.6%
-5.8%
Draw
24.7%
28.6%
-3.9%
Queens Park Rangers
33.5%
26.7%
+6.8%
Both the model and the bookmakers believe the most likely outcome is a Preston North End win but the bookmakers believe it is more likely to occur than the model. A Queens Park Rangers win is the only outcome the model estimates to be more likely than the bookmakers, and although the likelihood is lower than Preston win, this would be the value selection to make in this scenario.
To highlight why it is the selection think of the scenario as a roll of a fair dice where you could bet on the following outcomes: 1, 2 or 3; 4 or 5; and 6. We know each individual numbers are equally likely to appear so betting on the outcome should be solely based on the odds offered.
Outcome
Modelled Probability
Bookmakers Odds (and Probability)
Difference
1, 2 or 3
50.0%
4/5 (55.5%)
-5.5%
4 or 5
33.3%
9/4 (30.7%)
+2.6%
6
16.6%
4/1 (20.0%)
-3.4%
We all know that a 1, 2 or 3 is the most likely outcome but the odds available represent poor value and so over time we should expect to lose money betting on this outcome. It is important to recognise we are not expected to win every bet but ensure we are betting on outcomes that are more likely to occur than the bookmakers odds suggest, as highlighted by a positive difference value.
Staking Strategy
Once we have identified the bets to place, a Queens Park Rangers win in the hypothetical example, the final step is to place the bets.
The last inspiration was to read a book by Joe Peta called “Trading Bases: How a Wall Street Trader Made a Fortune Betting on Baseball”. The title is a perfect synopsis of the book but one of the useful sections highlights how a bigger stake should be placed on bets with a bigger difference between the modelled probability and bookmakers probability, the margin. The logic makes perfect sense in that the bigger the perceived error in the bookmakers odds the bigger the stake should be to capitalise on it.
My staking place roughly follows the approach he adopted in the book and is detailed in the table below.
Margin between Modelled Probability and Bookmaker Probability
% of Bank Staked
Stake for a 100pt Bank
>15 %
2.0%
2pt
>13-15 %
1.5%
1.5pt
>11-13 %
1.0%
1pt
>9-11 %
0.5%
0.5pt
>6-9 %
0.4%
0.4pt
>3-6 %
0.2%
0.2pt
The hypothetical bet on Queens Park Rangers with a +6.8% margin means the selection would have been a 0.4pt win. For the dice roll, the margin of +2.6% would not have met the minimum threshold I use of 3%.
Paper Trading
This now brings the story up to the start of the 2019/20 season where I thought it would be a good idea to paper trade the selections (i.e. record the outcome of the selections identified but with no bets placed) to assess the volume of bets selected, outcome of the bets and the time needed to follow the model.
The first stumbling block was how to assess promoted/relegated teams in terms of their expected goals quality. Obviously using the expected goals from the Championship table for Rotherham United, Bolton Wanderers and Ipswich Town, the three relegated teams, in the League One fixtures would have underestimated their actual quality as their values were achieved against a higher calibre of opposition.
The only sensible and suitable solution I could see was to use cup fixtures between different leagues to estimate the adjustments required for promoted and relegated teams. Obviously teams at not always at full strength but the numbers provided gave an appropriate outcome.
Essentially this means that relegated teams had their xGF increased and xGA reduced to estimate what this performance would have equated to if playing in the division below. The reverse of this is done for promoted teams.
Promoted Teams
Previous Season League
Next Season League
Home xGF Adjustment
Home xGA Adjustment
Away xGF Adjustment
Away xGA Adjustment
Championship
Premier League
x 0.704
x 1.426
x 0.713
x 1.467
League One
Championship
x 0.764
x 1.389
x 0.761
x 1.433
League Two
League One
x 0.815
x 1.296
x 0.815
x 1.259
Relegated Teams
Previous Season League
Next Season League
Home xGF Adjustment
Home xGA Adjustment
Away xGF Adjustment
Away xGA Adjustment
Premier League
Championship
x 1.411
x 0.702
x 1.403
x 0.677
Championship
League One
x 1.296
x 0.705
x 1.287
x 0.691
League One
League Two
x 1.236
x 0.779
x 1.239
x 0.800
The numbers show that there is a bigger difference between leagues the higher the pyramid you go. An example of how this is applied for one of the relegated teams, Rotherham United, is shown below:
Scenario
HxGF
HxGA
AxGF
AxGA
Performance
2018-19 Championship Performance
37.41
40.45
26.56
38.18
21st in Championship
2018-19 Championship Performance Adjusted to League One Standard
48.48 (37.41 x 1.296)
28.52 (40.45 x 0.705)
34.28 (26.56 x 1.287)
26.38 (38.18 x 0.691)
3rd in League One (or 1st with Luton and Barnsley promoted)
This adjustment calculated Rotherham United to be the strongest team in League One for the following season aided by the fact the two teams of a higher standard, Luton Town and Barnsley, were both promoted to the Championship. Ipswich Town and Bolton Wanderers were equivalent to mid table teams in League One.
It’s also important to highlight that I use a rolling seasons data for the calculation of the teams strength so it is a case of replacing the oldest game in the 46 game period with the new one each game week to ensure the data was always up to date.
The additional adjustments caused a slight delay meaning paper trading didn’t actual begin until October 2019 and here are my results to date…
Is it Successful?
The first factor I found is that the model throws up a lot of selections. Across the top four leagues in England the model was highlighting a selection for 60% of the matches. So a typical full weekend schedule of 10 Premier League matches, 12 Championship matches, 11 League One matches (due to no Bury) and 12 League Two matches would highlight around 25-30 teams to bet on. A lot more than I was expecting.
Secondly, the model didn’t select odds on selections very often. This inevitably meant the model fancied outsiders which made sense as I had often read that favourites are typically underpriced due to their popularity in the Saturday accumulators. This meant the strike rate would be lower than expected and that I would need a constant supply of odds against selections to win to ensure it remained profitable.
Five and a half months in and the model is indeed showing a profit. From a starting bank of 100 points it would now stand at 120.64 points at the point of lockdown. One detail that has surprised me is the consistency of the results.
All individual months have shown a profit bar one and the amount has been roughly the same aided somewhat due to a fairly uniform win percentage.
Bet History by Month
Date
Total Games
Bets
Bets %
Wins
Wins %
Stake
Return
Profit
ROI
Bank
Oct-19
195
133
68%
46
35%
62.50
67.58
5.08
8%
105.08
Nov-19
166
111
67%
36
32%
62.10
61.56
-0.54
-1%
104.54
Dec-19
243
141
58%
46
33%
80.90
84.43
3.53
4%
108.08
Jan-20
216
126
58%
40
32%
60.60
65.92
5.32
9%
113.39
Feb-20
265
160
60%
49
31%
79.20
84.29
5.09
6%
118.49
Mar-20
69
43
62%
11
26%
23.70
25.86
2.16
9%
120.64
Total
1199
714
60%
228
32%
369.00
389.64
20.64
6%
Now this still feels like a small sample and is only really half a season so I’m not sure if this is down to luck, expected goals data not fully factored into bookmaker odds yet or a combination of the two. I’m not entirely sure at what point I will know if this is not luck (perhaps someone reading will be able to help) but I know nobody likes to follow a losing model for too long at too much of an expense.
To provide further context of the results to date:
Bet History by League
– League Two has the highest strike rate but is the only league not to make a profit.
– The Premier League has the lowest strike rate and minimal profit. The league probably the most wagered on in the world, particularly with large syndicates, and therefore the odds should be the most accurate and toughest to profit from.
League
Total Games
Bets Made
Bets Made %
Wins
Wins %
Stake
Return
Profit
ROI
Premier League
239
155
65%
42
27%
84.00
85.28
1.27
2%
Championship
360
227
63%
68
30%
128.70
141.56
12.86
10%
League One
292
160
55%
52
33%
73.70
86.26
12.56
17%
League Two
312
174
56%
67
39%
83.20
76.92
-6.28
-8%
Total
1203
716
60%
229
32%
369.60
390.01
20.41
6%
Bet History by Result
– Away wins are by far the most profitable outcome for the model. This reiterates the initial idea with outsiders tending to be the away team with home teams often over bet and providing poor value
– The model very rarely selects a draw
Result
Bets Made
Wins
Wins %
Stake
Return
Profit
ROI
Home
389
143
37%
216.10
192.62
-23.48
-11%
Draw
12
2
17%
3.30
3.95
0.65
20%
Away
315
84
27%
150.20
193.44
43.24
29%
Total
716
229
32%
369.60
390.01
20.41
6%
Bet History by Model Percentage
– A rough correlation between the modelled percentage and the win percentage but surprising low for the most likely outcomes.
– The 20%-50% modelled probability section the most successful for profits.
Model Percentage
Bets Made
Wins
Wins %
Stake
Return
Profit
ROI
70%+
9
4
44%
6.20
4.65
-1.55
-25%
60-70%
39
23
59%
35.70
41.31
5.61
16%
50-60%
120
50
42%
81.20
66.56
-14.64
-18%
40-50%
192
75
39%
101.40
110.50
9.10
9%
30-40%
177
47
27%
83.60
80.32
-3.28
-4%
20-30%
141
25
18%
51.10
74.76
23.66
46%
10-20%
38
5
13%
10.40
11.90
1.50
14%
0-10%
0
0
0%
0.00
0.00
0.00
Total
716
229
32%
369.60
390.01
20.41
6%
Bet History by Odds
– Odds on selections are rarely highlighted but do turn a slight profit
– The model is profitable for any selection priced at 6/4 or higher with strong crossover from the Away win population.
Odds
Bets Made
Wins
Wins %
Stake
Return
Profit
ROI
Odds On
53
31
58%
20.20
22.12
1.92
10%
Evens – <6/4
142
56
39%
85.00
69.56
-15.45
-18%
6/4 – <2/1
128
55
43%
61.80
75.03
13.23
21%
2/1 – <3/1
158
50
32%
88.40
104.14
15.74
18%
3/1+
235
37
16%
114.20
119.17
4.97
4%
Total
716
229
32%
369.60
390.01
20.41
6%
Bet History by Stake
– Probably the most important one to consider. Disappointingly the selections with the biggest margin, and therefore biggest stake, have a low strike rate and return a loss.
– Beyond that and it shows the benefit of the staking strategy. The second most confident bucket provide a large profit with the lowest confident bucket the only other one providing a loss.
– Interesting to highlight that a flat staking plan would have shown a loss.
% of Bank Staked
Bets Made
Wins
Wins %
Stake
Return
Profit
ROI
2.0%
39
11
28%
78.00
67.70
-10.30
-13%
1.5%
35
16
46%
52.50
83.45
30.95
59%
1.0%
49
15
31%
49.00
49.95
0.95
2%
0.5%
105
39
37%
52.50
56.02
3.52
7%
0.4%
200
62
31%
80.00
80.86
0.86
1%
0.2%
288
86
30%
57.60
52.04
-5.56
-10%
Total
716
229
32%
369.60
390.01
20.41
6%
What’s Next?
The next step was to finish paper trading for this season and then to to start financial investing in the model for the 2021/22 football season. Unfortunately the Coronavirus has played havoc with that and with matches being behind closed doors it is unknown how home advantage will be affected. The model is built on data with football played under circumstances so betting on games with no fans seems unsuitable. It will be interesting to see how home advantage is impacted for the remaining games this season to help direct the plan for next season.
That’s everything. Over 6,000 words and numerous tables/formulas. It’s an article a younger me would have loved to read at the start of my journey. I hope someone has managed to get to the end and found it enjoyable, helpful or mildly interesting.
Here’s my review of the season utilising everybody’s favourite football analytical metric – Expected Goals (or xG).
NOTE: For those not familiar with xG this is a metric to monitor the quality of goalscoring chances. A value between 0 and 1 is assigned based on the probability the chance will result in a goal. A 1 in 20 long range shot with have a probability of 5% (an xG of 0.05) whereas a penalty has a 3 in 4 expectancy and therefore an xG of 0.75.
League Table
Luton Town secured back to back promotion as League One champions securing the trophy on the last day of the season ahead of Barnsley. The table had a strong feel at the top this season with just 9 points separating 1st and 5th. According to my xG model the right two teams were promoted with Barnsley and Luton ranked 1st and 2nd respectively comfortably above the remainder of the league.
Charlton Athletic (xG ranked 6th), Portsmouth (xG ranked 3rd) and Sunderland (xG ranked 4th) were all deserving of their playoff spot. 6th placed Doncaster Rovers finished one place above the xG expectations with the model suggesting 9th place Burton Albion were deserving of a playoff spot.
The relegation battle will go down in folklore with 13 teams fighting for survival with little over a month to go. The four who ultimately failed to stay up: Plymouth Argyle (xG ranked 22nd), Walsall (xG ranked 19th), Scunthorpe United (xG ranked 20th) and Bradford City (xG ranked 23rd) were all rated poorly on my xG so significant overhaul will be required next season.
Gillingham were ranked as the weakest team according to xG and my initial prediction is that they will struggle to survive next season with Tom Eaves unlikely to replicate the 20+ goals he scored this term.
Team
GF
GA
GD
Pts
xGF
xGA
xGD
xPts
Rank
1
Luton Town
90
42
48
94
70
42
29
78.8
2
2
Barnsley
80
39
41
91
70
40
30
79.4
1
3
Charlton Athletic
73
40
33
88
65
54
11
68.8
6
4
Portsmouth
83
51
32
88
64
51
14
69.5
3
5
Sunderland
80
47
33
85
59
49
11
69.1
4
6
Doncaster Rovers
76
58
18
73
63
55
8
67.7
7
7
Peterborough United
70
62
8
72
53
61
-9
57.6
17
8
Coventry City
54
54
0
65
59
54
5
65.3
9
9
Burton Albion
66
57
9
63
64
55
10
68.8
5
10
Blackpool
50
52
-2
62
53
55
-2
61.4
13
11
Fleetwood Town
58
52
6
61
45
48
-3
59.9
15
12
Oxford United
57
63
-6
60
50
47
4
64.3
12
13
Gillingham
61
72
-11
55
51
69
-19
53.8
24
14
Accrington Stanley
51
67
-16
55
56
65
-10
59.0
16
15
Bristol Rovers
47
50
-3
54
51
47
4
65.5
8
16
Rochdale
54
87
-33
54
54
69
-16
54.4
21
17
Wycombe Wanderers
55
66
-11
53
51
56
-5
60.4
14
18
Shrewsbury Town
51
59
-8
52
56
51
5
65.0
10
19
Southend United
55
68
-13
50
46
54
-8
57.5
18
20
AFC Wimbledon
42
63
-21
50
56
54
2
64.5
11
21
Plymouth Argyle
56
80
-24
50
53
68
-15
54.2
22
22
Walsall
49
71
-22
47
50
63
-13
55.7
19
23
Scunthorpe United
52
82
-30
46
49
63
-14
54.6
20
24
Bradford City
49
77
-28
41
52
71
-19
53.9
23
The remainder of the article is a club-by-club review focusing on five areas:
Performance by Match – A graphical representation of the xG created and conceded by match day. Useful to highlight sections of the season the team performed particularly well/poor. The colour coding at the top indicating the actual match result.
Performance by Formation – A table to show actual and expected points based on the starting formation used. Useful context to see teams which have a distinct set up and which teams tinkered regularly during the season.
Performance by Manager – A table to show actual and expected points by manager for those teams who made a change during the season.
Attacking Performance by Player – A table to show actual and expected goal involvement by player.
Overall Performance by Player – A new concept to me which attempts to demonstrate the influence a player has to the team by assessing the actual and expected performance when the player featured and when the player was absent.
Accrington Stanley (Actual 14th, xG 16th)
Performance by Match
Performance by Formation
Starting Formation
Matches
Pts p90
xPts p90
4-4-2 (Classic)
29
1.5
1.3
5-4-1
1
1.0
1.0
4-4-1-1
7
1.0
1.6
4-5-1
5
0.6
0.6
3-5-2
3
0.3
1.3
4-3-1-2
1
0.0
0.7
Attacking Performance by Player
Player
Apps
Mins
GI
G
A
xG
xGp90
Sean McConville
44
3945
23
15
8
10.4
0.24
Billy Kee
42
3590
18
13
5
15.4
0.39
Jordan Clark
44
3909
11
5
6
7.0
0.16
Paul Smyth
14
846
5
3
2
2.2
0.23
Offrande Zanzala
27
1303
4
4
4.1
0.28
Luke Armstrong
16
808
3
3
2.5
0.28
Ross Sykes
20
1657
3
3
1.7
0.09
Sam Finley
37
2837
3
1
2
3.3
0.10
Callum Johnson
41
3415
2
0
2
0.3
0.01
Daniel Barlaser
39
3078
2
1
1
2.5
0.07
Overall Performance by Player (P=Playing, NP=Not Playing)
Player
Mins
GD P
GDp90 P
GDp90 NP
Diff
xGD P
xGDp90 P
xGDp90 NP
Diff
Team Average
4140
-16
-0.35
-9.5
-0.21
Mark Hughes
4124
-16
-0.35
0.00
-0.35
-9.5
-0.21
-0.10
-0.11
Sean McConville
3945
-12
-0.27
-1.85
1.57
-7.5
-0.17
-0.91
0.74
Jordan Clark
3909
-15
-0.35
-0.39
0.04
-6.9
-0.16
-1.00
0.84
Billy Kee
3590
-5
-0.13
-1.80
1.67
-6.4
-0.16
-0.51
0.35
Callum Johnson
3415
-18
-0.47
0.25
-0.72
-9.3
-0.24
-0.03
-0.21
Daniel Barlaser
3078
-10
-0.29
-0.51
0.22
-8.9
-0.26
-0.05
-0.20
Sam Finley
2837
-14
-0.44
-0.14
-0.31
-5.9
-0.19
-0.25
0.06
Connor Ripley
1980
-9
-0.41
-0.29
-0.12
-5.4
-0.25
-0.17
-0.08
Seamus Conneely
1961
-5
-0.23
-0.45
0.22
-1.9
-0.09
-0.31
0.23
Nick Anderton
1898
-7
-0.33
-0.36
0.03
-3.2
-0.15
-0.25
0.10
Michael Ihiekwe
1800
-8
-0.40
-0.31
-0.09
-4.9
-0.24
-0.18
-0.07
Janoi Donacien
1681
-6
-0.32
-0.37
0.04
-5.5
-0.30
-0.15
-0.15
Ross Sykes
1657
-4
-0.22
-0.43
0.22
-3.0
-0.16
-0.23
0.07
Scott Brown
1601
-8
-0.45
-0.28
-0.17
-3.5
-0.20
-0.21
0.01
Jon Maxted
1525
-5
-0.30
-0.38
0.08
-4.8
-0.28
-0.16
-0.12
Offrande Zanzala
1303
-2
-0.14
-0.44
0.31
-1.8
-0.12
-0.24
0.12
Ben Richards-Everton
1146
-1
-0.08
-0.45
0.37
-0.6
-0.05
-0.27
0.22
Dimitar Evtimov
878
-9
-0.92
-0.19
-0.73
-4.5
-0.46
-0.14
-0.33
AFC Wimbledon (Actual 20th, xG 11th)
Performance by Match
Performance by Formation
Starting Formation
Matches
Pts p90
xPts p90
5-3-2
2
2.0
0.8
3-5-2
13
1.8
1.4
4-4-1-1
3
1.0
1.4
4-4-2 (Classic)
20
1.0
1.5
4-1-4-1
3
0.3
1.3
4-3-3
2
0.0
1.4
4-5-1
1
0.0
1.0
4-2-3-1
2
0.0
1.1
Performance by Manager
Managerial Record
Matches
Pts p90
Rank
xPts p90
Rank
Neal Ardley
17
0.6
24th
1.6
3rd
Simon Bassey
3
1.0
1.4
Wally Downes
26
1.4
9th
1.3
16th
Attacking Performance by Player
Player
Apps
Mins
GI
G
A
xG
xGp90
Joe Pigott
39
2678
18
15
3
12.9
0.43
Anthony Wordsworth
37
2691
6
2
4
3.2
0.11
James Hanson
29
1708
6
5
1
6.1
0.32
Mitchell Pinnock
33
1844
6
3
3
3.1
0.15
Kwesi Appiah
26
1539
5
4
1
5.7
0.34
Andy Barcham
26
1734
3
1
2
1.0
0.05
Jake Jervis
23
1213
3
2
1
3.9
0.29
Scott Wagstaff
34
2348
3
2
1
2.1
0.08
Steve Seddon
18
1610
3
3
2.0
0.11
Ben Purrington
26
2281
2
0
2
0.3
0.01
Overall Performance by Player (P=Playing, NP=Not Playing)
Player
Mins
GD P
GDp90 P
GDp90 NP
Diff
xGD P
xGDp90 P
xGDp90 NP
Diff
Team Average
4140
-21
-0.46
2.1
0.05
Will Nightingale
3339
-15
-0.40
-0.67
0.27
0.7
0.02
0.15
-0.13
Anthony Wordsworth
2691
-5
-0.17
-0.99
0.83
0.4
0.01
0.10
-0.09
Joe Pigott
2678
-11
-0.37
-0.62
0.25
5.9
0.20
-0.24
0.44
Scott Wagstaff
2348
-19
-0.73
-0.10
-0.63
-0.5
-0.02
0.13
-0.15
Anthony Hartigan
2311
-4
-0.16
-0.84
0.68
-2.6
-0.10
0.23
-0.33
Ben Purrington
2281
-15
-0.59
-0.29
-0.30
4.8
0.19
-0.13
0.32
Adedeji Oshilaja
2242
-21
-0.84
0.00
-0.84
3.1
0.12
-0.05
0.17
Rod McDonald
2038
-13
-0.57
-0.34
-0.23
3.5
0.15
-0.06
0.21
Tennai Watson
1900
-15
-0.71
-0.24
-0.47
-2.0
-0.09
0.16
-0.26
Terell Thomas
1863
-7
-0.34
-0.55
0.22
-1.4
-0.07
0.14
-0.21
Mitchell Pinnock
1844
-15
-0.73
-0.24
-0.50
4.4
0.21
-0.09
0.30
Aaron Ramsdale
1800
-4
-0.20
-0.65
0.45
-3.0
-0.15
0.19
-0.34
Andy Barcham
1734
-11
-0.57
-0.37
-0.20
-1.1
-0.06
0.12
-0.18
James Hanson
1708
-3
-0.16
-0.67
0.51
-0.2
-0.01
0.08
-0.09
Tom Soares
1676
-13
-0.70
-0.29
-0.41
0.4
0.02
0.06
-0.04
Toby Sibbick
1619
-1
-0.06
-0.71
0.66
3.0
0.17
-0.03
0.20
Steve Seddon
1610
-1
-0.06
-0.71
0.66
-1.0
-0.05
0.11
-0.16
Kwesi Appiah
1539
-14
-0.82
-0.24
-0.58
2.0
0.12
0.00
0.12
Barnsley (Actual 2nd, xG 1st)
Performance by Match
Performance by Formation
Starting Formation
Matches
Pts p90
xPts p90
4-4-1-1
2
3.0
1.5
4-1-3-2
1
3.0
2.3
4-1-4-1
3
2.3
1.7
4-4-2 (Classic)
21
2.1
1.8
4-3-3
6
2.0
1.8
4-3-2-1
2
2.0
2.1
4-2-3-1
9
1.4
1.6
4-5-1
2
1.0
1.2
Attacking Performance by Player
Player
Apps
Mins
GI
G
A
xG
xGp90
Kieffer Moore
31
2340
20
17
3
11.7
0.45
Cauley Woodrow
31
2455
17
16
1
11.6
0.42
Alex Mowatt
46
4114
15
8
7
5.4
0.12
Jacob Brown
31
2030
14
8
6
4.1
0.18
Mamadou Thiam
46
2894
13
7
6
7.9
0.25
Brad Potts
22
1736
11
6
5
3.3
0.17
Cameron McGeehan
38
2872
8
6
2
4.8
0.15
Dimitri Kevin Cavare
41
3589
6
2
4
2.3
0.06
Daniel Pinillos
35
2794
5
0
5
1.4
0.05
George Moncur
22
1067
5
1
4
3.5
0.29
Overall Performance by Player (P=Playing, NP=Not Playing)
Player
Mins
GD P
GDp90 P
GDp90 NP
Diff
xGD P
xGDp90 P
xGDp90 NP
Diff
Team Average
4140
41
0.89
29.9
0.65
Ethan Pinnock
4140
41
0.89
29.9
0.65
Alex Mowatt
4114
41
0.90
0.00
0.90
29.6
0.65
1.12
-0.47
Adam Davies
3780
37
0.88
1.00
-0.12
28.6
0.68
0.31
0.37
Liam Lindsay
3683
36
0.88
0.98
-0.10
26.0
0.64
0.75
-0.12
Dimitri Kevin Cavare
3589
33
0.83
1.31
-0.48
25.1
0.63
0.77
-0.14
Mamadou Thiam
2894
26
0.81
1.08
-0.27
18.0
0.56
0.86
-0.30
Cameron McGeehan
2872
26
0.81
1.06
-0.25
20.0
0.63
0.70
-0.07
Daniel Pinillos
2794
30
0.97
0.74
0.23
24.4
0.79
0.37
0.42
Cauley Woodrow
2455
22
0.81
1.01
-0.21
15.4
0.56
0.77
-0.21
Kieffer Moore
2340
23
0.88
0.90
-0.02
18.9
0.73
0.55
0.18
Jacob Brown
2030
26
1.15
0.64
0.51
11.4
0.51
0.79
-0.28
Mike-Steven Bv§hre
1980
21
0.95
0.83
0.12
14.3
0.65
0.65
0.00
Brad Potts
1736
19
0.99
0.82
0.16
15.3
0.80
0.54
0.25
Kenneth Dougall
1583
20
1.14
0.74
0.40
12.7
0.72
0.60
0.12
George Moncur
1067
10
0.84
0.91
-0.06
8.4
0.71
0.63
0.08
Ben Williams
950
10
0.95
0.87
0.07
3.8
0.36
0.74
-0.38
Jordan Williams
645
5
0.70
0.93
-0.23
5.4
0.75
0.63
0.12
Ryan Hedges
635
-1
-0.14
1.08
-1.22
4.2
0.60
0.66
-0.06
Blackpool (Actual 10th, xG 13th)
Performance by Match
Performance by Formation
Starting Formation
Matches
Pts p90
xPts p90
4-3-1-2
1
3.0
1.8
3-5-2
3
1.7
1.3
4-4-2 (Classic)
8
1.5
1.3
3-4-1-2
4
1.5
1.5
4-3-3
19
1.4
1.3
4-2-3-1
9
1.1
1.4
3-4-3 (Diamond Formation)
1
0.0
1.0
3-4-3
1
0.0
1.4
Performance by Manager
Managerial Record
Matches
Pts p90
Rank
xPts p90
Rank
Gary Bowyer
1
1.0
0.8
Terry McPhillips
45
1.4
1.3
Attacking Performance by Player
Player
Apps
Mins
GI
G
A
xG
xGp90
Armand Gnanduillet
43
3290
13
10
3
9.6
0.26
Nathan Delfouneso
38
2838
10
7
3
6.6
0.21
Curtis Tilt
37
3209
7
4
3
3.8
0.11
Jay Spearing
42
3665
6
4
2
3.3
0.08
Michael Nottingham
29
1586
6
2
4
1.3
0.07
Harry Pritchard
37
1774
5
3
2
3.5
0.18
Jordan Thompson
38
2797
5
3
2
5.1
0.16
Joseph Dodoo
18
844
4
2
2
2.3
0.25
Marc Bola
35
3031
4
2
2
0.7
0.02
Matthew Virtue-Thick
13
1016
4
3
1
1.6
0.14
Overall Performance by Player (P=Playing, NP=Not Playing)
Player
Mins
GD P
GDp90 P
GDp90 NP
Diff
xGD P
xGDp90 P
xGDp90 NP
Diff
Team Average
4140
-2
-0.04
-1.8
-0.04
Ben Heneghan
3690
-9
-0.22
1.40
-1.62
-4.9
-0.12
0.61
-0.73
Jay Spearing
3665
-5
-0.12
0.57
-0.69
-1.7
-0.04
-0.04
0.00
Armand Gnanduillet
3290
2
0.05
-0.42
0.48
-2.6
-0.07
0.08
-0.15
Curtis Tilt
3209
5
0.14
-0.68
0.82
1.0
0.03
-0.28
0.30
Marc Bola
3031
6
0.18
-0.65
0.83
0.3
0.01
-0.17
0.18
Nathan Delfouneso
2838
-3
-0.10
0.07
-0.16
-1.2
-0.04
-0.04
0.00
Mark Howard
2806
0
0.00
-0.13
0.13
1.4
0.04
-0.22
0.26
Jordan Thompson
2797
-3
-0.10
0.07
-0.16
-2.3
-0.08
0.03
-0.11
Oliver Turton
2718
5
0.17
-0.44
0.61
4.0
0.13
-0.37
0.50
Liam Feeney
2252
-1
-0.04
-0.05
0.01
-2.6
-0.10
0.04
-0.14
Donervon Daniels
2017
3
0.13
-0.21
0.35
0.1
0.01
-0.08
0.09
Harry Pritchard
1774
-7
-0.36
0.19
-0.55
0.2
0.01
-0.08
0.08
Michael Nottingham
1586
6
0.34
-0.28
0.62
0.3
0.02
-0.08
0.09
Christoffer Mafoumbi
1260
0
0.00
-0.06
0.06
-3.3
-0.23
0.04
-0.28
Callum Guy
1102
4
0.33
-0.18
0.50
-2.6
-0.21
0.02
-0.24
Matthew Virtue-Thick
1016
-4
-0.35
0.06
-0.41
-1.9
-0.17
0.00
-0.17
Joseph Dodoo
844
-2
-0.21
0.00
-0.21
0.6
0.06
-0.07
0.13
Nick Anderton
761
-8
-0.95
0.16
-1.11
-0.5
-0.06
-0.04
-0.02
Bradford City (Actual 24th, xG 23rd)
Performance by Match
Performance by Formation
Starting Formation
Matches
Pts p90
xPts p90
4-1-2-1-2 (Diamond Formation)
1
3.0
0.7
4-3-2-1
2
2.0
1.6
4-1-3-2
4
1.8
0.9
4-4-2 (Classic)
15
1.0
1.4
4-2-3-1
14
0.9
1.1
4-3-3
5
0.0
1.2
3-4-3
2
0.0
1.1
5-3-2
1
0.0
0.7
5-4-1
1
0.0
0.7
3-4-2-1
1
0.0
0.4
Performance by Manager
Managerial Record
Matches
Pts p90
Rank
xPts p90
Rank
Michael Collins
6
1.0
24th
1.0
24th
David Hopkin
28
1.0
24th
1.3
14th
Martin Drury
1
0.0
0.3
Gary Bowyer
11
0.7
24th
1.0
24th
Attacking Performance by Player
Player
Apps
Mins
GI
G
A
xG
xGp90
Eoin Doyle
44
3413
15
11
4
12.9
0.34
Jack Payne
39
2930
14
9
5
7.4
0.23
David Ball
35
2663
8
5
3
6.7
0.23
Anthony O Connor
42
3668
7
6
1
2.4
0.06
George Miller
38
1921
7
3
4
4.2
0.20
Lewis O Brien
40
3385
7
4
3
3.7
0.10
Paul Caddis
27
2231
4
1
3
0.6
0.03
Billy Clarke
13
519
3
1
2
0.2
0.04
Hope Akpan
28
2024
3
2
1
3.5
0.16
Jacob Butterfield
15
1020
2
1
1
1.3
0.12
Overall Performance by Player (P=Playing, NP=Not Playing)
Player
Mins
GD P
GDp90 P
GDp90 NP
Diff
xGD P
xGDp90 P
xGDp90 NP
Diff
Team Average
4140
-28
-0.61
-18.7
-0.41
Richard O Donnell
3780
-27
-0.64
-0.25
-0.39
-14.9
-0.35
-0.95
0.59
Anthony O Connor
3668
-22
-0.54
-1.14
0.60
-19.1
-0.47
0.09
-0.56
Eoin Doyle
3413
-28
-0.74
0.00
-0.74
-14.1
-0.37
-0.57
0.20
Lewis O Brien
3385
-27
-0.72
-0.12
-0.60
-13.5
-0.36
-0.61
0.25
Nathaniel Knight-Percival
3114
-21
-0.61
-0.61
0.01
-8.5
-0.24
-0.90
0.65
Jack Payne
2930
-21
-0.65
-0.52
-0.12
-9.0
-0.28
-0.72
0.44
David Ball
2663
-16
-0.54
-0.73
0.19
-6.5
-0.22
-0.74
0.53
Adam Chicksen
2401
-6
-0.22
-1.14
0.91
-4.7
-0.18
-0.72
0.54
Paul Caddis
2231
-7
-0.28
-0.99
0.71
-3.1
-0.12
-0.74
0.61
Hope Akpan
2024
-21
-0.93
-0.30
-0.64
-9.1
-0.40
-0.41
0.01
Ryan McGowan
1954
-17
-0.78
-0.45
-0.33
-7.0
-0.32
-0.48
0.16
George Miller
1921
-4
-0.19
-0.97
0.79
-7.6
-0.35
-0.45
0.10
Connor Wood
1654
-22
-1.20
-0.22
-0.98
-11.5
-0.63
-0.26
-0.37
Kelvin Mellor
1481
-7
-0.43
-0.71
0.29
-12.9
-0.78
-0.19
-0.59
Josh Wright
1316
-14
-0.96
-0.45
-0.51
-10.8
-0.74
-0.25
-0.48
Sean Scannell
1290
-9
-0.63
-0.60
-0.03
-10.0
-0.70
-0.27
-0.43
Jacob Butterfield
1020
-11
-0.97
-0.49
-0.48
-6.4
-0.57
-0.35
-0.21
Jermaine Anderson
822
-5
-0.55
-0.62
0.08
-6.5
-0.71
-0.33
-0.37
Bristol Rovers (Actual 15th, xG 8th)
Performance by Match
Performance by Formation
Starting Formation
Matches
Pts p90
xPts p90
5-3-2
5
1.8
1.5
4-5-1
3
1.3
1.2
4-4-2 (Classic)
22
1.3
1.5
4-1-2-1-2 (Diamond Formation)
5
1.2
1.4
4-4-1-1
3
0.7
1.1
4-3-3
7
0.6
1.5
3-5-2
1
0.0
1.3
Performance by Manager
Managerial Record
Matches
Pts p90
Rank
xPts p90
Rank
Darrell Clarke
21
0.8
24th
1.5
3rd
Graham Coughlan
25
1.5
8th
1.3
12th
Attacking Performance by Player
Player
Apps
Mins
GI
G
A
xG
xGp90
Jonson Clarke-Harris
16
1314
11
11
6.1
0.42
Tom Nichols
36
2146
8
1
7
4.1
0.17
Alex Rodman
27
1734
7
5
2
2.8
0.14
Liam Sercombe
39
2967
7
4
3
7.1
0.22
Ollie Clarke
40
3428
6
6
4.9
0.13
James Clarke
41
3397
5
2
3
2.0
0.05
Alex Jakubiak
34
1480
4
2
2
2.7
0.17
Ed Upson
35
2919
4
1
3
2.3
0.07
Gavin Reilly
30
1423
4
4
4.0
0.26
Tareiq Holmes-Dennis
18
1452
3
1
2
0.7
0.04
Overall Performance by Player (P=Playing, NP=Not Playing)
Player
Mins
GD P
GDp90 P
GDp90 NP
Diff
xGD P
xGDp90 P
xGDp90 NP
Diff
Team Average
4140
-3
-0.07
3.9
0.09
Tony Craig
4098
-3
-0.07
0.00
-0.07
3.3
0.07
1.37
-1.30
Tom Lockyer
3638
-1
-0.02
-0.36
0.33
2.7
0.07
0.23
-0.16
Jack Bonham
3559
-1
-0.03
-0.31
0.28
-2.2
-0.06
0.95
-1.00
Ollie Clarke
3428
-2
-0.05
-0.13
0.07
1.5
0.04
0.31
-0.27
James Clarke
3397
-7
-0.19
0.48
-0.67
-0.3
-0.01
0.51
-0.51
Liam Sercombe
2967
-2
-0.06
-0.08
0.02
6.2
0.19
-0.18
0.36
Ed Upson
2919
2
0.06
-0.37
0.43
-1.3
-0.04
0.38
-0.42
Tom Nichols
2146
2
0.08
-0.23
0.31
3.2
0.13
0.03
0.10
Michael Kelly
1813
10
0.50
-0.50
1.00
-4.5
-0.22
0.32
-0.55
Alex Rodman
1734
-2
-0.10
-0.04
-0.07
2.3
0.12
0.06
0.06
Alex Jakubiak
1480
1
0.06
-0.14
0.20
-0.4
-0.03
0.15
-0.17
Tareiq Holmes-Dennis
1452
1
0.06
-0.13
0.20
4.1
0.25
-0.01
0.26
Gavin Reilly
1423
1
0.06
-0.13
0.20
1.4
0.09
0.08
0.00
Abu Ogogo
1344
-1
-0.07
-0.06
0.00
-1.6
-0.11
0.18
-0.29
Jonson Clarke-Harris
1314
0
0.00
-0.10
0.10
-1.1
-0.08
0.16
-0.24
Kyle Bennett
1222
-9
-0.66
0.19
-0.85
4.3
0.32
-0.01
0.33
Chris Lines
1215
-7
-0.52
0.12
-0.64
4.2
0.31
-0.01
0.32
Joe Partington
1125
-1
-0.08
-0.06
-0.02
6.3
0.50
-0.07
0.57
Burton Albion (Actual 9th, xG 5th)
Performance by Match
Performance by Formation
Starting Formation
Matches
Pts p90
xPts p90
4-3-1-2
2
3.0
2.1
4-1-2-1-2 (Diamond Formation)
3
2.3
1.5
4-1-4-1
2
1.5
1.9
4-2-3-1
4
1.5
1.5
4-3-3
31
1.3
1.4
5-3-2
1
0.0
2.1
4-4-1-1
1
0.0
1.8
4-5-1
1
0.0
0.7
3-5-2
1
0.0
1.4
Attacking Performance by Player
Player
Apps
Mins
GI
G
A
xG
xGp90
Lucas Akins
45
4050
20
13
7
12.9
0.29
Liam Boyce
37
2941
18
11
7
10.7
0.33
Jamie Allen
41
3421
9
7
2
4.9
0.13
Scott Fraser
42
3398
8
6
2
6.2
0.17
David Templeton
27
1450
6
5
1
5.6
0.34
John Brayford
41
3458
6
3
3
1.0
0.02
Kyle McFadzean
35
3111
5
4
1
2.8
0.08
Marcus Myers-Harness
30
2022
5
3
2
1.8
0.08
Will Miller
19
696
4
1
3
1.6
0.20
Ben Fox
25
1376
3
1
2
1.6
0.11
Overall Performance by Player (P=Playing, NP=Not Playing)
Player
Mins
GD P
GDp90 P
GDp90 NP
Diff
xGD P
xGDp90 P
xGDp90 NP
Diff
Team Average
4140
9
0.20
9.6
0.21
Lucas Akins
4050
9
0.20
0.00
0.20
10.5
0.23
-0.90
1.13
Stephen Quinn
3494
9
0.23
0.00
0.23
7.5
0.19
0.29
-0.09
John Brayford
3458
-2
-0.05
1.45
-1.50
9.1
0.24
0.06
0.18
Jamie Allen
3421
12
0.32
-0.38
0.69
12.5
0.33
-0.37
0.69
Scott Fraser
3398
4
0.11
0.61
-0.50
6.6
0.18
0.36
-0.18
Kyle McFadzean
3111
6
0.17
0.26
-0.09
10.0
0.29
-0.03
0.32
Liam Boyce
2941
2
0.06
0.53
-0.46
3.4
0.10
0.46
-0.36
Bradley Collins
2745
15
0.49
-0.39
0.88
5.6
0.18
0.25
-0.07
Jake Buxton
2070
10
0.43
-0.04
0.48
2.6
0.11
0.30
-0.19
Marcus Myers-Harness
2022
8
0.36
0.04
0.31
4.1
0.18
0.23
-0.05
Ben Turner
1699
1
0.05
0.29
-0.24
4.6
0.24
0.18
0.06
Reece Hutchinson
1511
2
0.12
0.24
-0.12
-2.7
-0.16
0.42
-0.58
Colin Daniel
1493
10
0.60
-0.03
0.64
3.1
0.19
0.22
-0.03
David Templeton
1450
13
0.81
-0.13
0.94
8.1
0.50
0.05
0.45
Ben Fox
1376
4
0.26
0.16
0.10
3.5
0.23
0.20
0.03
Damien McCrory
1053
2
0.17
0.20
-0.03
7.6
0.65
0.06
0.60
Jake Hesketh
1040
-4
-0.35
0.38
-0.72
-0.1
-0.01
0.28
-0.29
Kieran Wallace
978
6
0.55
0.09
0.47
3.6
0.33
0.17
0.16
Charlton Athletic (Actual 3rd, xG 6th)
Performance by Match
Performance by Formation
Starting Formation
Matches
Pts p90
xPts p90
3-4-3
1
3.0
1.1
3-4-1-2
1
3.0
1.6
4-1-2-1-2 (Diamond Formation)
24
2.2
1.5
4-2-3-1
3
2.0
2.2
4-4-2 (Classic)
10
1.7
1.4
4-3-3
2
1.5
1.3
3-5-2
1
1.0
1.3
4-1-3-2
2
0.5
1.4
4-3-2-1
2
0.5
1.2
Attacking Performance by Player
Player
Apps
Mins
GI
G
A
xG
xGp90
Lyle Taylor
40
3554
30
21
9
19.6
0.50
Karlan Ahearne-Grant
28
2296
18
14
4
11.0
0.43
Joe Aribo
36
3113
12
9
3
6.3
0.18
Ben Reeves
29
1837
6
4
2
3.3
0.16
Igor Vetokele
23
1056
5
3
2
2.5
0.22
Krystian Bielik
31
2525
5
3
2
1.5
0.05
Tarique Fosu-Henry
27
1496
5
2
3
3.0
0.18
Jason Pearce
25
2224
4
2
2
1.9
0.08
Josh Cullen
29
2600
4
1
3
2.3
0.08
Darren Pratley
28
1702
3
2
1
1.2
0.06
Overall Performance by Player (P=Playing, NP=Not Playing)
Player
Mins
GD P
GDp90 P
GDp90 NP
Diff
xGD P
xGDp90 P
xGDp90 NP
Diff
Team Average
4140
33
0.72
10.7
0.23
Lyle Taylor
3554
31
0.79
0.31
0.48
8.5
0.22
0.33
-0.12
Chris Solly
3245
16
0.44
1.71
-1.27
3.5
0.10
0.73
-0.63
Patrick Bauer
3116
27
0.78
0.53
0.25
7.3
0.21
0.30
-0.09
Joe Aribo
3113
30
0.87
0.26
0.60
9.0
0.26
0.15
0.11
Mahamadou-Naby Sarr
2814
27
0.86
0.41
0.46
9.1
0.29
0.11
0.18
Josh Cullen
2600
24
0.83
0.53
0.30
10.3
0.36
0.02
0.33
Krystian Bielik
2525
22
0.78
0.61
0.17
7.4
0.26
0.19
0.08
Dillon Phillips
2430
22
0.81
0.58
0.24
9.4
0.35
0.07
0.28
Karlan Ahearne-Grant
2296
12
0.47
1.02
-0.55
3.0
0.12
0.38
-0.26
Jason Pearce
2224
12
0.49
0.99
-0.50
3.6
0.15
0.33
-0.18
Anfernee Dijksteel
1971
20
0.91
0.54
0.37
7.3
0.33
0.14
0.19
Ben Reeves
1837
15
0.73
0.70
0.03
9.1
0.45
0.06
0.38
Jed Steer
1710
11
0.58
0.81
-0.24
1.3
0.07
0.35
-0.28
Darren Pratley
1702
2
0.11
1.14
-1.04
0.1
0.01
0.39
-0.38
Ben Purrington
1665
20
1.08
0.47
0.61
10.1
0.54
0.02
0.52
Tarique Fosu-Henry
1496
10
0.60
0.78
-0.18
0.9
0.05
0.33
-0.28
George Lapslie
1156
8
0.62
0.75
-0.13
1.6
0.12
0.28
-0.15
Jonathan Williams
1144
9
0.71
0.72
-0.01
6.5
0.51
0.13
0.38
Coventry City (Actual 8th, xG 9th)
Performance by Match
Performance by Formation
Starting Formation
Matches
Pts p90
xPts p90
4-4-2 (Classic)
13
1.8
1.4
4-3-3
4
1.5
1.4
4-2-3-1
23
1.3
1.4
4-4-1-1
6
1.0
1.7
Attacking Performance by Player
Player
Apps
Mins
GI
G
A
xG
xGp90
Jordy Hiwula-Mayifuila
38
2953
16
12
4
7.3
0.22
Amadou Bakayoko
30
1633
11
7
4
5.1
0.28
Conor Chaplin
31
2091
11
8
3
8.9
0.38
Bright Enobakhare
18
1489
9
6
3
3.9
0.24
Luke Thomas
43
3619
9
4
5
9.9
0.25
Tom Bayliss
38
3182
6
3
3
2.9
0.08
Jonson Clarke-Harris
27
1790
5
5
5.2
0.26
Dujon Sterling
38
3330
4
0
4
0.8
0.02
Jordan Shipley
31
1935
3
3
2.4
0.11
Junior Brown
22
1557
2
0
2
0.2
0.01
Overall Performance by Player (P=Playing, NP=Not Playing)
Player
Mins
GD P
GDp90 P
GDp90 NP
Diff
xGD P
xGDp90 P
xGDp90 NP
Diff
Team Average
4140
0
0.00
4.7
0.10
Luke Thomas
3619
-1
-0.02
0.17
-0.20
5.1
0.13
-0.07
0.19
Lee Burge
3600
-2
-0.05
0.33
-0.38
2.0
0.05
0.46
-0.41
Dujon Sterling
3330
7
0.19
-0.78
0.97
2.2
0.06
0.28
-0.22
Dominic Hyam
3310
-1
-0.03
0.11
-0.14
6.7
0.18
-0.21
0.40
Jordan Willis
3297
-3
-0.08
0.32
-0.40
1.7
0.05
0.32
-0.27
Tom Bayliss
3182
7
0.20
-0.66
0.86
1.4
0.04
0.31
-0.27
Jordy Hiwula-Mayifuila
2953
8
0.24
-0.61
0.85
5.4
0.16
-0.05
0.21
Liam Kelly
2271
-1
-0.04
0.05
-0.09
1.9
0.08
0.14
-0.06
Brandon Mason
2111
2
0.09
-0.09
0.17
2.5
0.11
0.10
0.01
Conor Chaplin
2091
1
0.04
-0.04
0.09
5.0
0.22
-0.01
0.23
Jordan Shipley
1935
0
0.00
0.00
0.00
-3.0
-0.14
0.31
-0.45
Michael Doyle
1882
-4
-0.19
0.16
-0.35
2.0
0.10
0.11
-0.01
Tom Davies
1795
1
0.05
-0.04
0.09
1.8
0.09
0.11
-0.02
Jonson Clarke-Harris
1790
-9
-0.45
0.34
-0.80
2.9
0.14
0.07
0.07
Amadou Bakayoko
1633
7
0.39
-0.25
0.64
0.7
0.04
0.15
-0.11
Junior Brown
1557
-3
-0.17
0.10
-0.28
-0.1
-0.01
0.17
-0.18
Bright Enobakhare
1489
1
0.06
-0.03
0.09
3.3
0.20
0.05
0.15
Jack Grimmer
682
-7
-0.92
0.18
-1.11
1.7
0.23
0.08
0.15
Doncaster Rovers (Actual 6th, xG 7th)
Performance by Match
Performance by Formation
Starting Formation
Matches
Pts p90
xPts p90
4-3-3
45
1.6
1.5
4-4-2 (Classic)
1
0.0
0.4
Attacking Performance by Player
Player
Apps
Mins
GI
G
A
xG
xGp90
John Marquis
44
3960
25
21
4
16.8
0.38
Mallik Wilks
45
3314
21
14
7
11.1
0.30
James Coppinger
43
3048
16
4
12
3.1
0.09
Herbie Kane
38
3181
10
4
6
3.6
0.10
Benjamin Whiteman
40
3459
8
3
5
3.2
0.08
Ali Crawford
35
2177
7
3
4
2.1
0.09
Matty Blair
42
2901
6
3
3
1.9
0.06
Tommy Rowe
32
1732
6
5
1
2.4
0.12
Alfie May
34
1182
5
2
3
4.6
0.35
Danny Andrew
46
4116
5
4
1
3.3
0.07
Overall Performance by Player (P=Playing, NP=Not Playing)
Player
Mins
GD P
GDp90 P
GDp90 NP
Diff
xGD P
xGDp90 P
xGDp90 NP
Diff
Team Average
4140
18
0.39
7.7
0.17
Danny Andrew
4116
19
0.42
-3.75
4.17
8.7
0.19
-3.76
3.95
John Marquis
3960
16
0.36
1.00
-0.64
7.6
0.17
0.07
0.10
Andy Butler
3570
16
0.40
0.32
0.09
5.0
0.12
0.43
-0.31
Benjamin Whiteman
3459
14
0.36
0.53
-0.16
9.1
0.24
-0.19
0.43
Mallik Wilks
3314
18
0.49
0.00
0.49
7.1
0.19
0.06
0.13
Marko Marosi
3240
5
0.14
1.30
-1.16
5.3
0.15
0.24
-0.09
Herbie Kane
3181
14
0.40
0.38
0.02
11.4
0.32
-0.35
0.67
James Coppinger
3048
15
0.44
0.25
0.20
4.2
0.12
0.29
-0.17
Matty Blair
2901
15
0.47
0.22
0.25
7.2
0.22
0.04
0.19
Ali Crawford
2177
15
0.62
0.14
0.48
0.4
0.02
0.34
-0.32
Tom Anderson
1878
14
0.67
0.16
0.51
10.8
0.52
-0.12
0.64
Tommy Rowe
1732
7
0.36
0.41
-0.05
-0.5
-0.03
0.31
-0.33
Niall Mason
1683
1
0.05
0.62
-0.57
3.0
0.16
0.17
-0.01
Paul Downing
1488
3
0.18
0.51
-0.33
1.2
0.07
0.22
-0.15
Joe Wright
1345
0
0.00
0.58
-0.58
-2.0
-0.13
0.31
-0.45
Alfie May
1182
6
0.46
0.37
0.09
4.1
0.31
0.11
0.20
Ian Lawlor
900
13
1.30
0.14
1.16
2.4
0.24
0.15
0.09
Kieran Sadlier
606
9
1.34
0.23
1.11
2.0
0.30
0.14
0.15
Fleetwood Town (Actual 11th, xG 15th)
Performance by Match
Performance by Formation
Starting Formation
Matches
Pts p90
xPts p90
3-4-3
1
3.0
1.8
4-4-2 (Classic)
23
1.4
1.2
4-3-3
20
1.3
1.4
4-2-3-1
1
0.0
0.7
3-5-2
1
0.0
1.0
Attacking Performance by Player
Player
Apps
Mins
GI
G
A
xG
xGp90
Paddy Madden
44
3536
22
15
7
10.3
0.26
Ched Evans
39
3273
21
17
4
12.1
0.33
Ashley Hunter
42
2648
18
8
10
5.1
0.17
Wes Burns
39
3098
9
7
2
3.7
0.11
Ross Wallace
36
2895
6
1
5
1.4
0.04
Ashley Nadesan
20
1098
4
1
3
2.2
0.18
James Wallace
18
964
4
1
3
0.6
0.05
Lewie Coyle
41
3667
3
0
3
1.2
0.03
Ashley Eastham
45
3884
2
2
1.7
0.04
Cian Bolger
10
572
2
1
1
0.4
0.06
Overall Performance by Player (P=Playing, NP=Not Playing)
Player
Mins
GD P
GDp90 P
GDp90 NP
Diff
xGD P
xGDp90 P
xGDp90 NP
Diff
Team Average
4140
6
0.13
-2.9
-0.06
Alex Cairns
4140
6
0.13
-2.9
-0.06
Ashley Eastham
3884
3
0.07
1.05
-0.99
-1.0
-0.02
-0.65
0.63
Lewie Coyle
3667
7
0.17
-0.19
0.36
-5.0
-0.12
0.41
-0.54
Paddy Madden
3536
12
0.31
-0.89
1.20
-0.6
-0.01
-0.34
0.32
Ched Evans
3273
6
0.16
0.00
0.16
-1.7
-0.05
-0.12
0.07
Wes Burns
3098
2
0.06
0.35
-0.29
0.4
0.01
-0.28
0.29
Ross Wallace
2895
-3
-0.09
0.65
-0.74
1.1
0.03
-0.29
0.32
James Husband
2690
8
0.27
-0.12
0.39
-1.7
-0.06
-0.07
0.02
Ashley Hunter
2648
14
0.48
-0.48
0.96
-0.1
0.00
-0.17
0.16
Jason Holt
2376
8
0.30
-0.10
0.41
-2.0
-0.08
-0.04
-0.03
Craig Morgan
1893
8
0.38
-0.08
0.46
-1.9
-0.09
-0.04
-0.06
Nathan Sheron
1613
-3
-0.17
0.32
-0.49
-1.5
-0.09
-0.05
-0.04
Dean Marney
1240
9
0.65
-0.09
0.75
-6.0
-0.44
0.10
-0.54
Ashley Nadesan
1098
1
0.08
0.15
-0.07
4.0
0.33
-0.20
0.53
Harry Souttar
990
0
0.00
0.17
-0.17
2.6
0.24
-0.16
0.39
Jack Sowerby
971
2
0.19
0.11
0.07
1.3
0.12
-0.12
0.23
James Wallace
964
7
0.65
-0.03
0.68
1.7
0.16
-0.13
0.28
Harrison Biggins
881
-4
-0.41
0.28
-0.68
-0.7
-0.07
-0.06
-0.01
Gillingham (Actual 13th, xG 24th)
Performance by Match
Performance by Formation
Starting Formation
Matches
Pts p90
xPts p90
4-4-2 (Classic)
3
2.0
0.9
4-3-1-2
10
1.7
1.3
3-4-1-2
2
1.5
1.1
4-1-2-1-2 (Diamond Formation)
20
1.2
1.2
3-5-2
4
1.0
1.0
4-3-3
5
0.4
1.2
4-1-3-2
1
0.0
0.7
4-2-3-1
1
0.0
0.4
Performance by Manager
Managerial Record
Matches
Pts p90
Rank
xPts p90
Rank
Steve Lovell
44
1.2
1.2
Mark Patterson
2
1.5
1.1
Attacking Performance by Player
Player
Apps
Mins
GI
G
A
xG
xGp90
Thomas Eaves
43
3369
23
21
2
13.1
0.35
Brandon Hanlan
39
2935
11
9
2
7.7
0.24
Luke O Neill
38
3011
9
3
6
2.6
0.08
Mark Byrne
45
3926
9
4
5
2.6
0.06
Elliott List
36
1880
8
5
3
3.8
0.18
Callum Reilly
25
1675
7
5
2
3.5
0.19
Dean Parrett
25
1593
5
1
4
1.2
0.07
Josh Parker
21
1641
5
4
1
2.5
0.13
Max Ehmer
40
3490
4
1
3
1.8
0.05
Regan Charles-Cook
26
1458
4
3
1
2.8
0.17
Overall Performance by Player (P=Playing, NP=Not Playing)
Player
Mins
GD P
GDp90 P
GDp90 NP
Diff
xGD P
xGDp90 P
xGDp90 NP
Diff
Team Average
4140
-11
-0.24
-18.9
-0.41
Tomas Holy
4140
-11
-0.24
-18.9
-0.41
Mark Byrne
3926
-8
-0.18
-1.26
1.08
-16.1
-0.37
-1.17
0.80
Max Ehmer
3490
-4
-0.10
-0.97
0.87
-12.6
-0.32
-0.88
0.56
Thomas Eaves
3369
-12
-0.32
0.12
-0.44
-14.7
-0.39
-0.49
0.10
Barry Fuller
3272
-8
-0.22
-0.31
0.09
-16.3
-0.45
-0.27
-0.17
Luke O Neill
3011
-10
-0.30
-0.08
-0.22
-10.4
-0.31
-0.68
0.36
Brandon Hanlan
2935
-2
-0.06
-0.67
0.61
-10.5
-0.32
-0.63
0.30
Connor Ogilvie
2641
-9
-0.31
-0.12
-0.19
-14.4
-0.49
-0.27
-0.22
Gabriel Zakuani
2462
-10
-0.37
-0.05
-0.31
-14.3
-0.52
-0.25
-0.27
Elliott List
1880
-14
-0.67
0.12
-0.79
-11.1
-0.53
-0.31
-0.22
Callum Reilly
1675
-7
-0.38
-0.15
-0.23
-14.7
-0.79
-0.15
-0.64
Josh Parker
1641
-7
-0.38
-0.14
-0.24
-12.1
-0.66
-0.24
-0.42
Dean Parrett
1593
-6
-0.34
-0.18
-0.16
-3.9
-0.22
-0.53
0.31
Regan Charles-Cook
1458
2
0.12
-0.44
0.56
-4.7
-0.29
-0.48
0.18
Bradley Garmston
1408
-2
-0.13
-0.30
0.17
-5.9
-0.37
-0.43
0.06
Billy Bingham
1171
-4
-0.31
-0.21
-0.10
-5.3
-0.41
-0.41
0.00
Alex Lacey
1122
-7
-0.56
-0.12
-0.44
-10.6
-0.85
-0.25
-0.60
Leonardo Da Silva Lopes
1015
3
0.27
-0.40
0.67
-1.2
-0.11
-0.51
0.40
Luton Town (Actual 1st, xG 2nd)
Performance by Match
Performance by Formation
Starting Formation
Matches
Pts p90
xPts p90
4-4-1-1
1
3.0
2.1
4-3-1-2
13
2.4
1.9
4-1-2-1-2 (Diamond Formation)
26
2.2
1.7
4-3-3
2
0.5
1.9
4-4-2 (Classic)
2
0.5
1.5
5-3-2
2
0.5
1.3
Performance by Manager
Managerial Record
Matches
Pts p90
Rank
xPts p90
Rank
Nathan Jones
26
2.0
1st
1.6
2nd
Mick Harford
20
2.1
1st
1.8
1st
Attacking Performance by Player
Player
Apps
Mins
GI
G
A
xG
xGp90
James Collins
43
3768
28
25
3
17.8
0.42
Elliot Lee
38
3014
15
12
3
11.1
0.33
Jack Stacey
45
4050
12
4
8
1.7
0.04
Pelly Ruddock
46
4125
11
5
6
3.7
0.08
Danny Hylton
25
1611
9
8
1
6.6
0.37
Harry Cornick
31
1351
9
6
3
3.8
0.25
James Justin
41
3248
9
3
6
3.1
0.09
Andrew Shinnie
41
3407
8
4
4
3.1
0.08
Matty Pearson
46
4082
8
6
2
3.5
0.08
George Moncur
14
472
6
6
1.9
0.36
Overall Performance by Player (P=Playing, NP=Not Playing)
Player
Mins
GD P
GDp90 P
GDp90 NP
Diff
xGD P
xGDp90 P
xGDp90 NP
Diff
Team Average
4140
48
1.04
28.6
0.62
Pelly Ruddock
4125
47
1.03
6.00
-4.97
28.3
0.62
1.97
-1.35
Matty Pearson
4082
47
1.04
1.55
-0.52
27.4
0.60
1.81
-1.21
Jack Stacey
4050
49
1.09
-1.00
2.09
28.5
0.63
0.10
0.53
Sonny Bradley
3960
49
1.11
-0.50
1.61
28.2
0.64
0.21
0.43
James Collins
3768
44
1.05
0.97
0.08
25.6
0.61
0.71
-0.10
James Shea
3690
48
1.17
0.00
1.17
22.9
0.56
1.13
-0.57
Andrew Shinnie
3407
50
1.32
-0.25
1.57
25.2
0.67
0.41
0.26
James Justin
3248
44
1.22
0.40
0.82
21.3
0.59
0.73
-0.14
Elliot Lee
3014
24
0.72
1.92
-1.20
20.2
0.60
0.67
-0.07
Glen Rea
1787
23
1.16
0.96
0.20
11.6
0.58
0.65
-0.07
Danny Hylton
1611
16
0.89
1.14
-0.24
9.6
0.54
0.67
-0.14
Alan McCormack
1416
16
1.02
1.06
-0.04
10.4
0.66
0.60
0.06
Harry Cornick
1351
22
1.47
0.84
0.63
7.2
0.48
0.69
-0.21
Dan Potts
1340
5
0.34
1.38
-1.05
7.7
0.52
0.67
-0.16
Luke Berry
1117
15
1.21
0.98
0.23
11.4
0.92
0.51
0.40
Jorge Grant
1072
8
0.67
1.17
-0.50
7.5
0.63
0.62
0.01
Kazenga Lua Lua
980
17
1.56
0.88
0.68
14.4
1.32
0.40
0.92
George Moncur
472
5
0.95
1.06
-0.10
-0.7
-0.12
0.72
-0.84
Oxford United (Actual 12th, xG 12th)
Performance by Match
Performance by Formation
Starting Formation
Matches
Pts p90
xPts p90
4-1-4-1
1
3.0
1.4
4-2-3-1
28
1.6
1.5
4-1-2-1-2 (Diamond Formation)
1
1.0
0.8
4-3-3
15
0.7
1.2
Attacking Performance by Player
Player
Apps
Mins
GI
G
A
xG
xGp90
James Henry
44
3359
16
11
5
7.7
0.21
Gavin Whyte
36
2728
10
7
3
3.6
0.12
Jamie Mackie
39
2529
10
5
5
4.9
0.18
Cameron Brannagan
41
3573
9
3
6
2.7
0.07
Luke Garbutt
24
1526
9
4
5
2.3
0.14
Marcus Browne
33
2150
9
6
3
5.0
0.21
Jerome Sinclair
16
942
5
3
2
3.0
0.29
Josh Ruffels
44
3699
5
4
1
2.4
0.06
Curtis Nelson
46
4140
4
4
5.5
0.12
John Mousinho
35
2765
3
2
1
2.3
0.08
Overall Performance by Player (P=Playing, NP=Not Playing)
Player
Mins
GD P
GDp90 P
GDp90 NP
Diff
xGD P
xGDp90 P
xGDp90 NP
Diff
.Team Average
4140
-6
-0.13
3.7
0.08
Curtis Nelson
4140
-6
-0.13
3.7
0.08
Josh Ruffels
3699
-1
-0.02
-1.02
1.00
6.0
0.15
-0.47
0.62
Cameron Brannagan
3573
-5
-0.13
-0.16
0.03
4.2
0.11
-0.09
0.19
James Henry
3359
-2
-0.05
-0.46
0.41
9.8
0.26
-0.71
0.97
Robert Dickie
3170
-3
-0.09
-0.28
0.19
2.0
0.06
0.15
-0.09
Simon Eastwood
3150
-1
-0.03
-0.45
0.43
5.7
0.16
-0.18
0.34
John Mousinho
2765
1
0.03
-0.46
0.49
6.7
0.22
-0.20
0.41
Gavin Whyte
2728
1
0.03
-0.45
0.48
8.1
0.27
-0.28
0.55
Jamie Mackie
2529
-6
-0.21
0.00
-0.21
1.5
0.05
0.12
-0.06
Marcus Browne
2150
-8
-0.33
0.09
-0.43
0.7
0.03
0.13
-0.10
Jamie Hanson
2051
-9
-0.39
0.13
-0.52
5.0
0.22
-0.06
0.27
Luke Garbutt
1526
-8
-0.47
0.07
-0.54
-6.2
-0.37
0.34
-0.71
Sam Long
1469
6
0.37
-0.40
0.77
1.6
0.10
0.07
0.03
Ricky Holmes
1123
0
0.00
-0.18
0.18
0.8
0.06
0.09
-0.02
Jordan Graham
1113
0
0.00
-0.18
0.18
4.0
0.32
-0.01
0.34
Jerome Sinclair
942
6
0.57
-0.34
0.91
2.2
0.21
0.04
0.17
Jonathan Mitchell
900
-6
-0.60
0.00
-0.60
-0.8
-0.08
0.12
-0.20
Tony McMahon
900
-5
-0.50
-0.03
-0.47
-5.2
-0.52
0.25
-0.76
Peterborough United (Actual 7th, xG 17th)
Performance by Match
Performance by Formation
Starting Formation
Matches
Pts p90
xPts p90
4-1-3-2
1
3.0
1.4
4-4-2 (Classic)
30
1.9
1.3
4-3-1-2
2
1.5
1.3
4-5-1
2
1.5
1.3
4-4-1-1
3
1.0
1.5
4-1-2-1-2 (Diamond Formation)
6
0.5
1.2
4-2-3-1
2
0.5
0.9
Performance by Manager
Managerial Record
Matches
Pts p90
Rank
xPts p90
Rank
Steve Evans
29
1.7
6th
1.3
16th
Darren Ferguson
17
1.4
th
1.2
16th
Attacking Performance by Player
Player
Apps
Mins
GI
G
A
xG
xGp90
Ivan Toney
44
3111
23
16
7
12.9
0.37
Marcus Maddison
40
2902
22
7
15
6.4
0.20
Matthew Godden
37
2511
17
14
3
8.0
0.29
Jason Cummings
21
951
11
6
5
5.5
0.52
Siriki Dembele
38
2527
11
5
6
3.4
0.12
Joe Ward
43
3133
7
4
3
1.8
0.05
Jason Naismith
43
3708
4
1
3
1.6
0.04
Mark O Hara
21
1312
4
4
1.4
0.10
Rhys Bennett
37
3240
4
4
2.0
0.06
Lee Tomlin
18
1032
3
2
1
2.1
0.18
Overall Performance by Player (P=Playing, NP=Not Playing)
Player
Mins
GD P
GDp90 P
GDp90 NP
Diff
xGD P
xGDp90 P
xGDp90 NP
Diff
Team Average
4140
8
0.17
-8.8
-0.19
Jason Naismith
3708
6
0.15
0.42
-0.27
-10.2
-0.25
0.31
-0.56
Alex Woodyard
3691
12
0.29
-0.80
1.09
-8.0
-0.20
-0.15
-0.04
Ryan Tafazolli
3268
14
0.39
-0.62
1.00
-3.1
-0.09
-0.58
0.49
Rhys Bennett
3240
10
0.28
-0.20
0.48
-9.3
-0.26
0.05
-0.31
Joe Ward
3133
8
0.23
0.00
0.23
-6.2
-0.18
-0.23
0.05
Ivan Toney
3111
-2
-0.06
0.87
-0.93
-6.9
-0.20
-0.16
-0.04
Marcus Maddison
2902
1
0.03
0.51
-0.48
-2.7
-0.08
-0.44
0.36
Aaron Chapman
2880
14
0.44
-0.43
0.87
-4.7
-0.15
-0.29
0.14
Siriki Dembele
2527
18
0.64
-0.56
1.20
-4.5
-0.16
-0.24
0.07
Matthew Godden
2511
4
0.14
0.22
-0.08
-2.3
-0.08
-0.36
0.27
Colin Daniel
1730
12
0.62
-0.15
0.77
-4.9
-0.26
-0.14
-0.11
Louis Reed
1727
-4
-0.21
0.45
-0.66
-2.2
-0.11
-0.25
0.13
Daniel Lafferty
1576
-1
-0.06
0.32
-0.37
-1.5
-0.09
-0.25
0.16
Mark O Hara
1312
9
0.62
-0.03
0.65
-5.2
-0.35
-0.11
-0.24
Ben White
1262
-6
-0.43
0.44
-0.87
-4.3
-0.30
-0.14
-0.16
Conor O Malley
1260
-6
-0.43
0.44
-0.87
-4.0
-0.29
-0.15
-0.14
Lee Tomlin
1032
4
0.35
0.12
0.23
0.3
0.02
-0.26
0.29
Jason Cummings
951
12
1.14
-0.11
1.25
-2.3
-0.22
-0.18
-0.03
Plymouth Argyle (Actual 21st, xG 22nd)
Performance by Match
Performance by Formation
Starting Formation
Matches
Pts p90
xPts p90
4-1-2-1-2 (Diamond Formation)
1
3.0
1.9
4-3-3
12
1.3
1.2
4-2-3-1
26
1.2
1.2
4-5-1
1
1.0
0.7
4-1-4-1
6
0.2
0.9
Performance by Manager
Managerial Record
Matches
Pts p90
Rank
xPts p90
Rank
Derek Adams
45
1.0
1.2
Kevin Nancekivell
1
3.0
1.3
Attacking Performance by Player
Player
Apps
Mins
GI
G
A
xG
xGp90
Freddie Ladapo
45
3713
21
18
3
12.5
0.30
Graham Carey
44
3821
17
6
11
10.5
0.25
Ruben Lameiras
41
2795
17
11
6
6.1
0.20
Antoni Sarcevic
37
3210
7
3
4
5.5
0.15
David Fox
43
3476
5
1
4
2.2
0.06
Joel Grant
17
1157
5
4
1
2.9
0.22
Ryan Edwards
36
3145
5
5
2.8
0.08
Ashley Smith-Brown
31
2643
3
1
2
0.8
0.03
Conor Grant
10
765
3
0
3
0.5
0.05
Niall Canavan
33
2560
2
2
1.3
0.05
Overall Performance by Player (P=Playing, NP=Not Playing)
Player
Mins
GD P
GDp90 P
GDp90 NP
Diff
xGD P
xGDp90 P
xGDp90 NP
Diff
Team Average
4140
-24
-0.52
-14.7
-0.32
Graham Carey
3821
-24
-0.57
0.00
-0.57
-13.3
-0.31
-0.41
0.10
Freddie Ladapo
3713
-17
-0.41
-1.48
1.06
-12.4
-0.30
-0.48
0.18
David Fox
3476
-13
-0.34
-1.49
1.15
-8.6
-0.22
-0.83
0.61
Yann Songo o
3295
-18
-0.49
-0.64
0.15
-14.3
-0.39
-0.05
-0.34
Antoni Sarcevic
3210
-14
-0.39
-0.97
0.58
-6.3
-0.18
-0.82
0.64
Ryan Edwards
3145
-16
-0.46
-0.72
0.27
-13.0
-0.37
-0.15
-0.22
Matt Macey
2953
-29
-0.88
0.38
-1.26
-11.6
-0.35
-0.24
-0.11
Ruben Lameiras
2795
-7
-0.23
-1.14
0.91
-10.2
-0.33
-0.30
-0.03
Gary Sawyer
2650
-12
-0.41
-0.72
0.32
-8.0
-0.27
-0.41
0.14
Ashley Smith-Brown
2643
-12
-0.41
-0.72
0.31
-8.9
-0.30
-0.35
0.04
Niall Canavan
2560
-3
-0.11
-1.20
1.09
-1.8
-0.06
-0.74
0.68
Jamie Ness
1547
-18
-1.05
-0.21
-0.84
-5.4
-0.31
-0.33
0.01
Tafari Moore
1241
-9
-0.65
-0.47
-0.19
-7.8
-0.56
-0.22
-0.35
Kyle Letheren
1160
4
0.31
-0.85
1.16
-3.8
-0.29
-0.33
0.04
Joel Grant
1157
-4
-0.31
-0.60
0.29
-2.3
-0.18
-0.38
0.20
Ryan Taylor
1068
-20
-1.69
-0.12
-1.57
-5.0
-0.42
-0.29
-0.13
Joe Riley
1054
-7
-0.60
-0.50
-0.10
1.5
0.13
-0.47
0.60
Conor Grant
765
-4
-0.47
-0.53
0.06
-3.4
-0.41
-0.30
-0.10
Portsmouth (Actual 4th, xG 3rd)
Performance by Match
Performance by Formation
Starting Formation
Matches
Pts p90
xPts p90
4-4-2 (Classic)
5
2.6
1.1
4-3-3
3
2.3
1.7
4-2-3-1
38
1.8
1.5
Attacking Performance by Player
Player
Apps
Mins
GI
G
A
xG
xGp90
Jamal Lowe
45
3921
23
15
8
10.9
0.25
Ronan Curtis
41
3206
19
11
8
8.5
0.24
Brett Pitman
32
1645
16
11
5
7.2
0.39
Gareth Evans
41
2921
16
10
6
7.1
0.22
Oliver Hawkins
38
2405
13
7
6
7.7
0.29
Ben Close
34
2305
8
8
3.5
0.14
Ben Thompson
23
1703
5
2
3
2.3
0.12
Tom Naylor
43
3870
5
4
1
3.8
0.09
Lee Brown
44
3880
4
0
4
1.0
0.02
Matthew Clarke
46
4135
4
3
1
3.0
0.06
Overall Performance by Player (P=Playing, NP=Not Playing)
Player
Mins
GD P
GDp90 P
GDp90 NP
Diff
xGD P
xGDp90 P
xGDp90 NP
Diff
Team Average
4140
32
0.70
13.6
0.30
Craig MacGillivray
4140
32
0.70
13.6
0.30
Matthew Clarke
4135
31
0.67
18.00
-17.33
13.4
0.29
4.68
-4.39
Jamal Lowe
3921
34
0.78
-0.82
1.60
14.6
0.33
-0.38
0.72
Lee Brown
3880
28
0.65
1.38
-0.74
12.2
0.28
0.48
-0.20
Tom Naylor
3870
32
0.74
0.00
0.74
13.0
0.30
0.20
0.10
Ronan Curtis
3206
24
0.67
0.77
-0.10
12.2
0.34
0.13
0.21
Gareth Evans
2921
23
0.71
0.66
0.04
8.1
0.25
0.41
-0.16
Nathan Thompson
2686
24
0.80
0.50
0.31
18.5
0.62
-0.30
0.92
Oliver Hawkins
2405
17
0.64
0.78
-0.14
8.3
0.31
0.28
0.03
Ben Close
2305
17
0.66
0.74
-0.07
9.0
0.35
0.23
0.12
Jack Whatmough
2234
16
0.64
0.76
-0.11
6.3
0.26
0.34
-0.09
Christian Burgess
1936
16
0.74
0.65
0.09
7.3
0.34
0.26
0.08
Ben Thompson
1703
18
0.95
0.52
0.43
7.8
0.41
0.21
0.20
Brett Pitman
1645
18
0.98
0.51
0.48
7.3
0.40
0.23
0.17
Anton Walkes
1496
8
0.48
0.82
-0.34
-5.7
-0.35
0.66
-1.00
Omar Bogle
678
11
1.46
0.55
0.91
4.2
0.55
0.25
0.31
Bryn Morris
442
0
0.00
0.78
-0.78
-1.9
-0.39
0.38
-0.77
Viv Solomon-Otabor
421
3
0.64
0.70
-0.06
1.9
0.41
0.28
0.12
Rochdale (Actual 16th, xG 21st)
Performance by Match
Performance by Formation
Starting Formation
Matches
Pts p90
xPts p90
4-4-1-1
1
3.0
1.0
3-4-3
6
2.2
1.1
4-1-3-2
2
1.5
1.4
4-3-3
18
1.3
1.1
4-4-2 (Classic)
7
0.9
1.3
3-5-2
5
0.8
1.3
4-2-3-1
2
0.5
1.1
3-4-1-2
1
0.0
2.3
5-4-1
2
0.0
0.7
5-3-2
2
0.0
0.6
Performance by Manager
Managerial Record
Matches
Pts p90
Rank
xPts p90
Rank
Keith Hill
35
1.0
23rd
1.2
20th
Brian Barry-Murphy
11
1.8
6th
1.1
24th
Attacking Performance by Player
Player
Apps
Mins
GI
G
A
xG
xGp90
Ian Henderson
45
3991
26
20
6
13.8
0.31
Aaron Wilbraham
23
1434
7
4
3
3.4
0.22
Bradden Inman
28
1557
7
4
3
3.1
0.18
Calvin Andrew
38
1762
6
3
3
4.1
0.21
Callum Camps
41
3531
5
3
2
4.0
0.10
Matt Done
36
2454
5
2
3
3.6
0.13
Ethan Hamilton
14
1215
4
4
1.6
0.12
Kgosietsile Ntlhe
19
1302
4
3
1
2.5
0.17
Oliver Rathbone
28
2156
4
4
3.9
0.16
Jordan Williams
45
2935
3
2
1
3.6
0.11
Overall Performance by Player (P=Playing, NP=Not Playing)
Player
Mins
GD P
GDp90 P
GDp90 NP
Diff
xGD P
xGDp90 P
xGDp90 NP
Diff
Team Average
4140
-33
-0.72
-15.5
-0.34
Ian Henderson
3991
-26
-0.59
-4.23
3.64
-11.4
-0.26
-2.46
2.21
Callum Camps
3531
-23
-0.59
-1.48
0.89
-15.4
-0.39
-0.02
-0.38
Jordan Williams
2935
-33
-1.01
0.00
-1.01
-9.2
-0.28
-0.47
0.19
Ryan Delaney
2582
-34
-1.19
0.06
-1.24
-14.1
-0.49
-0.08
-0.41
Matt Done
2454
-23
-0.84
-0.53
-0.31
-13.5
-0.49
-0.11
-0.39
Josh Lillis
2356
-19
-0.73
-0.71
-0.02
-9.7
-0.37
-0.29
-0.08
Joseph Rafferty
2274
-14
-0.55
-0.92
0.36
0.2
0.01
-0.76
0.76
Oliver Rathbone
2156
-16
-0.67
-0.77
0.10
-3.9
-0.16
-0.53
0.37
Jimmy McNulty
2149
-8
-0.34
-1.13
0.80
-11.3
-0.47
-0.19
-0.28
Harrison McGahey
1866
-13
-0.63
-0.79
0.16
-1.1
-0.05
-0.57
0.52
Calvin Andrew
1762
-16
-0.82
-0.64
-0.17
-7.8
-0.40
-0.29
-0.10
Bradden Inman
1557
-20
-1.16
-0.45
-0.70
-3.6
-0.21
-0.41
0.20
Aaron Wilbraham
1434
-3
-0.19
-1.00
0.81
-3.2
-0.20
-0.41
0.21
Stephen Dooley
1434
-6
-0.38
-0.90
0.52
-6.0
-0.37
-0.32
-0.06
Ethan Ebanks-Landell
1395
-3
-0.19
-0.98
0.79
-7.8
-0.51
-0.25
-0.25
Kgosietsile Ntlhe
1302
-12
-0.83
-0.67
-0.16
-2.0
-0.14
-0.43
0.29
Ethan Hamilton
1215
-13
-0.96
-0.62
-0.35
-11.4
-0.84
-0.13
-0.72
Joe Bunney
1083
-4
-0.33
-0.85
0.52
-9.7
-0.80
-0.17
-0.63
Scunthorpe United (Actual 23rd, xG 20th)
Performance by Match
Performance by Formation
Starting Formation
Matches
Pts p90
xPts p90
4-3-1-2
1
3.0
1.3
3-4-3
2
1.5
1.9
3-4-1-2
5
1.4
0.9
4-1-2-1-2 (Diamond Formation)
7
1.1
1.6
4-4-2 (Classic)
15
1.0
1.1
4-2-3-1
7
0.9
0.9
4-3-3
5
0.8
1.3
4-3-2-1
1
0.0
1.0
5-3-2
1
0.0
1.1
3-5-2
1
0.0
1.4
4-2-2-2
1
0.0
1.0
Performance by Manager
Managerial Record
Matches
Pts p90
Rank
xPts p90
Rank
Nick Daws
4
1.0
23rd
0.9
24th
Andy Dawson
8
0.4
24th
1.4
13th
Stuart McCall
34
1.1
18th
1.2
20th
Attacking Performance by Player
Player
Apps
Mins
GI
G
A
xG
xGp90
Lee Novak
43
3498
13
12
1
7.4
0.19
Josh Morris
19
1495
11
5
6
3.5
0.21
George Thomas
36
2334
9
2
7
2.7
0.10
Kyle Wootton
25
1797
7
6
1
5.1
0.26
Stephen Humphrys
16
892
6
4
2
4.2
0.43
Tony McMahon
14
1153
5
1
4
0.8
0.06
Ryan Colclough
17
1109
4
2
2
2.0
0.16
Charlie Goode
21
1890
3
3
1.8
0.09
Matthew Lund
22
1424
3
2
1
2.7
0.17
Andy Dales
20
1047
2
1
1
1.1
0.09
Overall Performance by Player (P=Playing, NP=Not Playing)
Player
Mins
GD P
GDp90 P
GDp90 NP
Diff
xGD P
xGDp90 P
xGDp90 NP
Diff
Team Average
4140
-30
-0.65
-13.8
-0.30
Jak Alnwick
3690
-23
-0.56
-1.40
0.84
-10.2
-0.25
-0.72
0.47
Lee Novak
3498
-20
-0.51
-1.40
0.89
-13.1
-0.34
-0.09
-0.24
James Perch
3448
-29
-0.76
-0.13
-0.63
-12.3
-0.32
-0.19
-0.13
Rory McArdle
3281
-29
-0.80
-0.10
-0.69
-8.0
-0.22
-0.61
0.39
Funso Ojo
3209
-17
-0.48
-1.26
0.78
-11.5
-0.32
-0.22
-0.11
Cameron Burgess
3015
-9
-0.27
-1.68
1.41
-12.6
-0.37
-0.10
-0.28
Cameron Borthwick-Jackson
2360
-20
-0.76
-0.51
-0.26
-5.7
-0.22
-0.41
0.19
George Thomas
2334
-25
-0.96
-0.25
-0.71
-13.9
-0.53
0.00
-0.54
Charlie Goode
1890
-14
-0.67
-0.64
-0.03
-8.0
-0.38
-0.23
-0.15
Kyle Wootton
1797
-6
-0.30
-0.92
0.62
-5.2
-0.26
-0.33
0.07
Josh Morris
1495
-19
-1.14
-0.37
-0.77
-5.9
-0.36
-0.27
-0.09
Matthew Lund
1424
-4
-0.25
-0.86
0.61
-6.1
-0.39
-0.25
-0.13
Levi Sutton
1344
-4
-0.27
-0.84
0.57
-3.7
-0.25
-0.32
0.08
Jordan Clarke
1312
-21
-1.44
-0.29
-1.15
-5.3
-0.36
-0.27
-0.09
Tony McMahon
1153
3
0.23
-0.99
1.23
-0.7
-0.06
-0.39
0.34
Ryan Colclough
1109
-4
-0.32
-0.77
0.45
0.9
0.07
-0.44
0.51
Andy Dales
1047
-11
-0.95
-0.55
-0.39
-7.1
-0.61
-0.19
-0.41
Stephen Humphrys
892
-10
-1.01
-0.55
-0.45
-2.7
-0.27
-0.31
0.04
Shrewsbury Town (Actual 18th, xG 10th)
Performance by Match
Performance by Formation
Starting Formation
Matches
Pts p90
xPts p90
3-5-1-1
3
2.0
1.3
3-4-1-2
4
1.8
1.3
3-4-3
3
1.7
1.7
4-1-2-1-2 (Diamond Formation)
7
1.6
1.3
4-3-3
10
1.2
1.7
5-3-2
2
1.0
1.6
3-5-2
6
0.7
1.0
4-4-2 (Classic)
5
0.6
1.3
3-4-2-1
3
0.3
1.5
4-5-1
3
0.3
1.4
Performance by Manager
Managerial Record
Matches
Pts p90
Rank
xPts p90
Rank
John Askey
17
1.1
21st
1.5
3rd
Danny Coyne
3
2.0
1.5
Sam Ricketts
26
1.1
21st
1.3
12th
Attacking Performance by Player
Player
Apps
Mins
GI
G
A
xG
xGp90
Greg Docherty
41
3108
15
7
8
5.0
0.14
Ollie Norburn
41
3329
12
9
3
7.3
0.20
Fejiri Okenabirhie
38
2150
11
10
1
5.5
0.23
Luke Waterfall
44
3883
7
5
2
4.4
0.10
Shaun Whalley
32
2524
7
2
5
6.0
0.22
Josh Laurent
41
2696
5
2
3
4.9
0.16
Tyrese Campbell
15
957
5
5
3.0
0.29
Lee Angol
16
939
4
3
1
2.9
0.28
Aaron Holloway
29
1656
3
2
1
3.6
0.20
Alex Gilliead
27
1497
3
1
2
2.0
0.12
Overall Performance by Player (P=Playing, NP=Not Playing)
Player
Mins
GD P
GDp90 P
GDp90 NP
Diff
xGD P
xGDp90 P
xGDp90 NP
Diff
Team Average
4140
-8
-0.17
5.2
0.11
Luke Waterfall
3883
-8
-0.19
0.00
-0.19
2.9
0.07
0.80
-0.73
Anthony Grant
3459
-8
-0.21
0.00
-0.21
-1.9
-0.05
0.93
-0.98
Ollie Norburn
3329
-6
-0.16
-0.22
0.06
3.4
0.09
0.19
-0.10
Greg Docherty
3108
-5
-0.14
-0.26
0.12
4.7
0.14
0.04
0.10
Omar Beckles
3095
-3
-0.09
-0.43
0.34
6.1
0.18
-0.08
0.26
Josh Laurent
2696
-1
-0.03
-0.44
0.40
10.9
0.36
-0.36
0.72
James Bolton
2667
-6
-0.20
-0.12
-0.08
2.8
0.09
0.14
-0.05
Mat Sadler
2533
-8
-0.28
0.00
-0.28
3.6
0.13
0.09
0.04
Shaun Whalley
2524
0
0.00
-0.45
0.45
8.4
0.30
-0.18
0.48
Fejiri Okenabirhie
2150
-7
-0.29
-0.05
-0.25
-4.0
-0.17
0.41
-0.58
Steve Arnold
2056
-5
-0.22
-0.13
-0.09
-4.8
-0.21
0.43
-0.64
Aaron Holloway
1656
1
0.05
-0.33
0.38
2.3
0.13
0.10
0.02
Alex Gilliead
1497
-4
-0.24
-0.14
-0.10
2.8
0.17
0.08
0.09
Joel Coleman
1440
-5
-0.31
-0.10
-0.21
6.8
0.42
-0.05
0.48
Ro-Shaun Williams
1440
2
0.13
-0.33
0.46
0.8
0.05
0.14
-0.09
Scott Golbourne
1343
-2
-0.13
-0.19
0.06
0.1
0.01
0.16
-0.16
Ryan Haynes
1311
-9
-0.62
0.03
-0.65
2.4
0.16
0.09
0.07
Joshua Emmanuel
1186
-1
-0.08
-0.21
0.14
2.8
0.21
0.07
0.14
Southend United (Actual 19th, xG 18th)
Performance by Match
Performance by Formation
Starting Formation
Matches
Pts p90
xPts p90
4-5-1
2
1.5
1.1
4-4-1-1
2
1.5
2.0
3-5-2
10
1.4
1.2
4-4-2 (Classic)
16
1.2
1.3
4-1-2-1-2 (Diamond Formation)
1
1.0
1.4
4-3-3
9
0.9
1.2
5-3-2
5
0.4
0.9
4-2-3-1
1
0.0
1.1
Performance by Manager
Managerial Record
Matches
Pts p90
Rank
xPts p90
Rank
Chris Powell
39
1.1
21st
1.3
17th
Ricky Duncan
1
0.0
1.1
Kevin Bond
6
1.3
11th
1.2
19th
Attacking Performance by Player
Player
Apps
Mins
GI
G
A
xG
xGp90
Simon Cox
45
3686
21
15
6
9.8
0.24
Tom Hopper
14
1109
9
7
2
3.8
0.31
Sam Mantom
43
3751
8
5
3
4.3
0.10
Timothee Dieng
43
3428
7
3
4
2.7
0.07
Harry Bunn
23
1511
6
4
2
3.3
0.20
Theo Robinson
24
1171
6
4
2
4.1
0.31
Michael Kightly
31
1580
5
1
4
1.2
0.07
Stephen Humphrys
10
583
5
5
1.2
0.19
Ben Coker
16
1326
4
0
4
0.8
0.05
Jason Demetriou
24
1863
4
2
2
1.7
0.08
Overall Performance by Player (P=Playing, NP=Not Playing)
Player
Mins
GD P
GDp90 P
GDp90 NP
Diff
xGD P
xGDp90 P
xGDp90 NP
Diff
Team Average
4140
-13
-0.28
-8.2
-0.18
Sam Mantom
3751
-6
-0.14
-1.62
1.48
-5.9
-0.14
-0.52
0.38
Simon Cox
3686
-15
-0.37
0.40
-0.76
-9.3
-0.23
0.23
-0.46
Timothee Dieng
3428
-14
-0.37
0.13
-0.49
-9.2
-0.24
0.13
-0.37
Michael Turner
3017
-6
-0.18
-0.56
0.38
0.2
0.00
-0.67
0.67
Taylor Moore
2964
-7
-0.21
-0.46
0.25
-9.6
-0.29
0.11
-0.40
John White
2698
-3
-0.10
-0.62
0.52
-6.0
-0.20
-0.14
-0.06
Elvis Bwomono
2535
-7
-0.25
-0.34
0.09
-8.9
-0.32
0.04
-0.36
Mark Oxley
2250
0
0.00
-0.62
0.62
-1.2
-0.05
-0.33
0.28
Jason Demetriou
1863
-10
-0.48
-0.12
-0.36
-0.2
-0.01
-0.32
0.31
Stephen McLaughlin
1785
-12
-0.61
-0.04
-0.57
-0.7
-0.04
-0.29
0.25
Dru Yearwood
1683
-5
-0.27
-0.29
0.03
-4.7
-0.25
-0.13
-0.12
Nathan Bishop
1620
-11
-0.61
-0.07
-0.54
-7.2
-0.40
-0.04
-0.36
Michael Kightly
1580
-10
-0.57
-0.11
-0.46
-3.8
-0.22
-0.15
-0.06
Sam Hart
1543
-11
-0.64
-0.07
-0.57
-7.6
-0.45
-0.02
-0.43
Harry Bunn
1511
-13
-0.77
0.00
-0.77
-2.5
-0.15
-0.19
0.04
Ben Coker
1326
3
0.20
-0.51
0.72
4.7
0.32
-0.41
0.73
Stephen Hendrie
1267
-2
-0.14
-0.34
0.20
-4.4
-0.32
-0.12
-0.20
Theo Robinson
1171
8
0.61
-0.64
1.25
-0.8
-0.06
-0.22
0.16
Sunderland (Actual 5th, xG 4th)
Performance by Match
Performance by Formation
Starting Formation
Matches
Pts p90
xPts p90
4-2-3-1
30
2.0
1.6
4-5-1
2
2.0
1.5
4-4-2 (Classic)
10
1.8
1.4
3-5-2
1
1.0
1.0
4-1-3-2
1
1.0
2.3
4-3-3
2
0.5
1.0
Attacking Performance by Player
Player
Apps
Mins
GI
G
A
xG
xGp90
Josh Maja
23
1696
17
15
2
5.5
0.29
Aiden McGeady
33
2491
16
11
5
6.8
0.24
Lynden Gooch
38
2746
12
5
7
4.3
0.14
Chris Maguire
33
2037
11
7
4
5.2
0.23
George Honeyman
36
2862
9
6
3
3.3
0.11
Lee Cattermole
29
2501
9
7
2
2.7
0.10
Luke O Nien
37
2346
8
5
3
1.5
0.06
Charlie Wyke
21
1205
7
4
3
5.9
0.44
Max Power
35
2679
7
4
3
3.8
0.13
William Grigg
17
1186
7
4
3
5.2
0.40
Overall Performance by Player (P=Playing, NP=Not Playing)
Player
Mins
GD P
GDp90 P
GDp90 NP
Diff
xGD P
xGDp90 P
xGDp90 NP
Diff
Team Average
4140
33
0.72
10.6
0.23
Jon McLaughlin
4126
33
0.72
0.00
0.72
9.9
0.22
4.01
-3.79
Jack Baldwin
3060
25
0.74
0.67
0.07
4.4
0.13
0.51
-0.38
George Honeyman
2862
29
0.91
0.28
0.63
8.0
0.25
0.18
0.07
Lynden Gooch
2746
21
0.69
0.77
-0.09
2.3
0.08
0.53
-0.45
Tom Flanagan
2729
25
0.82
0.51
0.31
9.2
0.30
0.09
0.22
Max Power
2679
13
0.44
1.23
-0.80
5.0
0.17
0.34
-0.17
Lee Cattermole
2501
23
0.83
0.55
0.28
8.4
0.30
0.12
0.19
Aiden McGeady
2491
20
0.72
0.71
0.01
8.8
0.32
0.09
0.23
Luke O Nien
2346
14
0.54
0.95
-0.42
11.4
0.44
-0.04
0.48
Reece James
2246
20
0.80
0.62
0.18
1.1
0.04
0.45
-0.40
Chris Maguire
2037
26
1.15
0.30
0.85
2.9
0.13
0.33
-0.20
Adam Matthews
1949
19
0.88
0.58
0.30
1.3
0.06
0.38
-0.32
Josh Maja
1696
19
1.01
0.52
0.49
1.5
0.08
0.33
-0.25
Bryan Oviedo
1468
9
0.55
0.81
-0.26
5.3
0.32
0.18
0.15
Dylan McGeouch
1235
17
1.24
0.50
0.74
0.0
0.00
0.33
-0.32
Charlie Wyke
1205
2
0.15
0.95
-0.80
6.9
0.52
0.11
0.41
William Grigg
1186
10
0.76
0.70
0.06
7.3
0.56
0.10
0.46
Grant Leadbitter
1136
6
0.48
0.81
-0.33
7.4
0.59
0.09
0.50
Walsall (Actual 22nd, xG 19th)
Performance by Match
Performance by Formation
Starting Formation
Matches
Pts p90
xPts p90
3-5-2
1
3.0
1.8
4-5-1
1
3.0
2.1
3-4-3
1
3.0
1.4
4-2-3-1
2
2.0
1.0
4-4-2 (Classic)
29
1.0
1.2
4-3-3
9
0.6
1.2
4-1-2-1-2 (Diamond Formation)
1
0.0
1.0
4-1-4-1
1
0.0
0.5
Performance by Manager
Managerial Record
Matches
Pts p90
Rank
xPts p90
Rank
Dean Keates
41
1.0
22nd
1.2
20th
Martin O’Connor
5
1.0
22nd
1.4
8th
Attacking Performance by Player
Player
Apps
Mins
GI
G
A
xG
xGp90
Andy Cook
42
3202
16
13
3
12.0
0.34
Josh Gordon
35
2467
10
7
3
5.3
0.20
Luke Leahy
44
3943
9
3
6
2.5
0.06
George Dobson
39
3157
6
0
6
1.9
0.05
Morgan Ferrier
33
2166
6
5
1
4.6
0.19
Nicholas Devlin
43
3745
4
2
2
0.8
0.02
Zeli Ismail
32
1985
4
3
1
2.8
0.13
Isaiah Osbourne
32
2284
3
3
2.1
0.08
Kieron Morris
17
1029
3
2
1
2.2
0.19
Dan Scarr
17
1502
2
1
1
0.6
0.04
Overall Performance by Player (P=Playing, NP=Not Playing)
Player
Mins
GD P
GDp90 P
GDp90 NP
Diff
xGD P
xGDp90 P
xGDp90 NP
Diff
Team Average
4140
-22
-0.48
-12.9
-0.28
Luke Leahy
3943
-17
-0.39
-2.28
1.90
-10.8
-0.25
-0.96
0.71
Liam Roberts
3780
-24
-0.57
0.50
-1.07
-13.8
-0.33
0.22
-0.55
Nicholas Devlin
3745
-17
-0.41
-1.14
0.73
-10.8
-0.26
-0.48
0.22
Jon Guthrie
3718
-20
-0.48
-0.43
-0.06
-11.6
-0.28
-0.28
0.00
Andy Cook
3202
-14
-0.39
-0.77
0.37
-6.2
-0.17
-0.64
0.47
George Dobson
3157
-13
-0.37
-0.82
0.45
-8.6
-0.25
-0.39
0.15
Josh Gordon
2467
-12
-0.44
-0.54
0.10
-6.2
-0.23
-0.36
0.13
Liam Kinsella
2295
-12
-0.47
-0.49
0.02
-7.6
-0.30
-0.26
-0.04
Isaiah Osbourne
2284
-14
-0.55
-0.39
-0.16
-9.9
-0.39
-0.15
-0.24
Morgan Ferrier
2166
-12
-0.50
-0.46
-0.04
-9.2
-0.38
-0.17
-0.21
Zeli Ismail
1985
-8
-0.36
-0.58
0.22
-6.2
-0.28
-0.28
0.00
Jack Fitzwater
1849
-10
-0.49
-0.47
-0.02
-10.0
-0.48
-0.12
-0.37
Joe Edwards
1542
-7
-0.41
-0.52
0.11
-3.9
-0.23
-0.31
0.09
Josh Ginnelly
1531
-7
-0.41
-0.52
0.11
-8.3
-0.49
-0.16
-0.33
Dan Scarr
1502
-11
-0.66
-0.38
-0.28
-3.7
-0.22
-0.31
0.09
Kieron Morris
1029
-5
-0.44
-0.49
0.05
-5.4
-0.47
-0.22
-0.25
Russell Martin
720
-8
-1.00
-0.37
-0.63
-2.5
-0.31
-0.27
-0.04
Matthew Jarvis
709
-4
-0.51
-0.47
-0.04
-0.9
-0.11
-0.32
0.20
Wycombe Wanderers (Actual 17th, xG 14th)
Performance by Match
Performance by Formation
Starting Formation
Matches
Pts p90
xPts p90
3-5-2
2
2.0
1.3
4-4-2 (Classic)
17
1.4
1.3
4-3-3
25
1.0
1.4
4-3-1-2
1
0.0
1.6
4-2-3-1
1
0.0
1.0
Attacking Performance by Player
Player
Apps
Mins
GI
G
A
xG
xGp90
Adebayo Akinfenwa
36
2463
13
7
6
8.6
0.31
Joe Jacobson
36
3197
12
7
5
5.0
0.14
Alex Samuel
30
2289
6
5
1
4.8
0.19
Paris Cowan-Hall
30
1508
6
4
2
2.5
0.15
Bryn Morris
19
1407
5
3
2
2.7
0.17
Adam El-Abd
34
3015
4
3
1
3.0
0.09
Fred Onyedinma
20
1465
4
4
3.3
0.20
Jason McCarthy
44
3960
4
2
2
1.6
0.04
Randell Williams
19
1260
4
2
2
1.9
0.14
Scott Kashket
26
1130
4
3
1
3.4
0.27
Overall Performance by Player (P=Playing, NP=Not Playing)
Here’s my review of the season utilising everybody’s favourite football analytical metric – Expected Goals (or xG).
NOTE: For those not familiar with xG this is a metric to monitor the quality of goalscoring chances. A value between 0 and 1 is assigned based on the probability the chance will result in a goal. A 1 in 20 long range shot with have a probability of 5% (an xG of 0.05) whereas a penalty has a 3 in 4 expectancy and therefore an xG of 0.75.
League Table
Lincoln City ran out relatively comfortable league winners securing the trophy by the end of April but were rated as the 5th best team by my xG model. The honour of the best rated team goes to Bury who finished runners up on goal difference ahead of MK Dons (6th on xG ranking).
Mansfield Town (xG ranked 2nd) can be considered unlucky not to achieve automatic promotion and now have another season in the fourth tier after failing in the playoffs. The playoff final will be contested between 6th place finishers Tranmere Rovers (xG ranked 10th) and 7th place finishers Newport County (xG ranked 7th).
At the other end of the table both Notts County (xG ranked 19th) and Yeovil Town (xG ranked 18th) were unfortunate to fall through the EFL trap door. Grimsby Town and Macclesfield Town were ranked as the worst two teams in the league.
One team to highlight are Northampton Town. My xG model ranks them as a team of automatic promotion quality and so they should be massively disappointed with a bottom half finish. If they can get results that match their expected xG performance they should have a strong season ahead of them.
Team
GF
GA
GD
Pts
xGF
xGA
xGD
xPts
Rank
1
Lincoln City
73
43
30
85
58
45
13
70.2
5
2
Bury
83
56
27
79
72
49
23
74.5
1
3
MK Dons
71
49
22
79
69
56
13
70.1
6
4
Mansfield Town
69
41
28
76
62
45
17
71.4
2
5
Forest Green Rovers
68
47
21
74
52
52
0
62.6
14
6
Tranmere Rovers
63
50
13
73
56
53
3
64.6
10
7
Newport County
59
59
0
71
59
51
8
67.3
7
8
Colchester United
65
53
12
70
58
45
13
70.5
4
9
Exeter City
60
49
11
70
62
54
8
66.1
9
10
Stevenage
59
55
4
70
47
58
-11
56.3
20
11
Carlisle United
67
62
5
68
55
56
-2
63.3
12
12
Crewe Alexandra
60
59
1
65
55
55
-1
62.8
13
13
Swindon Town
59
56
3
64
57
51
6
66.7
8
14
Oldham Athletic
67
60
7
62
50
57
-7
59.1
16
15
Northampton Town
64
63
1
61
70
57
12
70.9
3
16
Cheltenham Town
57
68
-11
57
50
61
-12
56.2
21
17
Grimsby Town
45
57
-12
56
45
67
-22
51.1
24
18
Morecambe
54
70
-16
54
46
61
-15
54.2
22
19
Crawley Town
51
68
-17
53
49
56
-7
58.6
17
20
Port Vale
39
55
-16
49
53
53
1
63.7
11
21
Cambridge United
40
66
-26
47
51
55
-4
60.9
15
22
Macclesfield Town
48
74
-26
44
48
65
-17
52.6
23
23
Notts County
48
84
-36
41
47
58
-11
56.7
19
24
Yeovil Town
41
66
-25
40
48
55
-7
57.7
18
The remainder of the article is a club-by-club review focusing on five areas:
Performance by Match – A graphical representation of the xG created and conceded by match day. Useful to highlight sections of the season the team performed particularly well/poor. The colour coding at the top indicating the actual match result.
Performance by Formation – A table to show actual and expected points based on the starting formation used. Useful context to see teams which have a distinct set up and which teams tinkered regularly during the season.
Performance by Manager – A table to show actual and expected points by manager for those teams who made a change during the season.
Attacking Performance by Player – A table to show actual and expected goal involvement by player.
Overall Performance by Player – A new concept to me which attempts to demonstrate the influence a player has to the team by assessing the actual and expected performance when the player featured and when the player was absent.
Bury (Actual 2nd, xG 1st)
Performance by Match
Performance by Formation
Starting Formation
Matches
Pts p90
xPts p90
3-4-1-2
9
1.9
1.6
3-5-2
33
1.8
1.6
5-3-2
3
1.0
1.8
4-4-2 (Classic)
1
0.0
1.4
Attacking Performance by Player
Player
Apps
Mins
GI
G
A
xG
xGp90
Nicky Maynard
37
2952
26
21
5
17.1
0.52
Jay O Shea
44
3704
20
15
5
10.9
0.27
Danny Mayor
39
3380
17
8
9
5.9
0.16
Nicholas Adams
46
3822
17
2
15
3.8
0.09
Dominic Telford
37
1637
9
6
3
6.4
0.35
Byron Moore
36
2035
8
5
3
3.2
0.14
Callum McFadzean
40
3239
7
0
7
1.1
0.03
Will Aimson
37
3160
6
4
2
2.1
0.06
Caolan Lavery
23
903
5
5
3.5
0.35
Chris Dagnall
16
900
4
3
1
2.9
0.29
Overall Performance by Player (P=Playing, NP=Not Playing)
Player
Mins
GD P
GDp90 P
GDp90 NP
Diff
xGD P
xGDp90 P
xGDp90 NP
Diff
Team Average
4140
27
0.59
22.7
0.49
Joe Murphy
4140
27
0.59
22.7
0.49
Adam Thompson
3954
28
0.64
-0.48
1.12
24.1
0.55
-0.67
1.22
Nicholas Adams
3822
28
0.66
-0.28
0.94
23.3
0.55
-0.17
0.72
Jay O Shea
3704
23
0.56
0.83
-0.27
17.5
0.43
1.08
-0.66
Danny Mayor
3380
30
0.80
-0.36
1.15
23.9
0.64
-0.14
0.78
Callum McFadzean
3239
24
0.67
0.30
0.37
20.6
0.57
0.22
0.35
Will Aimson
3160
28
0.80
-0.09
0.89
19.1
0.54
0.34
0.20
Chris Stokes
3048
14
0.41
1.07
-0.66
12.6
0.37
0.84
-0.46
Nicky Maynard
2952
19
0.58
0.61
-0.03
16.2
0.49
0.50
0.00
Neil Danns
2365
5
0.19
1.12
-0.93
9.1
0.35
0.69
-0.35
Byron Moore
2035
23
1.02
0.17
0.85
11.9
0.53
0.46
0.06
Eoghan O Connell
1712
7
0.37
0.74
-0.37
6.6
0.35
0.60
-0.25
Dominic Telford
1637
10
0.55
0.61
-0.06
8.1
0.45
0.53
-0.08
Jordan Rossiter
1384
4
0.26
0.75
-0.49
7.8
0.51
0.49
0.02
Scott Wharton
1169
2
0.15
0.76
-0.60
5.8
0.44
0.51
-0.07
Caolan Lavery
903
8
0.80
0.53
0.27
5.1
0.50
0.49
0.01
Chris Dagnall
900
8
0.80
0.53
0.27
6.6
0.66
0.45
0.21
Callum Styles
860
10
1.05
0.47
0.58
5.5
0.57
0.47
0.10
Cambridge United (Actual 21st, xG 15th)
Performance by Match
Performance by Formation
Starting Formation
Matches
Pts p90
xPts p90
4-3-3
5
1.4
1.2
4-4-2 (Classic)
10
1.2
1.2
4-1-2-1-2 (Diamond Formation)
15
1.1
1.4
4-2-3-1
9
1.1
1.6
4-2-2-2
1
1.0
2.1
5-4-1
1
0.0
0.7
4-4-1-1
5
0.0
0.8
Performance by Manager
Managerial Record
Matches
Pts p90
Rank
xPts p90
Rank
Joe Dunne
20
1.0
22nd
1.3
15th
Mark Bonner
2
0.5
1.3
Colin Calderwood
24
1.1
20th
1.3
15th
Attacking Performance by Player
Player
Apps
Mins
GI
G
A
xG
xGp90
Jeavani Brown
43
3519
16
7
9
7.2
0.18
George Maris
39
3315
10
5
5
7.3
0.20
David Amoo
43
2419
8
5
3
3.3
0.12
Jabo Ibehre
35
2654
7
4
3
6.8
0.23
Paul Lewis
22
1169
4
4
3.3
0.25
Adebayo Azeez
26
1170
3
2
1
4.2
0.32
George Taft
36
3104
3
2
1
1.4
0.04
Reggie Lambe
32
2304
3
3
2.8
0.11
Rushian Hepburn-Murphy
16
851
3
2
1
2.4
0.25
Brad Halliday
38
3288
2
0
2
0.8
0.02
Overall Performance by Player (P=Playing, NP=Not Playing)
Player
Mins
GD P
GDp90 P
GDp90 NP
Diff
xGD P
xGDp90 P
xGDp90 NP
Diff
Team Average
4140
-26
-0.57
-4.3
-0.09
Gary Deegan
3614
-18
-0.45
-1.37
0.92
-0.8
-0.02
-0.60
0.58
Jeavani Brown
3519
-14
-0.36
-1.74
1.38
2.9
0.07
-1.04
1.11
Greg Taylor
3506
-23
-0.59
-0.43
-0.16
-6.0
-0.15
0.24
-0.39
George Maris
3315
-21
-0.57
-0.55
-0.02
-4.4
-0.12
0.01
-0.13
Brad Halliday
3288
-17
-0.47
-0.95
0.49
0.2
0.00
-0.47
0.48
George Taft
3104
-13
-0.38
-1.13
0.75
-1.7
-0.05
-0.22
0.17
Jake Carroll
2748
-21
-0.69
-0.32
-0.36
-8.0
-0.26
0.24
-0.50
Jabo Ibehre
2654
-12
-0.41
-0.85
0.44
0.5
0.02
-0.29
0.31
David Amoo
2419
-8
-0.30
-0.94
0.64
2.2
0.08
-0.34
0.42
Reggie Lambe
2304
-14
-0.55
-0.59
0.04
-1.4
-0.06
-0.14
0.09
David Forde
2250
-21
-0.84
-0.24
-0.60
-2.2
-0.09
-0.10
0.01
Dimitar Mitov
1890
-5
-0.24
-0.84
0.60
-2.1
-0.10
-0.09
-0.01
Louis John
1555
-14
-0.81
-0.42
-0.39
1.3
0.08
-0.20
0.27
Harrison Dunk
1492
-10
-0.60
-0.54
-0.06
-3.5
-0.21
-0.03
-0.18
Liam O Neil
1182
-11
-0.84
-0.46
-0.38
-0.7
-0.05
-0.11
0.06
Adebayo Azeez
1170
-14
-1.08
-0.36
-0.71
-4.7
-0.36
0.01
-0.37
Paul Lewis
1169
-10
-0.77
-0.48
-0.29
-2.9
-0.22
-0.04
-0.18
Harry Darling
1072
-13
-1.09
-0.38
-0.71
-4.7
-0.39
0.01
-0.40
Carlisle United (Actual 11th, xG 12th)
Performance by Match
Performance by Formation
Starting Formation
Matches
Pts p90
xPts p90
5-3-2
4
3.0
2.0
4-4-2 (Classic)
9
1.8
1.4
3-5-2
5
1.4
1.7
4-5-1
16
1.4
1.2
4-3-3
10
1.1
1.3
4-4-1-1
1
0.0
1.4
3-5-1-1
1
0.0
0.8
Performance by Manager
Managerial Record
Matches
Pts p90
Rank
xPts p90
Rank
John Sheridan
26
1.6
5th
1.4
10th
Tommy Wright
2
1.5
1.5
Steven Pressley
18
1.3
15th
1.3
15th
Attacking Performance by Player
Player
Apps
Mins
GI
G
A
xG
xGp90
Hallam Hope
40
3504
21
14
7
11.3
0.29
Jamie Devitt
35
2740
18
11
7
5.1
0.17
Ashley Nadesan
25
1921
14
8
6
5.7
0.27
Danny Grainger
23
1982
8
5
3
2.9
0.13
Jerry Yates
23
1926
7
6
1
4.6
0.22
Callum O Hare
16
1333
6
3
3
2.3
0.16
Jack Sowerby
24
1934
6
4
2
1.9
0.09
Nathan Thomas
16
1024
5
4
1
3.8
0.33
Richard Bennett
20
1195
5
4
1
2.7
0.21
Regan Slater
32
2055
4
2
2
1.7
0.07
Overall Performance by Player (P=Playing, NP=Not Playing)
Player
Mins
GD P
GDp90 P
GDp90 NP
Diff
xGD P
xGDp90 P
xGDp90 NP
Diff
Team Average
4140
5
0.11
-1.6
-0.03
Adam Collin
3723
5
0.12
0.00
0.12
-0.5
-0.01
-0.22
0.20
Anthony Gerrard
3681
11
0.27
-1.18
1.45
2.2
0.05
-0.73
0.79
Hallam Hope
3504
9
0.23
-0.57
0.80
0.1
0.00
-0.23
0.23
Gary Liddle
3490
4
0.10
0.14
-0.04
-0.7
-0.02
-0.12
0.10
Tom Parkes
3391
3
0.08
0.24
-0.16
-2.6
-0.07
0.13
-0.20
Kelvin Etuhu
3061
5
0.15
0.00
0.15
1.3
0.04
-0.24
0.28
Jamie Devitt
2740
11
0.36
-0.39
0.75
0.1
0.00
-0.10
0.10
Regan Slater
2055
-4
-0.18
0.39
-0.56
-3.2
-0.14
0.07
-0.21
Danny Grainger
1982
11
0.50
-0.25
0.75
0.8
0.04
-0.10
0.14
Jack Sowerby
1934
12
0.56
-0.29
0.84
5.4
0.25
-0.28
0.54
Jerry Yates
1926
18
0.84
-0.53
1.37
1.5
0.07
-0.12
0.19
Ashley Nadesan
1921
15
0.70
-0.41
1.11
5.4
0.25
-0.28
0.53
Macaulay Gillesphey
1812
1
0.05
0.15
-0.10
-0.6
-0.03
-0.04
0.01
Michael Jones
1652
-2
-0.11
0.25
-0.36
0.3
0.02
-0.07
0.09
Gary Miller
1442
-4
-0.25
0.30
-0.55
-3.1
-0.19
0.05
-0.24
Callum O Hare
1333
-5
-0.34
0.32
-0.66
-2.8
-0.19
0.04
-0.23
Richard Bennett
1195
-4
-0.30
0.28
-0.58
-3.8
-0.29
0.07
-0.35
Nathan Thomas
1024
-8
-0.70
0.38
-1.08
-3.6
-0.32
0.06
-0.38
Cheltenham Town (Actual 16th, xG 21st)
Performance by Match
Performance by Formation
Starting Formation
Matches
Pts p90
xPts p90
3-4-2-1
1
3.0
1.0
4-1-4-1
2
2.0
1.8
3-4-1-2
2
2.0
1.8
3-5-2
21
1.7
1.4
4-4-2 (Classic)
14
0.6
1.1
5-3-2
2
0.5
1.0
3-4-3
2
0.5
0.7
4-5-1
1
0.0
0.5
5-4-1
1
0.0
0.7
Performance by Manager
Managerial Record
Matches
Pts p90
Rank
xPts p90
Rank
Gary Johnson
4
0.3
1.4
Russell Milton
3
2.0
1.0
Michael Duff
39
1.3
1.2
Attacking Performance by Player
Player
Apps
Mins
GI
G
A
xG
xGp90
Luke Varney
35
2599
15
14
1
8.9
0.31
Tyrone Barnett
30
1767
9
6
3
4.8
0.25
Chris Hussey
34
2858
8
1
7
2.6
0.08
Conor Thomas
31
2330
7
6
1
5.1
0.20
Alex Addai
21
974
6
0
6
2.6
0.24
Kevin Dawson
32
1997
6
4
2
3.7
0.17
Ryan Broom
39
3024
6
2
4
2.3
0.07
Ben Tozer
36
3043
4
1
3
1.1
0.03
Billy Waters
18
1040
4
4
2.1
0.18
Charlie Raglan
19
1710
4
2
2
0.7
0.04
Overall Performance by Player (P=Playing, NP=Not Playing)
Player
Mins
GD P
GDp90 P
GDp90 NP
Diff
xGD P
xGDp90 P
xGDp90 NP
Diff
Team Average
4140
-11
-0.24
-11.5
-0.25
Scott Flinders
4140
-11
-0.24
-11.5
-0.25
William Boyle
3264
-3
-0.08
-0.82
0.74
-8.2
-0.23
-0.34
0.11
Ben Tozer
3043
-3
-0.09
-0.66
0.57
-7.5
-0.22
-0.33
0.11
Ryan Broom
3024
-12
-0.36
0.08
-0.44
-9.1
-0.27
-0.19
-0.08
Chris Hussey
2858
4
0.13
-1.05
1.18
-4.5
-0.14
-0.49
0.35
Jacob Maddox
2611
-3
-0.10
-0.47
0.37
-6.1
-0.21
-0.32
0.11
Luke Varney
2599
-9
-0.31
-0.12
-0.19
-7.4
-0.26
-0.24
-0.02
Conor Thomas
2330
-3
-0.12
-0.40
0.28
-5.6
-0.22
-0.30
0.08
Chris Clements
2277
-7
-0.28
-0.19
-0.08
-5.4
-0.21
-0.30
0.08
Nigel Atangana
2162
-9
-0.37
-0.09
-0.28
-9.1
-0.38
-0.11
-0.27
Kevin Dawson
1997
1
0.05
-0.50
0.55
-2.2
-0.10
-0.39
0.29
Jordan Forster
1940
-6
-0.28
-0.20
-0.07
-6.5
-0.30
-0.21
-0.10
Tyrone Barnett
1767
-5
-0.25
-0.23
-0.03
-5.3
-0.27
-0.24
-0.03
Charlie Raglan
1710
-2
-0.11
-0.33
0.23
-1.5
-0.08
-0.37
0.29
John Mullins
1539
-12
-0.70
0.03
-0.74
-5.5
-0.32
-0.21
-0.11
Jordan Tillson
1057
-4
-0.34
-0.20
-0.14
-2.4
-0.21
-0.27
0.06
Billy Waters
1040
6
0.52
-0.49
1.01
1.0
0.09
-0.36
0.45
Alex Addai
974
-4
-0.37
-0.20
-0.17
-0.3
-0.02
-0.32
0.30
Colchester United (Actual 8th, xG 4th)
Performance by Match
Performance by Formation
Starting Formation
Matches
Pts p90
xPts p90
4-4-2 (Classic)
1
3.0
2.1
4-3-3
1
3.0
2.3
4-4-1-1
8
2.0
1.6
3-4-3
2
1.5
1.6
4-2-3-1
30
1.5
1.5
3-4-2-1
2
0.5
1.3
3-4-1-2
2
0.0
1.9
Attacking Performance by Player
Player
Apps
Mins
GI
G
A
xG
xGp90
Sammie Szmodics
43
3832
21
14
7
11.5
0.27
Frank Nouble
43
3717
11
9
2
6.4
0.15
Luke Norris
33
1918
11
7
4
8.0
0.38
Harry Pell
31
2628
9
6
3
4.6
0.16
Courtney Senior
42
3150
8
6
2
5.2
0.15
Brennan Dickenson
41
1977
7
3
4
2.2
0.10
Ryan Jackson
46
4084
7
2
5
1.9
0.04
Mikael Mandron
41
1660
5
2
3
4.0
0.21
Frankie Kent
40
3382
4
4
4.8
0.13
Kane Vincent-Young
40
3352
4
3
1
1.2
0.03
Overall Performance by Player (P=Playing, NP=Not Playing)
Player
Mins
GD P
GDp90 P
GDp90 NP
Diff
xGD P
xGDp90 P
xGDp90 NP
Diff
Team Average
4140
12
0.26
13.2
0.29
Ryan Jackson
4084
11
0.24
1.61
-1.36
11.3
0.25
3.05
-2.80
Sammie Szmodics
3832
15
0.35
-0.88
1.23
12.3
0.29
0.25
0.04
Frank Nouble
3717
15
0.36
-0.64
1.00
12.5
0.30
0.15
0.16
Frankie Kent
3382
11
0.29
0.12
0.17
11.2
0.30
0.24
0.06
Kane Vincent-Young
3352
6
0.16
0.69
-0.52
10.5
0.28
0.30
-0.02
Luke Prosser
3319
10
0.27
0.22
0.05
8.0
0.22
0.57
-0.35
Courtney Senior
3150
8
0.23
0.36
-0.14
12.6
0.36
0.05
0.31
Tom Lapslie
2939
10
0.31
0.15
0.16
7.8
0.24
0.40
-0.17
Harry Pell
2628
15
0.51
-0.18
0.69
6.7
0.23
0.39
-0.16
Tom Eastman
2174
4
0.17
0.37
-0.20
11.4
0.47
0.08
0.39
Dillon Barnes
1980
5
0.23
0.29
-0.06
4.3
0.19
0.37
-0.18
Rene Gilmartin
1980
2
0.09
0.42
-0.33
7.6
0.35
0.23
0.11
Brennan Dickenson
1977
14
0.64
-0.08
0.72
7.5
0.34
0.24
0.10
Luke Norris
1918
3
0.14
0.36
-0.22
5.2
0.24
0.32
-0.08
Mikael Mandron
1660
-3
-0.16
0.54
-0.71
7.9
0.43
0.19
0.24
Ben Stevenson
994
-1
-0.09
0.37
-0.46
2.7
0.24
0.30
-0.06
Abobaker Eisa
633
-1
-0.14
0.33
-0.48
0.0
0.00
0.34
-0.34
Brandon Comley
482
1
0.19
0.27
-0.08
-0.4
-0.07
0.33
-0.41
Crawley Town (Actual 19th, xG 17th)
Performance by Match
Performance by Formation
Starting Formation
Matches
Pts p90
xPts p90
4-4-2 (Classic)
25
1.4
1.3
3-5-1-1
4
1.3
1.1
3-5-2
10
1.1
1.2
4-3-3
3
1.0
1.6
4-1-4-1
1
0.0
1.1
5-3-2
1
0.0
0.8
3-3-3-1
1
0.0
1.0
3-4-2-1
1
0.0
1.4
Performance by Manager
Managerial Record
Matches
Pts p90
Rank
xPts p90
Rank
Harry Kewell
5
1.4
13th
1.6
2nd
Filipe Morais
1
0.0
1.1
Gabriele Cioffi
40
1.2
19th
1.2
18th
Attacking Performance by Player
Player
Apps
Mins
GI
G
A
xG
xGp90
Ollie Palmer
40
3474
18
14
4
14.5
0.38
Filipe Morais
34
2711
12
8
4
6.9
0.23
Lewis Young
37
3036
9
1
8
0.9
0.03
Ashley Nathaniel-George
29
1572
8
6
2
2.6
0.15
Dominic Poleon
30
1795
5
5
5.7
0.28
Luke Gambin
26
1800
5
3
2
2.5
0.12
Panutche Camara
44
3167
5
3
2
3.7
0.11
Dannie Bulman
36
2583
4
3
1
1.3
0.04
George Francomb
41
3444
3
0
3
0.9
0.02
Joe Maguire
27
2173
3
1
2
0.4
0.02
Overall Performance by Player (P=Playing, NP=Not Playing)
Player
Mins
GD P
GDp90 P
GDp90 NP
Diff
xGD P
xGDp90 P
xGDp90 NP
Diff
Team Average
4140
-17
-0.37
-6.7
-0.15
Glenn Morris
4140
-17
-0.37
-6.7
-0.15
Ollie Palmer
3474
-19
-0.49
0.27
-0.76
-5.8
-0.15
-0.12
-0.03
George Francomb
3444
-15
-0.39
-0.26
-0.13
-9.0
-0.24
0.30
-0.53
Panutche Camara
3167
-5
-0.14
-1.11
0.97
-2.6
-0.07
-0.38
0.31
Lewis Young
3036
-12
-0.36
-0.41
0.05
-5.4
-0.16
-0.11
-0.05
Filipe Morais
2711
-16
-0.53
-0.06
-0.47
-5.8
-0.19
-0.06
-0.14
Dannie Bulman
2583
-13
-0.45
-0.23
-0.22
-7.9
-0.28
0.07
-0.34
Joe McNerney
2421
-14
-0.52
-0.16
-0.36
-7.2
-0.27
0.03
-0.30
Joe Maguire
2173
-9
-0.37
-0.37
-0.01
-3.8
-0.16
-0.13
-0.02
Josh Payne
2028
-3
-0.13
-0.60
0.46
-2.4
-0.11
-0.18
0.07
Mark Connolly
1994
-6
-0.27
-0.46
0.19
-2.5
-0.11
-0.18
0.06
Luke Gambin
1800
-3
-0.15
-0.54
0.39
-4.5
-0.23
-0.08
-0.14
Dominic Poleon
1795
-9
-0.45
-0.31
-0.14
-3.2
-0.16
-0.14
-0.02
Tom Dallison
1710
-11
-0.58
-0.22
-0.36
-5.3
-0.28
-0.05
-0.23
Ashley Nathaniel-George
1572
-2
-0.11
-0.53
0.41
1.9
0.11
-0.30
0.41
Reece Grego-Cox
1424
-6
-0.38
-0.36
-0.01
0.8
0.05
-0.25
0.30
David Sesay
1408
-5
-0.32
-0.40
0.08
-3.3
-0.21
-0.11
-0.10
Josh Doherty
1164
-1
-0.08
-0.48
0.41
1.9
0.15
-0.26
0.41
Crewe Alexandra (Actual 12th, xG 13th)
Performance by Match
Performance by Formation
Starting Formation
Matches
Pts p90
xPts p90
4-1-3-2
1
3.0
2.1
4-3-3
18
1.8
1.5
4-1-2-1-2 (Diamond Formation)
3
1.3
1.3
4-4-2 (Classic)
23
1.1
1.2
4-5-1
1
0.0
1.3
Attacking Performance by Player
Player
Apps
Mins
GI
G
A
xG
xGp90
Charlie Kirk
42
3354
18
11
7
6.3
0.17
Chris Porter
40
2591
15
13
2
10.9
0.38
Jordan Bowery
43
3203
12
8
4
7.6
0.21
Callum Ainley
43
2935
9
6
3
5.0
0.15
James Jones
38
2898
8
5
3
3.8
0.12
Harry Pickering
33
2780
5
0
5
1.3
0.04
Paul Green
26
2114
5
1
4
3.3
0.14
Perry Ng
44
3960
5
0
5
2.7
0.06
Tom Lowery
14
720
5
1
4
1.5
0.19
Ryan Wintle
46
4109
4
1
3
1.8
0.04
Overall Performance by Player (P=Playing, NP=Not Playing)
Player
Mins
GD P
GDp90 P
GDp90 NP
Diff
xGD P
xGDp90 P
xGDp90 NP
Diff
Team Average
4140
1
0.02
-0.5
-0.01
Ryan Wintle
4109
-1
-0.02
5.81
-5.83
-1.8
-0.04
3.85
-3.89
Perry Ng
3960
-2
-0.05
1.50
-1.55
-1.3
-0.03
0.38
-0.41
Ben Garratt
3420
0
0.00
0.13
-0.13
1.3
0.03
-0.22
0.26
Charlie Kirk
3354
7
0.19
-0.69
0.87
-1.1
-0.03
0.07
-0.10
Jordan Bowery
3203
-3
-0.08
0.38
-0.47
0.4
0.01
-0.08
0.09
Callum Ainley
2935
-1
-0.03
0.15
-0.18
-0.9
-0.03
0.03
-0.05
James Jones
2898
-1
-0.03
0.14
-0.18
-1.9
-0.06
0.10
-0.16
Eddie Nolan
2830
3
0.10
-0.14
0.23
3.5
0.11
-0.27
0.38
Harry Pickering
2780
2
0.06
-0.07
0.13
1.3
0.04
-0.12
0.17
George Ray
2708
-6
-0.20
0.44
-0.64
0.6
0.02
-0.07
0.09
Chris Porter
2591
2
0.07
-0.06
0.13
3.7
0.13
-0.24
0.37
Paul Green
2114
5
0.21
-0.18
0.39
3.8
0.16
-0.19
0.35
Nicky Hunt
1714
13
0.68
-0.45
1.13
-2.8
-0.15
0.08
-0.23
Corey Whelan
1369
-8
-0.53
0.29
-0.82
-3.6
-0.24
0.10
-0.34
Shaun Miller
1303
-3
-0.21
0.13
-0.33
-0.1
-0.01
-0.01
0.01
Tom Lowery
720
2
0.25
-0.03
0.28
-2.2
-0.28
0.04
-0.32
Alex Nicholls
662
-9
-1.22
0.26
-1.48
-5.7
-0.77
0.13
-0.91
Kevin O Connor
450
2
0.40
-0.02
0.42
-1.1
-0.23
0.02
-0.25
Exeter City (Actual 9th, xG 9th)
Performance by Match
Performance by Formation
Starting Formation
Matches
Pts p90
xPts p90
4-4-1-1
7
2.6
1.4
4-5-1
4
1.8
2.1
4-4-2 (Classic)
24
1.4
1.4
4-2-3-1
5
1.4
1.5
4-2-2-2
1
1.0
1.4
3-5-2
3
0.7
0.8
4-3-3
2
0.5
1.0
Attacking Performance by Player
Player
Apps
Mins
GI
G
A
xG
xGp90
Jayden Stockley
25
2194
17
16
1
12.3
0.51
Nicky Law
43
3375
15
10
5
6.5
0.17
Lee Holmes
34
2294
9
3
6
3.6
0.14
Pierce Sweeney
43
3839
8
4
4
4.9
0.11
Hiram Boateng
28
1953
7
1
6
3.1
0.14
Jonathan Forte
27
1479
7
5
2
6.2
0.38
Craig Woodman
32
2443
6
0
6
0.3
0.01
Matt Jay
17
943
5
4
1
2.2
0.21
Ryan Bowman
18
1239
5
5
4.4
0.32
Dean Moxey
38
3361
4
3
1
1.8
0.05
Overall Performance by Player (P=Playing, NP=Not Playing)
Player
Mins
GD P
GDp90 P
GDp90 NP
Diff
xGD P
xGDp90 P
xGDp90 NP
Diff
Team Average
4140
11
0.24
7.9
0.17
Jake Taylor
4140
11
0.24
7.9
0.17
Christy Pym
3870
15
0.35
-1.33
1.68
9.0
0.21
-0.39
0.60
Pierce Sweeney
3839
12
0.28
-0.30
0.58
9.9
0.23
-0.60
0.83
Nicky Law
3375
5
0.13
0.71
-0.57
4.7
0.13
0.37
-0.24
Dean Moxey
3361
14
0.37
-0.35
0.72
6.8
0.18
0.12
0.07
Craig Woodman
2443
8
0.29
0.16
0.14
-0.3
-0.01
0.44
-0.45
Dara O Shea
2340
2
0.08
0.45
-0.37
8.3
0.32
-0.02
0.34
Lee Holmes
2294
11
0.43
0.00
0.43
7.6
0.30
0.01
0.29
Jayden Stockley
2194
8
0.33
0.14
0.19
4.2
0.17
0.17
0.00
Aaron Martin
1991
6
0.27
0.21
0.06
0.3
0.01
0.32
-0.30
Hiram Boateng
1953
13
0.60
-0.08
0.68
4.8
0.22
0.12
0.10
Archie Collins
1941
1
0.05
0.41
-0.36
6.5
0.30
0.05
0.25
Lee Martin
1921
2
0.09
0.37
-0.27
3.5
0.17
0.18
-0.01
Jonathan Forte
1479
11
0.67
0.00
0.67
6.9
0.42
0.03
0.39
Ryan Bowman
1239
3
0.22
0.25
-0.03
1.1
0.08
0.21
-0.13
Kane Wilson
1146
0
0.00
0.33
-0.33
-2.6
-0.21
0.31
-0.52
Jordan Tillson
1059
6
0.51
0.15
0.36
1.4
0.12
0.19
-0.07
Luke Croll
1039
4
0.35
0.20
0.14
1.6
0.14
0.18
-0.05
Forest Green Rovers (Actual 5th, xG 14th)
Performance by Match
Performance by Formation
Starting Formation
Matches
Pts p90
xPts p90
3-4-1-2
2
2.0
1.8
3-5-2
14
1.7
1.5
4-3-3
11
1.6
1.3
4-2-3-1
10
1.6
1.3
4-4-2 (Classic)
2
1.5
1.3
3-5-1-1
6
1.3
1.1
5-3-2
1
1.0
1.0
Attacking Performance by Player
Player
Apps
Mins
GI
G
A
xG
xGp90
Reece Brown
45
3670
22
11
11
6.4
0.16
Christian Doidge
24
2090
16
14
2
8.9
0.38
Joseph Mills
44
3880
11
4
7
2.6
0.06
George C Williams
37
2034
10
7
3
6.8
0.30
Liam Shephard
39
3348
10
5
5
2.3
0.06
Reuben Reid
28
1798
9
7
2
4.3
0.22
Carl Winchester
45
3860
6
3
3
5.0
0.12
Junior Mondal
17
777
6
3
3
1.3
0.15
Dayle Grubb
29
1496
5
3
2
3.5
0.21
Tahvon Campbell
18
900
5
3
2
3.1
0.31
Overall Performance by Player (P=Playing, NP=Not Playing)
Player
Mins
GD P
GDp90 P
GDp90 NP
Diff
xGD P
xGDp90 P
xGDp90 NP
Diff
Team Average
4140
21
0.46
-0.4
-0.01
Joseph Mills
3880
17
0.39
1.38
-0.99
-0.4
-0.01
0.01
-0.01
Carl Winchester
3860
20
0.47
0.32
0.14
1.5
0.03
-0.59
0.62
Reece Brown
3670
23
0.56
-0.38
0.95
3.1
0.08
-0.67
0.75
Gavin Gunning
3437
18
0.47
0.38
0.09
-1.9
-0.05
0.19
-0.24
Farrend Rawson
3410
24
0.63
-0.37
1.00
-2.2
-0.06
0.23
-0.28
Liam Shephard
3348
24
0.65
-0.34
0.99
2.3
0.06
-0.30
0.36
Nathan McGinley
2907
15
0.46
0.44
0.03
-1.0
-0.03
0.05
-0.08
Paul Digby
2752
6
0.20
0.97
-0.78
-0.3
-0.01
0.00
-0.01
Lloyd James
2589
11
0.38
0.58
-0.20
-0.8
-0.03
0.02
-0.05
Christian Doidge
2090
11
0.47
0.44
0.03
0.4
0.02
-0.03
0.05
George C Williams
2034
12
0.53
0.38
0.15
4.5
0.20
-0.21
0.41
Reuben Reid
1798
10
0.50
0.42
0.08
0.5
0.03
-0.03
0.06
Robert Sanchez
1620
8
0.44
0.46
-0.02
1.9
0.11
-0.08
0.19
James Montgomery
1591
9
0.51
0.42
0.09
-1.1
-0.06
0.03
-0.09
Dayle Grubb
1496
0
0.00
0.71
-0.71
-3.8
-0.23
0.12
-0.35
Lewis Ward
1019
4
0.35
0.49
-0.14
-0.3
-0.03
0.00
-0.03
Tahvon Campbell
900
8
0.80
0.36
0.44
0.4
0.04
-0.02
0.06
Junior Mondal
777
7
0.81
0.37
0.44
0.0
0.00
-0.01
0.01
Grimsby Town (Actual 17th, xG 24th)
Performance by Match
Performance by Formation
Starting Formation
Matches
Pts p90
xPts p90
4-4-2 (Classic)
11
2.1
1.4
3-4-1-2
2
2.0
1.4
4-2-3-1
2
1.5
1.3
3-5-2
14
1.1
1.0
4-4-1-1
4
0.8
0.8
4-3-3
10
0.7
0.9
4-5-1
2
0.5
1.0
4-1-4-1
1
0.0
1.3
Attacking Performance by Player
Player
Apps
Mins
GI
G
A
xG
xGp90
Wes Thomas
36
2902
11
11
9.5
0.29
Charles Vernam
35
1878
6
3
3
3.9
0.19
Elliot Embleton
27
2241
5
3
2
3.9
0.16
Jordan Cook
24
1543
5
4
1
2.3
0.14
Harry Davis
35
2908
4
4
2.0
0.06
Luke Hendrie
41
3583
4
2
2
1.6
0.04
Mitch Rose
24
1552
4
3
1
3.0
0.18
Harry Clifton
39
2668
3
2
1
1.8
0.06
Martyn Woolford
35
2158
3
3
2.1
0.09
Alex Whitmore
31
2334
2
1
1
1.0
0.04
Overall Performance by Player (P=Playing, NP=Not Playing)
Player
Mins
GD P
GDp90 P
GDp90 NP
Diff
xGD P
xGDp90 P
xGDp90 NP
Diff
Team Average
4140
-12
-0.26
-22.1
-0.48
James McKeown
3870
-13
-0.30
0.33
-0.64
-19.7
-0.46
-0.81
0.36
Jake Hessenthaler
3613
-14
-0.35
0.34
-0.69
-18.5
-0.46
-0.61
0.15
Luke Hendrie
3583
-9
-0.23
-0.48
0.26
-19.1
-0.48
-0.48
0.00
Harry Davis
2908
-13
-0.40
0.07
-0.48
-11.2
-0.35
-0.80
0.45
Wes Thomas
2902
-6
-0.19
-0.44
0.25
-18.3
-0.57
-0.28
-0.29
Harry Clifton
2668
-5
-0.17
-0.43
0.26
-11.8
-0.40
-0.63
0.23
Danny Collins
2454
-12
-0.44
0.00
-0.44
-12.0
-0.44
-0.54
0.10
Alex Whitmore
2334
0
0.00
-0.60
0.60
-11.7
-0.45
-0.52
0.07
Elliot Embleton
2241
7
0.28
-0.90
1.18
-11.3
-0.45
-0.51
0.06
Martyn Woolford
2158
-8
-0.33
-0.18
-0.15
-15.1
-0.63
-0.32
-0.32
Reece Hall-Johnson
2083
-6
-0.26
-0.26
0.00
-13.7
-0.59
-0.37
-0.23
Charles Vernam
1878
-14
-0.67
0.08
-0.75
-9.2
-0.44
-0.51
0.07
Mitch Rose
1552
-12
-0.70
0.00
-0.70
-13.8
-0.80
-0.29
-0.51
Jordan Cook
1543
-10
-0.58
-0.07
-0.51
-7.3
-0.42
-0.51
0.09
Sebastian Ring
1239
-6
-0.44
-0.19
-0.25
-6.5
-0.47
-0.48
0.01
Ludvig Ohman
1073
-2
-0.17
-0.29
0.13
-5.8
-0.49
-0.48
-0.01
JJ Hooper
960
-1
-0.09
-0.31
0.22
-4.3
-0.40
-0.50
0.10
Harry Cardwell
949
1
0.09
-0.37
0.46
-5.0
-0.48
-0.48
0.00
Lincoln City (Actual 1st, xG 5th)
Performance by Match
Performance by Formation
Starting Formation
Matches
Pts p90
xPts p90
4-2-2-2
1
3.0
1.8
3-4-1-2
1
3.0
0.7
4-5-1
1
3.0
1.9
4-3-3
6
2.5
1.8
4-2-3-1
10
1.8
1.6
4-4-2 (Classic)
22
1.7
1.5
4-4-1-1
5
1.2
1.4
Attacking Performance by Player
Player
Apps
Mins
GI
G
A
xG
xGp90
John Akinde
45
3582
21
15
6
15.6
0.39
Bruno Andrade
42
3315
14
10
4
6.2
0.17
Harry Anderson
43
3405
9
5
4
5.7
0.15
Harry Toffolo
46
4105
9
3
6
1.5
0.03
Shay McCartan
38
2068
9
7
2
5.1
0.22
Lee Frecklington
27
1968
6
3
3
2.6
0.12
Neal Eardley
43
3771
5
2
3
1.1
0.03
Jason Shackell
35
3029
4
4
2.4
0.07
Mark O Hara
17
1196
4
1
3
0.9
0.07
Matt Green
19
359
4
2
2
1.9
0.47
Overall Performance by Player (P=Playing, NP=Not Playing)
Player
Mins
GD P
GDp90 P
GDp90 NP
Diff
xGD P
xGDp90 P
xGDp90 NP
Diff
Team Average
4140
30
0.65
13.3
0.29
Harry Toffolo
4105
30
0.66
0.00
0.66
14.7
0.32
-3.58
3.90
Michael Bostwick
4010
30
0.67
0.00
0.67
12.7
0.28
0.40
-0.12
Neal Eardley
3771
29
0.69
0.24
0.45
12.1
0.29
0.28
0.01
John Akinde
3582
26
0.65
0.65
0.01
12.1
0.30
0.19
0.12
Harry Anderson
3405
24
0.63
0.73
-0.10
14.1
0.37
-0.10
0.48
Bruno Andrade
3315
26
0.71
0.44
0.27
12.4
0.34
0.09
0.24
Thomas Pett
3115
27
0.78
0.26
0.52
11.2
0.32
0.18
0.15
Jason Shackell
3029
25
0.74
0.41
0.34
8.0
0.24
0.42
-0.19
Michael O Connor
2706
18
0.60
0.75
-0.15
10.3
0.34
0.19
0.16
Shay McCartan
2068
20
0.87
0.43
0.44
8.5
0.37
0.21
0.16
Lee Frecklington
1968
20
0.91
0.41
0.50
4.3
0.20
0.37
-0.17
Josh Vickers
1620
6
0.33
0.86
-0.52
2.4
0.13
0.39
-0.26
Grant Smith
1440
14
0.88
0.53
0.34
4.5
0.28
0.29
-0.01
Mark O Hara
1196
2
0.15
0.86
-0.71
2.9
0.22
0.32
-0.10
Cian Bolger
1153
5
0.39
0.75
-0.36
4.0
0.31
0.28
0.03
Danny M. Rowe
1132
5
0.40
0.75
-0.35
3.6
0.29
0.29
0.00
Matthew Gilks
1080
10
0.83
0.59
0.25
6.4
0.53
0.20
0.33
Matt Rhead
888
2
0.20
0.77
-0.57
1.4
0.14
0.33
-0.19
Macclesfield Town (Actual 22nd, xG 23rd)
Performance by Match
Performance by Formation
Starting Formation
Matches
Pts p90
xPts p90
3-5-1-1
1
3.0
0.7
4-5-1
1
3.0
1.6
4-3-1-2
2
2.0
1.6
5-3-2
3
1.3
1.3
3-5-2
5
1.2
1.2
3-4-3
1
1.0
1.6
4-4-2 (Classic)
13
1.0
1.1
4-2-3-1
7
0.7
1.2
4-3-3
10
0.5
1.0
4-4-1-1
2
0.0
1.2
3-4-1-2
1
0.0
0.7
Performance by Manager
Managerial Record
Matches
Pts p90
Rank
xPts p90
Rank
Mark Yates
12
0.3
24th
1.1
24th
Danny Whitaker
8
1.1
20th
1.3
16th
Sol Campbell
26
1.2
18th
1.1
24th
Attacking Performance by Player
Player
Apps
Mins
GI
G
A
xG
xGp90
Scott Wilson
32
1875
11
10
1
5.9
0.28
Harry Smith
39
2867
10
8
2
7.5
0.24
Michael Rose
40
3427
10
5
5
4.5
0.12
Elliott Durrell
17
1427
6
4
2
3.8
0.24
Ben Stephens
22
1520
5
1
4
2.6
0.16
David Fitzpatrick
40
3581
5
3
2
1.9
0.05
Koby Arthur
20
1344
5
3
2
1.6
0.10
Callum Maycock
27
1917
3
0
3
0.5
0.02
Danny Whitaker
21
1500
3
3
3.1
0.18
Nathan Cameron
25
2250
3
2
1
1.1
0.04
Overall Performance by Player (P=Playing, NP=Not Playing)
Player
Mins
GD P
GDp90 P
GDp90 NP
Diff
xGD P
xGDp90 P
xGDp90 NP
Diff
Team Average
4140
-26
-0.57
-17.3
-0.38
Fiacre Kelleher
3701
-18
-0.44
-1.64
1.20
-14.8
-0.36
-0.52
0.16
David Fitzpatrick
3581
-25
-0.63
-0.16
-0.47
-14.0
-0.35
-0.53
0.18
Michael Rose
3427
-18
-0.47
-1.01
0.54
-12.5
-0.33
-0.61
0.29
Kieran O Hara
3330
-11
-0.30
-1.67
1.37
-13.4
-0.36
-0.43
0.07
Harry Smith
2867
-8
-0.25
-1.27
1.02
-8.1
-0.26
-0.65
0.39
Nathan Cameron
2250
-5
-0.20
-1.00
0.80
-9.1
-0.36
-0.39
0.03
Callum Maycock
1917
-18
-0.85
-0.32
-0.52
-12.4
-0.58
-0.20
-0.38
Scott Wilson
1875
-11
-0.53
-0.60
0.07
-8.9
-0.43
-0.33
-0.09
James Pearson
1753
-7
-0.36
-0.72
0.36
-5.9
-0.30
-0.43
0.12
Tyrone Marsh
1652
-9
-0.49
-0.61
0.12
-8.8
-0.48
-0.31
-0.17
Ben Stephens
1520
-6
-0.36
-0.69
0.33
-3.1
-0.18
-0.49
0.30
Danny Whitaker
1500
-11
-0.66
-0.51
-0.15
-5.2
-0.31
-0.41
0.10
Elliott Durrell
1427
-2
-0.13
-0.80
0.67
-4.3
-0.27
-0.43
0.16
Jared Hodgkiss
1423
-14
-0.89
-0.40
-0.49
-9.4
-0.59
-0.26
-0.33
Koby Arthur
1344
-5
-0.33
-0.68
0.34
-8.7
-0.59
-0.28
-0.31
Miles Welch-Hayes
1314
-9
-0.62
-0.54
-0.08
-7.5
-0.51
-0.31
-0.20
Jamie Grimes
1170
-16
-1.23
-0.30
-0.93
-5.3
-0.41
-0.37
-0.04
Zak Jules
1151
-1
-0.08
-0.75
0.67
-3.8
-0.30
-0.41
0.11
Mansfield Town (Actual 4th, xG 2nd)
Performance by Match
Performance by Formation
Starting Formation
Matches
Pts p90
xPts p90
5-3-2
1
3.0
2.3
3-4-2-1
2
2.0
1.5
3-4-3
4
2.0
1.4
3-5-2
30
1.6
1.6
3-5-1-1
2
1.5
1.3
3-4-1-2
7
1.4
1.6
Attacking Performance by Player
Player
Apps
Mins
GI
G
A
xG
xGp90
Tyler Walker
44
3753
25
22
3
18.8
0.45
Christopher Hamilton
45
4042
15
11
4
7.3
0.16
Jacob Mellis
40
3033
10
3
7
3.5
0.10
Danny Rose
34
1601
7
4
3
6.5
0.37
Malvind Benning
45
3817
7
3
4
2.7
0.06
Jorge Grant
17
1260
6
4
2
2.5
0.18
Otis Khan
22
1238
6
2
4
2.3
0.16
Krystian Pearce
46
4140
4
4
3.8
0.08
Matt Preston
39
3312
4
3
1
1.9
0.05
Neal Bishop
44
3784
4
3
1
2.2
0.05
Overall Performance by Player (P=Playing, NP=Not Playing)
Player
Mins
GD P
GDp90 P
GDp90 NP
Diff
xGD P
xGDp90 P
xGDp90 NP
Diff
Team Average
4140
28
0.61
16.8
0.37
Krystian Pearce
4140
28
0.61
16.8
0.37
Christopher Hamilton
4042
27
0.60
0.92
-0.32
16.8
0.38
-0.04
0.41
Malvind Benning
3817
25
0.59
0.84
-0.25
12.1
0.28
1.32
-1.04
Neal Bishop
3784
24
0.57
1.01
-0.44
15.2
0.36
0.40
-0.04
Tyler Walker
3753
26
0.62
0.47
0.16
16.5
0.39
0.08
0.31
Matt Preston
3312
23
0.63
0.54
0.08
16.7
0.45
0.02
0.44
Ryan Sweeney
3226
17
0.47
1.08
-0.61
15.4
0.43
0.14
0.29
Jacob Mellis
3033
19
0.56
0.73
-0.17
12.4
0.37
0.36
0.01
Hayden White
1795
14
0.70
0.54
0.16
6.2
0.31
0.41
-0.10
Danny Rose
1601
16
0.90
0.43
0.47
8.4
0.47
0.30
0.18
Conrad Logan
1530
11
0.65
0.59
0.06
2.4
0.14
0.50
-0.36
Robert Olejnik
1530
12
0.71
0.55
0.15
10.8
0.64
0.21
0.43
Alexander MacDonald
1301
6
0.42
0.70
-0.28
2.5
0.17
0.45
-0.28
Jorge Grant
1260
8
0.57
0.63
-0.05
4.8
0.35
0.37
-0.03
Otis Khan
1238
9
0.65
0.59
0.07
8.7
0.63
0.25
0.38
Jordan Smith
1080
5
0.42
0.68
-0.26
3.6
0.30
0.39
-0.09
Gethin Jones
1005
8
0.72
0.57
0.14
2.1
0.19
0.42
-0.23
Timi Max Elsnik
1004
9
0.81
0.55
0.26
8.2
0.73
0.25
0.48
MK Dons (Actual 3rd, xG 6th)
Performance by Match
Performance by Formation
Starting Formation
Matches
Pts p90
xPts p90
3-4-2-1
1
3.0
0.8
5-3-2
4
2.5
1.4
3-4-3
14
2.1
1.7
3-4-1-2
2
2.0
1.4
4-3-3
12
1.7
1.6
4-2-3-1
2
1.5
1.1
3-5-2
10
0.9
1.4
3-5-1-1
1
0.0
0.8
Attacking Performance by Player
Player
Apps
Mins
GI
G
A
xG
xGp90
Kieran Agard
42
3288
23
20
3
15.3
0.42
Chuks Aneke
38
2556
19
17
2
15.0
0.53
Rhys Healey
19
1435
11
8
3
6.4
0.40
Dean Lewington
46
4115
10
1
9
1.0
0.02
Alex Gilbey
39
3236
9
3
6
5.4
0.15
David Wheeler
18
987
5
4
1
4.3
0.39
George B Williams
31
2489
5
0
5
1.4
0.05
Jake Hesketh
16
1125
5
2
3
2.8
0.22
Jordan Houghton
44
3541
5
2
3
0.7
0.02
Ryan Watson
20
1191
4
0
4
1.6
0.12
Overall Performance by Player (P=Playing, NP=Not Playing)
Another action packed Championship season draws to a close. Norwich City, Sheffield United and one other will playing Premier League football season, whereas at the other end Bolton Wanderers, Ipswich Town and Rotherham United faced the dreaded relegation into the third tier of English football.
Here’s my review of the season utilising everybody’s favourite football analytical metric – Expected Goals (or xG).
NOTE: For those not familiar with xG this is a metric to monitor the quality of goalscoring chances. A value between 0 and 1 is assigned based on the probability the chance will result in a goal. A 1 in 20 long range shot with have a probability of 5% (an xG of 0.05) whereas a penalty has a 3 in 4 expectancy and therefore an xG of 0.75.
League Table
Over the course of the season my xG model has aligned very closely to the actual table. The top three are consistent across both albeit I rate Leeds United as the strongest team in the league. It’s hard to argue Sheffield United (xG ranked 2nd) and Norwich City (3rd) haven’t deserved automatic promotion with their contrasting styles though.
West Bromwich Albion (4th) and Aston Villa (5th) are worthy of their play off spots, however Derby County (15th) appear to have been fortunate.
At the bottom it suggests Millwall (7th) should have been one place outside of the playoffs rather than relegation. The bottom three of Rotherham United (21st), Bolton Wanderers (22nd) and Ipswich Town (24th) all performed poorly with Reading (23rd) fortunate to survive.
It’s worth noting Rotherham United look considerably better on my xG model than the other two and they would be my pick to perform best next season at this early stage albeit both Bolton and Ipswich are likely to have greater budgets in the summer.
Team
GF
GA
GD
Pts
xGF
xGA
xGD
xPts
Rank
1
Norwich City
93
57
36
94
76
59
17
72.3
3
2
Sheffield United
78
41
37
89
75
46
29
78.6
2
3
Leeds United
73
50
23
83
80
43
37
82.2
1
4
West Bromwich Albion
87
62
25
80
76
63
13
69.2
4
5
Aston Villa
82
61
21
76
75
62
13
69.2
5
6
Derby County
69
54
15
74
59
65
-6
61.0
15
7
Middlesbrough
49
41
8
73
68
63
5
66.4
9
8
Bristol City
59
53
6
70
64
61
3
65.2
11
9
Nottingham Forest
61
54
7
66
59
67
-8
60.4
16
10
Swansea City
65
62
3
65
69
60
9
66.5
8
11
Brentford
73
59
14
64
66
52
14
68.8
6
12
Sheffield Wednesday
60
62
-2
64
58
65
-7
59.2
19
13
Hull City
66
68
-2
62
59
69
-10
56.6
20
14
Preston North End
67
67
0
61
62
65
-3
59.5
12
15
Blackburn Rovers
64
69
-5
60
67
68
-1
63.0
18
16
Stoke City
45
52
-7
55
52
58
-6
60.2
13
17
Birmingham City
64
58
6
52
60
59
1
64.1
17
18
Wigan Athletic
51
64
-13
52
68
69
0
62.2
14
19
Queens Park Rangers
53
71
-18
51
64
62
1
65.4
10
20
Reading
49
66
-17
47
49
85
-36
44.6
23
21
Millwall
48
64
-16
44
69
58
10
67.7
7
22
Rotherham United
52
83
-31
40
64
78
-13
55.5
21
23
Bolton Wanderers
29
78
-49
32
44
68
-24
46.8
22
24
Ipswich Town
36
77
-41
31
46
83
-37
44.2
24
The remainder of the article is a club-by-club review focusing on five areas:
Performance by Match – A graphical representation of the xG created and conceded by match day. Useful to highlight sections of the season the team performed particularly well/poor. The colour coding at the top indicating the actual match result.
Performance by Formation – A table to show actual and expected points based on the starting formation used. Useful context to see teams which have a distinct set up and which teams tinkered regularly during the season.
Performance by Manager – A table to show actual and expected points by manager for those teams who made a change during the season.
Attacking Performance by Player – A table to show actual and expected goal involvement by player.
Overall Performance by Player – A new concept to me which attempts to demonstrate the influence a player has to the team by assessing the actual and expected performance when the player featured and when the player was absent.
Aston Villa (Actual 5th, xG 5th)
Performance by Match
Performance by Formation
Starting Formation
Matches
Pts p90
xPts p90
4-3-3
9
1.9
1.8
4-4-1-1
9
1.8
1.6
4-1-4-1
17
1.6
1.4
Unknown
6
1.5
1.2
4-4-2 (Classic)
3
1.3
1.7
4-2-3-1
2
1.0
1.1
Performance by Manager
Dean Smith had the exact impact the Villa fans would have hoped for. Still would have fallen just short if Smith had been in charge for the whole season.
Managerial Record
Matches
Pts p90
Rank
xPts p90
Rank
Steve Bruce
11
1.4
13th
1.3
18th
Kevin MacDonald
1
0.0
0.7
Dean Smith
34
1.8
4th
1.6
3rd
Attacking Performance by Player
Player
Apps
Mins
GI
G
A
xG
xA
xGp90
xAp90
Tammy Abraham
37
3150
28
25
3
20.9
2.5
0.60
0.07
Conor Hourihane
43
3084
18
7
11
6.3
10.1
0.18
0.29
John McGinn
40
3464
15
6
9
6.9
6.9
0.18
0.18
Jack Grealish
31
2698
12
6
6
4.7
6.1
0.16
0.20
Anwar El Ghazi
31
2183
11
5
6
4.9
5.6
0.20
0.23
Jonathan Kodjia
39
2021
11
9
2
7.7
2.2
0.34
0.10
Ahmed Elmohamady
38
2945
9
2
7
1.8
4.5
0.05
0.14
Albert Adomah
35
1861
6
4
2
3.8
4.0
0.19
0.20
Yannick Bolasie
21
953
6
2
4
2.6
3.2
0.24
0.30
James Chester
28
2520
5
5
0
2.8
0.1
0.10
0.00
Overall Performance by Player (P=Playing, NP=Not Playing)
Those who have doubts over Jack Grealish appear unfounded. Villa had a Goal Difference per 90 mins (GDp90 P) of 0.90 when he was on the pitch compared to -0.37 without him (GDp90 NP) for an actual difference of 1.28.
Tammy Abraham another one with a strong impact, 0.72 actual difference and 0.57 xGD difference, and will hopefully get a shot in the Premier League next season.
Player
Mins
GD P
GDp90 P
GDp90 NP
Diff
xGD P
xGDp90 P
xGDp90 NP
Diff
Team Average
4140
21
0.46
12.9
0.28
John McGinn
3464
15
0.39
0.80
-0.41
10.1
0.26
0.37
-0.11
Tammy Abraham
3150
22
0.63
-0.09
0.72
14.6
0.42
-0.16
0.57
Conor Hourihane
3084
18
0.53
0.26
0.27
9.4
0.27
0.30
-0.02
Ahmed Elmohamady
2945
18
0.55
0.23
0.32
8.9
0.27
0.31
-0.03
Alan Hutton
2874
2
0.06
1.35
-1.29
3.2
0.10
0.69
-0.59
Jack Grealish
2698
27
0.90
-0.37
1.28
12.6
0.42
0.02
0.40
James Chester
2520
8
0.29
0.72
-0.44
7.9
0.28
0.28
0.00
Neil Taylor
2473
18
0.66
0.16
0.49
12.5
0.46
0.02
0.43
Anwar El Ghazi
2183
15
0.62
0.28
0.34
9.6
0.40
0.15
0.25
Axel Tuanzebe
2096
9
0.39
0.53
-0.14
7.1
0.31
0.25
0.05
vòrjan Nyland
2070
7
0.30
0.61
-0.30
5.2
0.23
0.34
-0.11
Glenn Whelan
2054
10
0.44
0.47
-0.04
8.5
0.37
0.19
0.18
Jonathan Kodjia
2021
4
0.18
0.72
-0.54
1.8
0.08
0.47
-0.39
Albert Adomah
1861
15
0.73
0.24
0.49
11.0
0.53
0.08
0.45
Jed Steer
1395
19
1.23
0.07
1.16
9.7
0.62
0.11
0.52
Tyrone Mings
1350
14
0.93
0.23
0.71
4.3
0.29
0.28
0.01
Mile Jedinak
1129
-1
-0.08
0.66
-0.74
2.8
0.22
0.30
-0.08
Yannick Bolasie
953
6
0.57
0.42
0.14
3.6
0.34
0.26
0.08
Birmingham City (Actual 17th, xG 12th)
Performance by Match
Performance by Formation
Starting Formation
Matches
Pts p90
xPts p90
4-4-2 (Classic)
40
1.4
1.4
Unknown
6
0.7
1.3
Attacking Performance by Player
Player
Apps
Mins
GI
G
A
xG
xA
xGp90
xAp90
Che Adams
46
3740
26
22
4
14.7
6.5
0.35
0.16
Lukas Jutkiewicz
46
3824
24
14
10
14.2
5.9
0.33
0.14
Jota
40
2874
14
3
11
4.4
8.2
0.14
0.26
Jacques Maghoma
41
3024
11
6
5
4.7
4.3
0.14
0.13
Michael Morrison
43
3831
8
7
1
4.3
1.3
0.10
0.03
Connor Mahoney
29
1501
6
2
4
1.9
4.0
0.11
0.24
Gary Gardner
40
3258
5
2
3
4.4
1.7
0.12
0.05
Kristian Pedersen
39
3494
3
1
2
0.4
1.3
0.01
0.03
Maikel Kieftenbeld
36
2944
3
1
2
0.9
0.9
0.03
0.03
Craig Gardner
21
738
2
1
1
1.8
0.9
0.22
0.11
Overall Performance by Player (P=Playing, NP=Not Playing)
A small concentration of players have played the majority of the minutes. Lee Camp and Lukas Jutkiewicz the stand out performers for both actual and xGD difference.
Player
Mins
GD P
GDp90 P
GDp90 NP
Diff
xGD P
xGDp90 P
xGDp90 NP
Diff
Team Average
4140
6
0.13
1.4
0.03
Lee Camp
3960
7
0.16
-0.50
0.66
2.9
0.07
-0.74
0.80
Harlee Dean
3883
4
0.09
0.70
-0.61
1.0
0.02
0.14
-0.11
Michael Morrison
3831
7
0.16
-0.29
0.46
0.5
0.01
0.25
-0.24
Lukas Jutkiewicz
3824
9
0.21
-0.85
1.07
2.9
0.07
-0.44
0.51
Maxime Colin
3793
11
0.26
-1.30
1.56
1.7
0.04
-0.08
0.12
Che Adams
3740
4
0.10
0.45
-0.35
1.7
0.04
-0.08
0.12
Kristian Pedersen
3494
-2
-0.05
1.11
-1.17
1.6
0.04
-0.03
0.07
Gary Gardner
3258
8
0.22
-0.20
0.43
2.6
0.07
-0.12
0.19
Jacques Maghoma
3024
11
0.33
-0.40
0.73
2.4
0.07
-0.08
0.15
Maikel Kieftenbeld
2944
7
0.21
-0.08
0.29
-2.6
-0.08
0.30
-0.38
Jota
2874
11
0.34
-0.36
0.70
1.8
0.06
-0.03
0.09
Wes Harding
1534
5
0.29
0.03
0.26
-1.5
-0.09
0.10
-0.19
Connor Mahoney
1501
-2
-0.12
0.27
-0.39
0.8
0.05
0.02
0.03
Craig Gardner
738
-1
-0.12
0.19
-0.31
0.0
0.00
0.04
-0.04
David Davis
688
-1
-0.13
0.18
-0.31
2.8
0.37
-0.04
0.41
Kerim Mrabti
620
-4
-0.58
0.26
-0.84
1.1
0.16
0.01
0.16
Charlie Lakin
437
0
0.00
0.15
-0.15
-0.6
-0.12
0.05
-0.17
Omar Bogle
359
0
0.00
0.14
-0.14
0.7
0.18
0.02
0.16
Blackburn Rovers (Actual 15th, xG 18th)
Performance by Match
Performance by Formation
Starting Formation
Matches
Pts p90
xPts p90
3-4-3
2
1.5
1.7
Unknown
6
1.5
1.7
4-2-3-1
35
1.4
1.3
3-4-1-2
1
0.0
1.9
4-4-1-1
1
0.0
1.8
4-3-3
1
0.0
1.8
Attacking Performance by Player
Player
Apps
Mins
GI
G
A
xG
xA
xGp90
xAp90
Bradley Dack
42
3454
22
15
7
18.2
5.2
0.47
0.13
Danny Graham
43
3030
19
15
4
10.6
4.1
0.31
0.12
Charlie Mulgrew
29
2383
10
10
0
5.5
1.0
0.21
0.04
Adam Armstrong
43
2853
8
5
3
6.2
4.7
0.20
0.15
Harrison Reed
32
2407
8
3
5
2.7
4.2
0.10
0.16
Amari i Bell
38
3204
4
3
1
1.7
1.6
0.05
0.05
Elliott Bennett
40
3402
4
1
3
2.0
3.7
0.05
0.10
Joe Rothwell
33
1542
4
2
2
3.6
2.7
0.21
0.15
Ben Brereton
24
677
2
1
1
1.7
1.0
0.23
0.14
Craig Conway
21
946
2
1
1
1.1
3.1
0.10
0.29
Overall Performance by Player (P=Playing, NP=Not Playing)
Danny Graham has been the standout performer for Rovers this season. Blackburn have an actual Goal Difference per 90 mins of 0.21 (GDp90 P) when he’s played and -0.97 without him (GDp90 NP).
Darragh Lenihan is another one who has had a good season and has been missed when he’s not played based on both actual and xG performances. At 25 he still has the potential to improve further.
Player
Mins
GD P
GDp90 P
GDp90 NP
Diff
xGD P
xGDp90 P
xGDp90 NP
Diff
Team Average
4140
-5
-0.11
-1.0
-0.02
David Raya Martin
3682
-8
-0.20
0.59
-0.79
-0.3
-0.01
-0.13
0.12
Bradley Dack
3454
2
0.05
-0.92
0.97
-2.3
-0.06
0.17
-0.23
Elliott Bennett
3402
-5
-0.13
0.00
-0.13
3.5
0.09
-0.55
0.64
Amari i Bell
3204
1
0.03
-0.58
0.61
-1.9
-0.05
0.09
-0.14
Danny Graham
3030
7
0.21
-0.97
1.18
5.8
0.17
-0.55
0.72
Darragh Lenihan
2982
1
0.03
-0.47
0.50
2.1
0.06
-0.24
0.31
Adam Armstrong
2853
-6
-0.19
0.07
-0.26
-3.7
-0.12
0.19
-0.31
Corry Evans
2679
1
0.03
-0.37
0.40
0.8
0.03
-0.11
0.14
Harrison Reed
2407
-4
-0.15
-0.05
-0.10
-4.9
-0.18
0.20
-0.38
Charlie Mulgrew
2383
-16
-0.60
0.56
-1.17
-3.4
-0.13
0.12
-0.25
Ryan Nyambe
2312
-3
-0.12
-0.10
-0.02
2.4
0.10
-0.17
0.27
Richard Smallwood
2254
-17
-0.68
0.57
-1.25
-8.3
-0.33
0.35
-0.68
Derrick Williams
2222
-3
-0.12
-0.09
-0.03
-4.0
-0.16
0.14
-0.30
Lewis Travis
1775
6
0.30
-0.42
0.72
1.1
0.06
-0.08
0.14
Joe Rothwell
1542
-3
-0.18
-0.07
-0.11
0.9
0.05
-0.07
0.12
Jack Rodwell
1440
-2
-0.13
-0.10
-0.03
-2.0
-0.12
0.03
-0.16
Craig Conway
946
2
0.19
-0.20
0.39
0.4
0.04
-0.04
0.07
Kasey Palmer
775
-1
-0.12
-0.11
-0.01
0.4
0.05
-0.04
0.09
Bolton Wanderers (Actual 23rd, xG 22nd)
Performance by Match
Performance by Formation
Starting Formation
Matches
Pts p90
xPts p90
Unknown
6
1.8
1.3
3-5-2
1
1.0
1.1
4-4-2 (Classic)
4
0.8
1.0
4-4-1-1
8
0.8
1.0
5-3-2
4
0.8
0.8
4-2-3-1
14
0.4
1.0
4-1-4-1
5
0.4
0.9
3-4-1-2
1
0.0
1.6
3-5-1-1
1
0.0
1.3
4-5-1
1
0.0
0.8
Attacking Performance by Player
Player
Apps
Mins
GI
G
A
xG
xA
xGp90
xAp90
Sammy Ameobi
30
2339
7
4
3
4.0
3.6
0.15
0.14
William Buckley
32
1841
6
4
2
4.2
1.6
0.21
0.08
Josh Magennis
42
2722
5
4
1
7.5
2.4
0.25
0.08
Pawel Olkowski
37
3099
5
2
3
1.2
2.0
0.03
0.06
Callum Connolly
16
1358
4
2
2
1.8
0.8
0.12
0.05
Gary O Neil
29
2047
4
3
1
1.5
4.0
0.06
0.18
Mark Beevers
32
2765
3
3
0
2.1
0.6
0.07
0.02
Clayton Donaldson
30
1592
2
1
1
3.7
0.5
0.21
0.03
Craig Noone
35
2226
2
1
1
2.6
3.3
0.11
0.13
David Wheater
33
2880
2
0
2
3.0
1.2
0.09
0.04
Overall Performance by Player (P=Playing, NP=Not Playing)
In a poor season, Josh Magennis has been a positive with the team performing better with him on the pitch. He’s scored 10 goals in both of his League One seasons and will be key to any success next year.
22 year old Joe Williams also catches the eye following his loan spell from Everton. It’ll be interesting to see who takes him next season but he appears to be capable at Championship level.
Player
Mins
GD P
GDp90 P
GDp90 NP
Diff
xGD P
xGDp90 P
xGDp90 NP
Diff
Team Average
4050
-48
-1.07
-24.2
-0.54
Pawel Olkowski
3099
-29
-0.84
-1.80
0.96
-16.8
-0.49
-0.70
0.22
Jason Lowe
3017
-33
-0.98
-1.31
0.32
-17.3
-0.51
-0.60
0.09
David Wheater
2880
-31
-0.97
-1.31
0.34
-18.5
-0.58
-0.43
-0.14
Mark Beevers
2765
-33
-1.07
-1.05
-0.02
-16.2
-0.53
-0.56
0.03
Josh Magennis
2722
-22
-0.73
-1.76
1.03
-12.4
-0.41
-0.80
0.39
Joe Williams
2527
-29
-1.03
-1.12
0.09
-12.1
-0.43
-0.72
0.29
Ben Alnwick
2430
-26
-0.96
-1.22
0.26
-11.7
-0.43
-0.70
0.26
Sammy Ameobi
2339
-30
-1.15
-0.95
-0.21
-15.0
-0.58
-0.48
-0.10
Andrew Taylor
2252
-21
-0.84
-1.35
0.51
-10.2
-0.41
-0.70
0.30
Craig Noone
2226
-29
-1.17
-0.94
-0.24
-14.2
-0.57
-0.49
-0.08
Jack Hobbs
2117
-28
-1.19
-0.93
-0.26
-11.4
-0.48
-0.60
0.11
Gary O Neil
2047
-27
-1.19
-0.94
-0.24
-14.2
-0.63
-0.45
-0.18
William Buckley
1841
-17
-0.83
-1.26
0.43
-12.0
-0.59
-0.50
-0.09
Remi Matthews
1620
-22
-1.22
-0.96
-0.26
-12.5
-0.70
-0.43
-0.26
Clayton Donaldson
1592
-25
-1.41
-0.84
-0.57
-11.7
-0.66
-0.46
-0.20
Callum Connolly
1358
-22
-1.46
-0.87
-0.59
-10.4
-0.69
-0.46
-0.23
Marc Wilson
1233
-13
-0.95
-1.12
0.17
-6.8
-0.50
-0.56
0.06
Josh Vela
1147
-17
-1.33
-0.96
-0.37
-7.4
-0.58
-0.52
-0.06
Brentford (Actual 11th, xG 6th)
Performance by Match
Performance by Formation
Starting Formation
Matches
Pts p90
xPts p90
5-4-1
1
3.0
1.3
Unknown
6
1.8
1.8
3-4-3
20
1.7
1.7
3-4-2-1
2
1.5
1.5
4-1-4-1
1
1.0
0.5
4-2-3-1
15
0.7
1.3
Performance by Manager
Both actual and xG performances dropped following Dean Smith’s departure. The club still remains in capable hands with Thomas Frank though.
Managerial Record
Matches
Pts p90
Rank
xPts p90
Rank
Dean Smith
12
1.5
9th
1.6
3rd
Thomas Frank
34
1.4
13th
1.5
7th
Attacking Performance by Player
Player
Apps
Mins
GI
G
A
xG
xA
xGp90
xAp90
Neal Maupay
43
3713
33
25
8
23.6
4.8
0.57
0.12
Said Benrahma
36
2287
24
10
14
8.2
9.4
0.32
0.37
Ollie Watkins
41
3126
16
10
6
9.0
6.5
0.26
0.19
Sergi Canos
44
2195
14
7
7
6.6
4.1
0.27
0.17
Romaine Sawyers
42
3642
6
0
6
2.0
4.7
0.05
0.12
Kamohelo Mokotjo
35
2293
5
3
2
1.1
1.7
0.04
0.07
Henrik Dalsgaard
40
3572
4
2
2
2.0
4.9
0.05
0.12
Lewis MacLeod
17
975
4
3
1
2.0
2.3
0.18
0.21
Rico Henry
14
1074
3
1
2
0.9
1.0
0.07
0.08
Emiliano Marcondes
13
449
2
0
2
0.9
0.5
0.18
0.10
Overall Performance by Player (P=Playing, NP=Not Playing)
A number of players with positive seasons for the Bees. Ollie Watkins has always impressed me when I’ve watched him play and the numbers back up the eye. Brentford have an actual Goal Difference per 90 mins of 0.40 (GDp90 P) with him and -0.10 without him (GDp90 NP) for a 0.50 difference. Based on xG performance the difference is even grater at 0.80.
Player
Mins
GD P
GDp90 P
GDp90 NP
Diff
xGD P
xGDp90 P
xGDp90 NP
Diff
Team Average
4050
13
0.29
13.9
0.31
Ezri Konsa Ngoyo
3752
14
0.34
-0.30
0.64
12.4
0.30
0.46
-0.16
Neal Maupay
3713
14
0.34
-0.27
0.61
12.9
0.31
0.27
0.04
Romaine Sawyers
3642
10
0.25
0.66
-0.41
12.2
0.30
0.38
-0.08
Henrik Dalsgaard
3572
7
0.18
1.13
-0.95
9.8
0.25
0.78
-0.54
Ollie Watkins
3126
14
0.40
-0.10
0.50
17.1
0.49
-0.31
0.80
Daniel Bentley
2955
13
0.40
0.00
0.40
12.1
0.37
0.15
0.22
Yoann Barbet
2693
11
0.37
0.13
0.23
14.8
0.50
-0.06
0.56
Kamohelo Mokotjo
2293
7
0.27
0.31
-0.03
8.9
0.35
0.26
0.09
Said Benrahma
2287
9
0.35
0.20
0.15
15.2
0.60
-0.06
0.66
Sergi Canos
2195
9
0.37
0.19
0.17
7.6
0.31
0.31
0.00
Moses Odubajo
2175
11
0.46
0.10
0.36
7.4
0.31
0.31
-0.01
Julian Jeanvier
2098
7
0.30
0.28
0.02
9.9
0.42
0.19
0.23
Chris Mepham
1943
1
0.05
0.51
-0.47
3.2
0.15
0.46
-0.31
Josh McEachran
1487
-3
-0.18
0.56
-0.74
-1.1
-0.06
0.53
-0.59
Luke Daniels
1080
0
0.00
0.39
-0.39
1.7
0.15
0.37
-0.22
Rico Henry
1074
8
0.67
0.15
0.52
3.6
0.30
0.31
-0.01
Lewis MacLeod
975
5
0.46
0.23
0.23
4.5
0.42
0.28
0.14
Nico Yennaris
897
-7
-0.70
0.57
-1.27
-0.1
-0.01
0.40
-0.41
Bristol City (Actual 8th, xG 11th)
Performance by Match
Performance by Formation
Starting Formation
Matches
Pts p90
xPts p90
4-1-4-1
14
1.9
1.4
Unknown
6
1.8
1.5
3-5-2
3
1.7
1.2
3-4-2-1
2
1.5
1.4
4-2-3-1
7
1.6
1.6
5-3-2
3
1.0
1.4
4-4-2 (Classic)
11
1.0
1.4
Attacking Performance by Player
Player
Apps
Mins
GI
G
A
xG
xA
xGp90
xAp90
Andreas Weimann
44
3348
15
10
5
8.6
4.5
0.23
0.12
Famara Diedhiou
40
3102
15
13
2
15.8
3.1
0.46
0.09
Jamie Paterson
41
2654
9
5
4
5.0
5.2
0.17
0.17
Josh Brownhill
45
4013
9
5
4
7.1
3.7
0.16
0.08
Matty Taylor
33
1200
9
4
5
3.4
2.8
0.26
0.21
Callum O Dowda
31
1801
8
4
4
3.1
3.4
0.16
0.17
Niclas Eliasson
33
1972
8
2
6
3.0
6.2
0.14
0.28
Jack Hunt
33
2713
6
1
5
0.5
2.6
0.02
0.09
Marlon Pack
46
4098
5
2
3
3.5
3.5
0.08
0.08
Adam Webster
44
3747
3
3
0
3.8
1.7
0.09
0.04
Overall Performance by Player (P=Playing, NP=Not Playing)
A mixed bag with Niclas Eliasson and Matty Taylor the two for have improved both actual and xG performance during their limited minutes. Both appear to be deserving of more time on the field.
Player
Mins
GD P
GDp90 P
GDp90 NP
Diff
xGD P
xGDp90 P
xGDp90 NP
Diff
Team Average
4140
6
0.13
3.5
0.08
Marlon Pack
4098
4
0.09
4.29
-4.20
2.3
0.05
2.48
-2.43
Josh Brownhill
4013
4
0.09
1.42
-1.33
1.9
0.04
1.12
-1.08
Adam Webster
3747
2
0.05
0.92
-0.87
5.3
0.13
-0.43
0.56
Tomas Kalas
3406
5
0.13
0.12
0.01
2.4
0.06
0.13
-0.06
Andreas Weimann
3348
4
0.11
0.23
-0.12
-0.5
-0.01
0.45
-0.46
Famara Diedhiou
3102
3
0.09
0.26
-0.17
4.1
0.12
-0.06
0.18
Jack Hunt
2713
3
0.10
0.19
-0.09
2.9
0.10
0.03
0.06
Jamie Paterson
2654
0
0.00
0.36
-0.36
3.6
0.12
-0.01
0.13
Niki Mv§enpv§v§
2405
2
0.07
0.21
-0.13
2.8
0.11
0.03
0.07
Lloyd Kelly
2311
2
0.08
0.20
-0.12
1.8
0.07
0.08
-0.01
Jay Dasilva
2036
2
0.09
0.17
-0.08
5.2
0.23
-0.08
0.31
Niclas Eliasson
1972
11
0.50
-0.21
0.71
5.2
0.24
-0.07
0.31
Callum O Dowda
1801
7
0.35
-0.04
0.39
-0.1
-0.01
0.14
-0.14
Max O Leary
1285
1
0.07
0.16
-0.09
0.1
0.01
0.11
-0.10
Matty Taylor
1200
11
0.83
-0.15
0.98
3.3
0.24
0.01
0.24
Eros Pisano
1106
2
0.16
0.12
0.04
-0.7
-0.06
0.12
-0.18
Nathan Baker
923
-1
-0.10
0.20
-0.29
-2.2
-0.21
0.16
-0.37
Bailey Wright
843
-1
-0.11
0.19
-0.30
-3.7
-0.39
0.19
-0.59
Derby County (Actual 6th, xG 15th)
Performance by Match
Performance by Formation
Starting Formation
Matches
Pts p90
xPts p90
Unknown
6
2.0
1.3
4-3-3
22
1.8
1.4
4-2-3-1
17
1.4
1.2
3-5-2
1
0.0
1.9
Attacking Performance by Player
Player
Apps
Mins
GI
G
A
xG
xA
xGp90
xAp90
Harry Wilson
40
3186
18
15
3
9.6
5.2
0.27
0.15
Martyn Waghorn
36
2183
12
9
3
6.4
1.8
0.26
0.07
Mason Mount
35
3051
12
8
4
7.8
6.1
0.23
0.18
Jack Marriott
33
1860
11
7
4
5.9
1.8
0.29
0.09
Jayden Bogle
40
3485
10
2
8
1.8
5.1
0.05
0.13
Tom Lawrence
33
2627
8
6
2
5.0
4.0
0.17
0.14
Mason Bennett
30
1108
7
3
4
2.5
2.7
0.20
0.22
Bradley Johnson
27
2092
5
2
3
2.0
1.1
0.09
0.05
Craig Bryson
28
2120
5
3
2
2.3
1.2
0.10
0.05
Craig Forsyth
13
961
4
0
4
0.1
1.9
0.01
0.18
Overall Performance by Player (P=Playing, NP=Not Playing)
Mason Mount has had a great season and has been hugely influential in helping the Rams to the last play off spot. Derby County have an actual Goal Difference per 90 mins of 0.65 (GDp90 P) when he’s played and -0.58 without him (GDp90 NP). The 19 year old has a big future and with the enforced transfer ban at Chelsea it will be interesting to see if he secures any minutes there.
Jayden Bogle and Scott Malone are the other pair who rank highly on the numbers.
Player
Mins
GD P
GDp90 P
GDp90 NP
Diff
xGD P
xGDp90 P
xGDp90 NP
Diff
Team Average
4140
15
0.33
-6.4
-0.14
Richard Keogh
4122
15
0.33
0.00
0.33
-6.4
-0.14
-0.23
0.10
Fikayo Tomori
3791
11
0.26
1.03
-0.77
-5.7
-0.14
-0.18
0.04
Jayden Bogle
3485
19
0.49
-0.55
1.04
-0.1
0.00
-0.87
0.87
Harry Wilson
3186
18
0.51
-0.28
0.79
-5.3
-0.15
-0.11
-0.04
Mason Mount
3051
22
0.65
-0.58
1.23
-2.0
-0.06
-0.37
0.31
Scott Carson
2700
1
0.03
0.88
-0.84
-3.7
-0.12
-0.17
0.05
Tom Lawrence
2627
13
0.45
0.12
0.33
-7.1
-0.24
0.04
-0.28
Martyn Waghorn
2183
12
0.49
0.14
0.36
-4.1
-0.17
-0.11
-0.06
Craig Bryson
2120
5
0.21
0.45
-0.23
1.5
0.07
-0.35
0.42
Bradley Johnson
2092
12
0.52
0.13
0.38
2.4
0.11
-0.39
0.49
Scott Malone
2075
17
0.74
-0.09
0.82
2.0
0.09
-0.37
0.45
Tom Huddlestone
1883
7
0.33
0.32
0.02
-3.8
-0.18
-0.10
-0.08
Jack Marriott
1860
-1
-0.05
0.63
-0.68
-5.4
-0.26
-0.04
-0.22
Duane Holmes
1490
4
0.24
0.37
-0.13
-7.4
-0.45
0.03
-0.48
Kelle Roos
1440
14
0.88
0.03
0.84
-2.7
-0.17
-0.12
-0.05
Florian Jozefzoon
1287
-10
-0.70
0.79
-1.49
-5.5
-0.38
-0.03
-0.35
David Nugent
1134
6
0.48
0.27
0.21
3.5
0.28
-0.30
0.57
Mason Bennett
1108
13
1.06
0.06
1.00
3.6
0.29
-0.30
0.59
Hull City (Actual 13th, xG 20th)
Performance by Match
Performance by Formation
Starting Formation
Matches
Pts p90
xPts p90
4-5-1
3
2.3
1.4
4-4-1-1
30
1.6
1.3
3-4-2-1
1
1.0
1.4
5-3-2
1
1.0
1.3
Unknown
6
0.7
1.2
3-5-2
1
0.0
0.5
3-4-3
1
0.0
1.8
4-4-2 (Classic)
2
0.0
0.8
4-1-4-1
1
0.0
0.5
Attacking Performance by Player
Player
Apps
Mins
GI
G
A
xG
xA
xGp90
xAp90
Jarrod Bowen
46
3951
26
22
4
16.1
5.6
0.37
0.13
Kamil Grosicki
39
3005
21
9
12
8.7
12.3
0.26
0.37
Fraizer Campbell
39
2590
18
12
6
7.1
2.2
0.25
0.08
Evandro Goebel
23
1184
7
3
4
1.7
2.3
0.13
0.17
Jackson Irvine
38
3178
7
6
1
5.6
2.8
0.16
0.08
Jordy de Wijs
32
2631
4
1
3
2.8
1.5
0.10
0.05
Marc Pugh
14
819
4
3
1
2.4
1.2
0.26
0.13
Markus Henriksen
39
3441
4
2
2
2.5
2.0
0.07
0.05
Todd Kane
38
3213
4
3
1
1.3
2.4
0.04
0.07
Chris Martin
30
1402
3
2
1
3.6
1.3
0.23
0.08
Overall Performance by Player (P=Playing, NP=Not Playing)
Jarrod Bowen hasn’t missed many minutes but the Tigers have been better with him. At just 21 years old he’s worthy of a punt from a non Top 6 Premier League team.
Reece Burke has had a good season on loan from West Ham and a strong pre-season may see him remain in London. If he’s out on loan again he’s likely to end up at a better team than Hull (sorry!).
Player
Mins
GD P
GDp90 P
GDp90 NP
Diff
xGD P
xGDp90 P
xGDp90 NP
Diff
Team Average
4140
-2
-0.04
-9.7
-0.21
Jarrod Bowen
3951
0
0.00
-0.95
0.95
-7.2
-0.16
-1.19
1.02
David Marshall
3826
3
0.07
-1.43
1.50
-7.0
-0.16
-0.77
0.60
Markus Henriksen
3441
1
0.03
-0.39
0.41
-7.2
-0.19
-0.32
0.13
Todd Kane
3213
-8
-0.22
0.58
-0.81
-9.1
-0.26
-0.05
-0.21
Jackson Irvine
3178
-4
-0.11
0.19
-0.30
-11.9
-0.34
0.21
-0.55
Eric Lichaj
3163
-7
-0.20
0.46
-0.66
-6.7
-0.19
-0.28
0.09
Kamil Grosicki
3005
9
0.27
-0.87
1.14
-2.8
-0.08
-0.55
0.46
Reece Burke
2781
6
0.19
-0.53
0.72
-1.2
-0.04
-0.56
0.52
Jordy de Wijs
2631
10
0.34
-0.72
1.06
1.1
0.04
-0.64
0.68
Fraizer Campbell
2590
-6
-0.21
0.23
-0.44
-9.0
-0.31
-0.04
-0.27
Stephen Kingsley
2165
-2
-0.08
0.00
-0.08
-6.1
-0.25
-0.16
-0.09
Dan Batty
1824
-3
-0.15
0.04
-0.19
-4.3
-0.21
-0.21
-0.01
Tommy Elphick
1620
0
0.00
-0.07
0.07
-3.7
-0.20
-0.21
0.01
Kevin Stewart
1597
-1
-0.06
-0.04
-0.02
-6.8
-0.38
-0.10
-0.28
Chris Martin
1402
9
0.58
-0.36
0.94
0.8
0.05
-0.34
0.40
Evandro Goebel
1184
-3
-0.23
0.03
-0.26
-1.8
-0.14
-0.24
0.10
Robbie McKenzie
1093
-11
-0.91
0.27
-1.17
-9.2
-0.76
-0.01
-0.75
Marc Pugh
819
1
0.11
-0.08
0.19
-2.7
-0.29
-0.19
-0.10
Ipswich Town (Actual 24th, xG 24th)
Performance by Match
Performance by Formation
Starting Formation
Matches
Pts p90
xPts p90
4-2-3-1
9
1.2
0.8
3-5-2
1
1.0
1.4
4-1-2-1-2 (Diamond Formation)
2
1.0
1.0
3-4-1-2
1
1.0
0.4
Unknown
6
0.5
1.6
4-3-3
19
0.6
1.0
4-1-4-1
2
0.5
0.5
3-5-1-1
1
0.0
1.3
4-4-1-1
1
0.0
0.8
4-2-2-2
1
0.0
0.7
4-4-2 (Classic)
2
0.0
0.6
5-3-2
1
0.0
0.7
Performance by Manager
Things started very badly for Paul Hurst and Paul Lambert didn’t improve upon them with performances actually deteriorating.
Managerial Record
Matches
Pts p90
Rank
xPts p90
Rank
Paul Hurst
14
0.6
24th
1.1
22nd
Bryan Klug
1
0.0
0.7
Paul Lambert
31
0.7
24th
0.9
24th
Attacking Performance by Player
Player
Apps
Mins
GI
G
A
xG
xA
xGp90
xAp90
Freddie Sears
24
1862
10
6
4
4.4
1.1
0.21
0.05
Gwion Edwards
33
2315
8
6
2
3.4
2.6
0.13
0.10
Collin Quaner
16
976
7
4
3
2.9
1.0
0.27
0.09
Kayden Jackson
34
1544
5
3
2
3.7
1.4
0.22
0.08
Jon Nolan
26
2001
3
3
0
2.7
1.5
0.12
0.07
Trevoh Chalobah
43
3275
3
2
1
3.7
1.3
0.10
0.04
Will Keane
11
716
3
3
0
2.3
0.5
0.29
0.07
Ellis Harrison
15
775
2
1
1
2.4
0.8
0.28
0.09
Flynn Downes
29
1849
2
1
1
0.8
1.6
0.04
0.08
Grant Ward
14
922
2
0
2
1.0
1.9
0.09
0.19
Overall Performance by Player (P=Playing, NP=Not Playing)
Hard to find a positive in such a poor season but Gwion Edwards posted some very interesting numbers. Ipswich had a Goal Difference per 90 mins (GDp90 P) of -0.35 when he was on the pitch compared to -1.58 without him (GDp90 NP) for an actual difference of 1.23. He is surely going to attract the attention of a Championship team this summer.
Player
Mins
GD P
GDp90 P
GDp90 NP
Diff
xGD P
xGDp90 P
xGDp90 NP
Diff
Team Average
4140
-41
-0.89
-36.9
-0.80
Luke Chambers
3870
-40
-0.93
-0.33
-0.60
-34.1
-0.79
-0.93
0.13
Trevoh Chalobah
3275
-33
-0.91
-0.83
-0.07
-29.5
-0.81
-0.77
-0.04
Cole Skuse
2710
-24
-0.80
-1.07
0.27
-25.8
-0.86
-0.70
-0.16
Matthew Pennington
2700
-26
-0.87
-0.94
0.07
-24.4
-0.81
-0.78
-0.03
Bartosz Bialkowski
2520
-25
-0.89
-0.89
0.00
-20.0
-0.71
-0.94
0.23
Jonas Knudsen
2475
-24
-0.87
-0.92
0.05
-15.3
-0.56
-1.17
0.61
Gwion Edwards
2315
-9
-0.35
-1.58
1.23
-14.2
-0.55
-1.12
0.57
Jon Nolan
2001
-19
-0.85
-0.93
0.07
-12.2
-0.55
-1.04
0.49
Freddie Sears
1862
-21
-1.02
-0.79
-0.22
-21.0
-1.02
-0.63
-0.39
Flynn Downes
1849
-30
-1.46
-0.43
-1.03
-18.5
-0.90
-0.72
-0.18
Alan Judge
1683
-16
-0.86
-0.92
0.06
-19.4
-1.04
-0.64
-0.40
Myles Kenlock
1626
-14
-0.77
-0.97
0.19
-20.0
-1.11
-0.60
-0.51
Dean Gerken
1620
-16
-0.89
-0.89
0.00
-16.9
-0.94
-0.71
-0.23
Aristote Nsiala
1610
-18
-1.01
-0.82
-0.19
-16.5
-0.92
-0.73
-0.20
Kayden Jackson
1544
-19
-1.11
-0.76
-0.34
-14.4
-0.84
-0.78
-0.06
Jordan Spence
1387
-19
-1.23
-0.72
-0.51
-9.4
-0.61
-0.90
0.29
James Bree
1170
-13
-1.00
-0.85
-0.15
-14.6
-1.13
-0.68
-0.45
Teddy Bishop
1068
-10
-0.84
-0.91
0.07
-8.3
-0.70
-0.84
0.14
Leeds United (Actual 3rd, xG 1st)
Performance by Match
Performance by Formation
Starting Formation
Matches
Pts p90
xPts p90
3-4-3
4
3.0
2.0
4-2-3-1
1
3.0
1.9
3-4-3 (Diamond Formation)
1
3.0
1.3
Unknown
6
2.3
1.5
4-1-4-1
34
1.5
1.8
Attacking Performance by Player
Player
Apps
Mins
GI
G
A
xG
xA
xGp90
xAp90
Pablo Hernv°ndez
39
3334
24
12
12
9.4
12.1
0.26
0.33
Mateusz Klich
46
3824
18
10
8
6.1
5.5
0.14
0.13
Kemar Roofe
30
2338
16
14
2
15.7
2.3
0.61
0.09
Ezgjan Alioski
44
3663
12
7
5
6.9
7.0
0.17
0.17
Patrick Bamford
21
1361
11
9
2
8.8
1.9
0.58
0.13
Luke Ayling
38
3247
8
2
6
4.8
6.0
0.13
0.17
Tyler Roberts
28
1865
8
3
5
4.9
2.3
0.23
0.11
Jack Harrison
36
2413
6
4
2
4.4
4.0
0.16
0.15
Barry Douglas
28
2076
5
0
5
1.0
4.7
0.04
0.21
Jack Clarke
22
798
4
2
2
1.2
2.3
0.13
0.26
Overall Performance by Player (P=Playing, NP=Not Playing)
Pablo Hernandez has had a great season judged both on actual and xG performance. At the other end of the spectrum it doesn’t read positive for Pontus Jansson. Leeds had a Goal Difference per 90 mins (GDp90 NP) of 1.58 without him but just 0.22 with him (GDp90 P).
Although results were okay under Aitor Karanka performances were poor. Under Martin O’Neill points have been picked up at a slower pace but xG performances have improved. A mixed season all round.
Managerial Record
Matches
Pts p90
Rank
xPts p90
Rank
Aitor Karanka
26
1.5
9th
1.3
20th
Martin O’Neill
20
1.4
13th
1.4
14th
Attacking Performance by Player
Player
Apps
Mins
GI
G
A
xG
xA
xGp90
xAp90
Britt Assombalonga
42
2684
14
14
0
12.6
2.4
0.42
0.08
Jordan Hugill
36
1785
8
6
2
9.7
1.3
0.49
0.07
Jonny Howson
46
3943
7
1
6
4.1
8.3
0.09
0.19
Muhamed Besic
37
2340
7
2
5
2.3
4.8
0.09
0.18
Lewis Wing
28
1798
6
3
3
3.1
4.1
0.16
0.21
Ashley Fletcher
21
1155
5
5
0
4.8
1.8
0.37
0.14
Dael Fry
34
2863
4
0
4
1.0
1.6
0.03
0.05
George Friend
38
3271
4
2
2
3.3
2.5
0.09
0.07
George Saville
34
2520
4
4
0
3.2
4.8
0.12
0.17
Marcus Tavernier
19
483
4
3
1
1.3
1.3
0.25
0.25
Overall Performance by Player (P=Playing, NP=Not Playing)
Lewis Wing catches the eye. Boro have posted positive numbers when playing and negative numbers without him. He will become an integral part of the promotion push next season if he can add more goals and assists.
Player
Mins
GD P
GDp90 P
GDp90 NP
Diff
xGD P
xGDp90 P
xGDp90 NP
Diff
Team Average
4140
8
0.17
4.8
0.10
Darren Randolph
4140
8
0.17
4.8
0.10
Jonny Howson
3943
7
0.16
0.46
-0.30
6.0
0.14
-0.54
0.68
Aden Flint
3544
6
0.15
0.30
-0.15
2.6
0.07
0.34
-0.27
George Friend
3271
4
0.11
0.41
-0.30
5.9
0.16
-0.11
0.28
Ryan Shotton
2877
7
0.22
0.07
0.15
-0.6
-0.02
0.39
-0.41
Dael Fry
2863
7
0.22
0.07
0.15
1.8
0.06
0.21
-0.16
Daniel Ayala
2776
1
0.03
0.46
-0.43
4.8
0.16
0.00
0.16
Britt Assombalonga
2684
8
0.27
0.00
0.27
4.4
0.15
0.02
0.13
George Saville
2520
6
0.21
0.11
0.10
3.2
0.12
0.09
0.03
Adam Clayton
2489
-3
-0.11
0.60
-0.71
-5.4
-0.20
0.56
-0.75
Muhamed Besic
2340
13
0.50
-0.25
0.75
9.9
0.38
-0.25
0.63
Stewart Downing
2336
-4
-0.15
0.60
-0.75
-0.8
-0.03
0.28
-0.31
Lewis Wing
1798
16
0.80
-0.31
1.11
9.5
0.48
-0.18
0.66
Jordan Hugill
1785
0
0.00
0.31
-0.31
-1.0
-0.05
0.22
-0.27
John Obi Mikel
1600
-4
-0.23
0.43
-0.65
-3.7
-0.21
0.30
-0.51
Ashley Fletcher
1155
6
0.47
0.06
0.41
5.3
0.42
-0.02
0.43
Martin Braithwaite
1109
10
0.81
-0.06
0.87
5.3
0.43
-0.02
0.45
Paddy McNair
733
-2
-0.25
0.26
-0.51
-1.4
-0.18
0.16
-0.34
Millwall (Actual 21st, xG 7th)
Performance by Match
Performance by Formation
Starting Formation
Matches
Pts p90
xPts p90
4-5-1
1
3.0
1.1
4-4-1-1
10
1.0
1.2
4-2-3-1
1
1.0
1.6
3-5-1-1
1
1.0
1.3
4-4-2 (Classic)
27
0.9
1.6
Unknown
6
0.8
1.3
Attacking Performance by Player
Player
Apps
Mins
GI
G
A
xG
xA
xGp90
xAp90
Lee Gregory
43
3545
17
10
7
15.1
3.5
0.38
0.09
Jake Cooper
46
4140
12
6
6
9.0
3.5
0.20
0.08
Jed Wallace
42
3685
7
5
2
6.0
6.7
0.15
0.16
Shaun Williams
31
2636
7
5
2
3.7
5.4
0.13
0.18
Steve Morison
41
1975
7
1
6
5.7
3.6
0.26
0.16
Shane Ferguson
35
2465
6
2
4
2.2
8.1
0.08
0.29
Ben Thompson
13
1014
4
4
0
1.2
0.7
0.11
0.06
Tom Elliott
32
1220
4
3
1
4.1
1.7
0.30
0.13
Aiden O Brien
35
1498
3
2
1
3.1
0.8
0.19
0.05
Ryan Leonard
37
3298
3
2
1
3.3
1.3
0.09
0.04
Overall Performance by Player (P=Playing, NP=Not Playing)
The goals of Lee Gregory kept the Lions in the Championship this season and he will be sorely missed if he does move on during the summer. Millwall had a Goal Difference per 90 mins (GDp90 P) of -0.23 when he was on the pitch compared to -1.06 without him (GDp90 NP) for an actual difference of 0.83.
Player
Mins
GD P
GDp90 P
GDp90 NP
Diff
xGD P
xGDp90 P
xGDp90 NP
Diff
Team Average
4140
-16
-0.35
10.2
0.22
Jake Cooper
4140
-16
-0.35
10.2
0.22
Jed Wallace
3685
-15
-0.37
-0.20
-0.17
6.3
0.15
0.79
-0.63
Mahlon Romeo
3619
-11
-0.27
-0.86
0.59
9.4
0.23
0.15
0.08
Lee Gregory
3545
-9
-0.23
-1.06
0.83
12.5
0.32
-0.34
0.66
Ryan Leonard
3298
-11
-0.30
-0.53
0.23
8.5
0.23
0.19
0.04
Shaun Williams
2636
-16
-0.55
0.00
-0.55
4.4
0.15
0.35
-0.20
James Meredith
2615
-22
-0.76
0.35
-1.11
4.6
0.16
0.34
-0.18
Shane Ferguson
2465
-3
-0.11
-0.70
0.59
13.6
0.50
-0.18
0.68
Jordan Archer
2160
-10
-0.42
-0.27
-0.14
5.6
0.24
0.21
0.03
Shaun Hutchinson
2148
-8
-0.34
-0.36
0.03
6.2
0.26
0.18
0.08
Steve Morison
1975
-9
-0.41
-0.29
-0.12
6.6
0.30
0.15
0.15
Ryan Tunnicliffe
1958
-10
-0.46
-0.25
-0.21
1.7
0.08
0.35
-0.28
Murray Wallace
1638
-8
-0.44
-0.29
-0.15
3.8
0.21
0.23
-0.03
Aiden O Brien
1498
-1
-0.06
-0.51
0.45
7.1
0.43
0.11
0.32
Tom Elliott
1220
-4
-0.30
-0.37
0.07
10.8
0.80
-0.02
0.81
Ben Marshall
1183
2
0.15
-0.55
0.70
-1.4
-0.10
0.35
-0.46
Ben Amos
1080
-6
-0.50
-0.29
-0.21
4.8
0.40
0.16
0.24
Ben Thompson
1014
-1
-0.09
-0.43
0.34
0.9
0.08
0.27
-0.19
Norwich City (Actual 1st, xG 3rd)
Performance by Match
Performance by Formation
Starting Formation
Matches
Pts p90
xPts p90
4-2-3-1
40
2.2
1.6
Unknown
6
0.8
1.4
Attacking Performance by Player
Player
Apps
Mins
GI
G
A
xG
xA
xGp90
xAp90
Teemu Pukki
42
3738
38
29
9
19.6
6.3
0.47
0.15
Emiliano Buendv?a Stati
38
2881
20
8
12
8.0
9.6
0.25
0.30
Mario Vrancic
35
1477
17
10
7
3.8
2.8
0.23
0.17
Onel Hernv°ndez
40
3145
17
8
9
8.6
7.4
0.25
0.21
Marco Stiepermann
43
3308
15
9
6
7.0
8.5
0.19
0.23
Kenny McLean
19
1344
9
3
6
1.6
2.5
0.11
0.17
Maximillian Aarons
41
3665
8
2
6
1.8
4.6
0.04
0.11
Jordan Rhodes
31
1011
7
6
1
5.2
0.3
0.47
0.03
Ben Godfrey
28
2386
6
4
2
4.0
0.6
0.15
0.02
Timm Klose
25
2117
5
4
1
2.9
0.2
0.12
0.01
Overall Performance by Player (P=Playing, NP=Not Playing)
Teemu Pukki had an outstanding season and looks great on all my metrics. However, to shine the light on a couple of the supporting cast both Christoph Zimmermann (1.59 actual difference) and Emiliano Buendia (1.23 actual difference) catch the eye. The German centre half Zimmermann will need to maintain the high standards to keep the Canaries in the Premier League. While at just 22 years old Bunedia has a very bright future and is one to watch next season.
Overall Performance by Player (P=Playing, NP=Not Playing)
Jack Robinson and Joao Carvalho look key to any chance of success next season. They are stand out performers on the numbers and Martin O’Neill will be hoping for he can keep hold of both them. Forest have a 0.33 Goal Difference (GDp90 P) when Robinson has played but -0.50 without him (GDp90 NP). Likewise for Carvalho, Forest have a GDp90 P of 0.60 and GDp90 NP of -0.57 in his minutes.
Overall Performance by Player (P=Playing, NP=Not Playing)
Looking at the players with the most minutes Ben Pearson has the biggest positive influence on the Lilywhites. Preston had a Goal Difference per 90 mins (GDp90 P) of 0.37 when he was on the pitch compared to -0.68 without him (GDp90 NP). Conversely, the team performed better without Darnell Fisher.
Player
Mins
GD P
GDp90 P
GDp90 NP
Diff
xGD P
xGDp90 P
xGDp90 NP
Diff
Team Average
4140
0
0.00
-3.5
-0.08
Ben Davies
3456
3
0.08
-0.39
0.47
-5.2
-0.13
0.22
-0.36
Declan Rudd
3240
0
0.00
0.00
0.00
-1.2
-0.03
-0.23
0.20
Alan Browne
3171
1
0.03
-0.09
0.12
-5.2
-0.15
0.16
-0.31
Darnell Fisher
2872
-8
-0.25
0.57
-0.82
-5.0
-0.16
0.10
-0.26
Andrew Hughes
2792
7
0.23
-0.47
0.69
1.2
0.04
-0.31
0.35
Ben Pearson
2689
11
0.37
-0.68
1.05
1.9
0.06
-0.33
0.39
Jordan Storey
2485
4
0.14
-0.22
0.36
-1.5
-0.05
-0.11
0.06
Daniel Johnson
2474
-3
-0.11
0.16
-0.27
-7.9
-0.29
0.24
-0.52
Paul Gallagher
2464
5
0.18
-0.27
0.45
-0.3
-0.01
-0.17
0.16
Tom Barkhuizen
2355
1
0.04
-0.05
0.09
1.0
0.04
-0.23
0.27
Lukas Nmecha
2319
-8
-0.31
0.40
-0.71
-2.6
-0.10
-0.04
-0.06
Callum Robinson
2042
-6
-0.26
0.26
-0.52
-5.1
-0.23
0.07
-0.30
Tom Clarke
1855
3
0.15
-0.12
0.26
1.6
0.08
-0.20
0.28
Paul Huntington
1845
-6
-0.29
0.24
-0.53
-0.4
-0.02
-0.12
0.10
Sean Maguire
1822
12
0.59
-0.47
1.06
-1.3
-0.07
-0.08
0.02
Ryan Ledson
1290
-13
-0.91
0.41
-1.32
-5.2
-0.36
0.05
-0.41
Joshua Earl
1055
-7
-0.60
0.20
-0.80
-4.8
-0.41
0.04
-0.45
Louis Moult
927
-1
-0.10
0.03
-0.13
-1.0
-0.10
-0.07
-0.03
Queens Park Rangers (Actual 19th, xG 10th)
Performance by Match
Performance by Formation
Starting Formation
Matches
Pts p90
xPts p90
4-1-4-1
2
1.5
1.5
4-4-1-1
22
1.5
1.5
4-2-3-1
6
1.2
1.0
Unknown
6
0.7
1.2
4-4-2 (Classic)
8
0.6
1.6
3-5-2
2
0.0
1.3
Performance by Manager
Although struggling in the table at the point of Steve McClaren’s departure expected performances were strong. The team have performed worse under John Eustace.
Managerial Record
Matches
Pts p90
Rank
xPts p90
Rank
Steve McClaren
39
1.1
19th
1.4
8th
John Eustace
7
1.0
21st
1.3
20th
Attacking Performance by Player
Player
Apps
Mins
GI
G
A
xG
xA
xGp90
xAp90
Luke Freeman
43
3777
13
7
6
6.6
10.0
0.16
0.24
Nahki Wells
40
2860
13
7
6
10.4
3.6
0.33
0.11
Pawel Wszolek
37
2448
8
4
4
3.9
3.4
0.14
0.13
Eberechi Eze
42
3192
7
4
3
5.4
2.6
0.15
0.07
Massimo Luongo
41
3620
7
3
4
5.8
3.3
0.14
0.08
Matt Smith
32
924
7
6
1
5.5
1.5
0.54
0.14
Tomer Hemed
26
1335
7
7
0
9.8
1.1
0.66
0.08
Angel Rangel
20
1736
4
2
2
0.7
1.3
0.04
0.07
Jake Bidwell
40
3484
4
0
4
1.6
4.4
0.04
0.11
Josh Scowen
34
2205
4
2
2
1.5
3.2
0.06
0.13
Overall Performance by Player (P=Playing, NP=Not Playing)
Two players stand head and shoulders above the rest of the squad: Joe Lumley and Toni Leistner. It’s noticeable how much worse the team have been without them with a GDp90 NP of -2.75 for Lumley and -2.69 for Leistner. Based on xG performance QPR are almost a goal a game better with them in the team then without. Between them they are forming the foundations of a solid defence.
Player
Mins
GD P
GDp90 P
GDp90 NP
Diff
xGD P
xGDp90 P
xGDp90 NP
Diff
Team Average
4140
-18
-0.39
1.4
0.03
Joe Lumley
3780
-7
-0.17
-2.75
2.58
4.7
0.11
-0.81
0.92
Luke Freeman
3777
-18
-0.43
0.00
-0.43
-0.4
-0.01
0.45
-0.46
Toni Leistner
3739
-6
-0.14
-2.69
2.55
4.8
0.12
-0.77
0.88
Massimo Luongo
3620
-10
-0.25
-1.38
1.14
4.5
0.11
-0.54
0.65
Jake Bidwell
3484
-18
-0.46
0.00
-0.46
1.4
0.04
0.01
0.03
Eberechi Eze
3192
-10
-0.28
-0.76
0.48
-1.9
-0.05
0.31
-0.37
Joel Lynch
3070
-12
-0.35
-0.50
0.15
0.7
0.02
0.06
-0.03
Nahki Wells
2860
-9
-0.28
-0.63
0.35
1.1
0.03
0.02
0.01
Pawel Wszolek
2448
-14
-0.51
-0.21
-0.30
-3.9
-0.14
0.28
-0.42
Josh Scowen
2205
-14
-0.57
-0.19
-0.39
-3.5
-0.14
0.23
-0.37
Jordan Cousins
2107
-12
-0.51
-0.27
-0.25
-4.4
-0.19
0.26
-0.44
Darnell Furlong
2074
-11
-0.48
-0.30
-0.17
0.2
0.01
0.05
-0.05
Angel Rangel
1736
2
0.10
-0.75
0.85
2.9
0.15
-0.05
0.20
Geoff Cameron
1391
-1
-0.06
-0.56
0.49
3.8
0.25
-0.08
0.33
Tomer Hemed
1335
0
0.00
-0.58
0.58
6.3
0.43
-0.16
0.58
Bright Samuel
1129
-5
-0.40
-0.39
-0.01
3.8
0.30
-0.07
0.37
Matt Smith
924
-9
-0.88
-0.25
-0.62
0.2
0.02
0.03
-0.01
Ryan Manning
632
-2
-0.28
-0.41
0.13
1.2
0.18
0.00
0.17
Reading (Actual 20th, xG 23rd)
Performance by Match
Performance by Formation
Starting Formation
Matches
Pts p90
xPts p90
4-1-4-1
1
3.0
0.5
4-3-3
10
1.3
1.0
4-2-3-1
23
1.1
1.0
4-3-2-1
1
1.0
0.8
5-3-2
3
0.7
0.5
Unknown
6
0.3
1.3
4-4-2 (Classic)
1
0.0
0.4
4-3-1-2
1
0.0
0.5
Performance by Manager
A poor half season under Paul Clement was followed by an improved half season under José Gomes who steered them to safety. xG performance remained consistent throughout so Gomes has done well to keep them up.
Overall Performance by Player (P=Playing, NP=Not Playing)
Captain marvel Liam Moore is the standout for the Royals. Reading have looked pretty poor throughout the season albeit less poor when he’s been present. A goal difference per 90 (GDp90 P) of -0.24 when he’s played far superior to -1.00 without him (GDp90 NP).
Player
Mins
GD P
GDp90 P
GDp90 NP
Diff
xGD P
xGDp90 P
xGDp90 NP
Diff
Team Average
4140
-17
-0.37
-36.3
-0.79
Andy Yiadom
4050
-17
-0.38
0.00
-0.38
-34.7
-0.77
-1.57
0.80
Liam Moore
3420
-9
-0.24
-1.00
0.76
-29.1
-0.77
-0.90
0.13
Yakou Meite
2616
-16
-0.55
-0.06
-0.49
-25.8
-0.89
-0.62
-0.27
Tyler Blackett
2578
-11
-0.38
-0.35
-0.04
-29.8
-1.04
-0.38
-0.66
John Swift
2548
-7
-0.25
-0.57
0.32
-20.3
-0.72
-0.90
0.19
Modou Barrow
2150
-11
-0.46
-0.27
-0.19
-14.5
-0.61
-0.99
0.38
Andy Rinomhota
2114
-7
-0.30
-0.44
0.15
-22.5
-0.96
-0.61
-0.35
Leandro Bacuna
2102
-7
-0.30
-0.44
0.14
-17.8
-0.76
-0.82
0.06
Tiago Ilori
1710
-8
-0.42
-0.33
-0.09
-10.0
-0.53
-0.97
0.44
Emiliano Martinez
1620
-5
-0.28
-0.43
0.15
-13.9
-0.77
-0.80
0.03
Matt Miazga
1620
-5
-0.28
-0.43
0.15
-13.9
-0.77
-0.80
0.03
Chris Gunter
1557
-6
-0.35
-0.38
0.04
-17.4
-1.01
-0.66
-0.35
Garath McCleary
1524
-5
-0.30
-0.41
0.12
-17.8
-1.05
-0.64
-0.41
Lewis Baker
1479
-7
-0.43
-0.34
-0.09
-14.3
-0.87
-0.75
-0.12
Liam Kelly
1412
-4
-0.25
-0.43
0.17
-16.2
-1.03
-0.66
-0.37
Sam Baldock
1364
-4
-0.26
-0.42
0.16
-12.3
-0.81
-0.78
-0.04
Anssi Jaakkola
1350
-8
-0.53
-0.29
-0.24
-16.9
-1.13
-0.63
-0.50
Oviemuno Ejaria
1303
-3
-0.21
-0.44
0.24
-9.7
-0.67
-0.84
0.17
Rotherham United (Actual 22nd, xG 21st)
Performance by Match
Performance by Formation
Starting Formation
Matches
Pts p90
xPts p90
4-2-3-1
1
3.0
1.4
4-3-3
7
1.1
1.4
4-4-1-1
5
1.2
1.4
3-5-2
2
1.0
1.4
Unknown
6
1.0
1.0
4-1-4-1
23
0.7
1.1
4-4-2 (Classic)
2
0.0
1.4
Attacking Performance by Player
Player
Apps
Mins
GI
G
A
xG
xA
xGp90
xAp90
Will Vaulks
41
3672
14
7
7
7.8
5.3
0.19
0.13
Michael Smith
44
3836
12
8
4
10.1
4.1
0.24
0.10
Semi Ajayi
46
4107
8
7
1
8.5
1.8
0.19
0.04
Richard Towell
34
2494
6
4
2
4.5
1.6
0.16
0.06
Jon Taylor
41
2527
5
4
1
5.0
3.3
0.18
0.12
Ryan Manning
18
1175
5
4
1
5.5
1.1
0.42
0.08
Clark Robertson
28
2366
4
3
1
4.0
1.0
0.15
0.04
Joe Newell
31
1640
4
0
4
2.4
6.3
0.13
0.34
Anthony Forde
28
1507
3
1
2
1.2
3.1
0.07
0.18
Matt Crooks
16
736
3
3
0
2.2
0.8
0.27
0.10
Overall Performance by Player (P=Playing, NP=Not Playing)
The top five players in the list below featured in around 90% of more of the total minutes and it’s noticeable how the team performed better when they were involved. If they can keep this nucleus of players together then that provides a strong foundation to build on next season in League One.
Player
Mins
GD P
GDp90 P
GDp90 NP
Diff
xGD P
xGDp90 P
xGDp90 NP
Diff
Team Average
4140
-31
-0.67
-13.4
-0.29
Semi Ajayi
4107
-30
-0.66
-2.73
2.07
-13.5
-0.30
0.20
-0.50
Marek Rodak
4050
-30
-0.67
-1.00
0.33
-13.5
-0.30
0.10
-0.40
Joe Mattock
3890
-26
-0.60
-1.80
1.20
-12.1
-0.28
-0.49
0.21
Michael Smith
3836
-25
-0.59
-1.78
1.19
-11.5
-0.27
-0.56
0.29
Will Vaulks
3672
-23
-0.56
-1.54
0.97
-7.9
-0.19
-1.06
0.87
Zak Vyner
2583
-25
-0.87
-0.35
-0.52
-6.7
-0.23
-0.39
0.15
Jon Taylor
2527
-22
-0.78
-0.50
-0.28
-10.8
-0.38
-0.15
-0.24
Richard Towell
2494
-21
-0.76
-0.55
-0.21
-7.9
-0.29
-0.30
0.01
Clark Robertson
2366
-12
-0.46
-0.96
0.51
-2.0
-0.07
-0.58
0.51
Ryan Williams
2358
-11
-0.42
-1.01
0.59
-4.8
-0.18
-0.43
0.25
Richard Wood
2047
-17
-0.75
-0.60
-0.15
-11.7
-0.51
-0.08
-0.44
Joe Newell
1640
-13
-0.71
-0.65
-0.07
-2.1
-0.11
-0.41
0.29
Billy Jones
1613
-15
-0.84
-0.57
-0.27
-8.8
-0.49
-0.16
-0.33
Anthony Forde
1507
-16
-0.96
-0.51
-0.44
-5.8
-0.34
-0.26
-0.08
Michael Ihiekwe
1317
-10
-0.68
-0.67
-0.01
-4.4
-0.30
-0.29
-0.01
Ryan Manning
1175
-9
-0.69
-0.67
-0.02
-3.9
-0.30
-0.29
0.00
Ben Wiles
934
-5
-0.48
-0.73
0.25
-2.8
-0.26
-0.30
0.03
Kyle Vassell
897
0
0.00
-0.86
0.86
-1.5
-0.15
-0.33
0.18
Sheffield United (Actual 2nd, xG 2nd)
Performance by Match
Performance by Formation
Starting Formation
Matches
Pts p90
xPts p90
3-4-2-1
1
3.0
1.8
3-4-1-2
30
2.0
1.8
Unknown
6
2.0
1.6
3-5-2
9
1.7
1.5
Attacking Performance by Player
Player
Apps
Mins
GI
G
A
xG
xA
xGp90
xAp90
Billy Sharp
40
3026
27
23
4
15.5
2.6
0.46
0.08
David McGoldrick
45
3262
19
15
4
17.0
3.5
0.47
0.10
John Fleck
45
3975
12
2
10
2.9
8.7
0.07
0.20
Mark Duffy
36
2450
12
6
6
3.1
5.8
0.11
0.21
Oliver Norwood
43
3807
11
3
8
3.7
12.1
0.09
0.29
Enda Stevens
45
4029
10
4
6
3.6
5.7
0.08
0.13
Jack O Connell
41
3676
6
3
3
4.0
2.9
0.10
0.07
Kieron Freeman
20
1748
6
2
4
1.2
3.6
0.06
0.18
Leon Clarke
23
929
6
3
3
4.8
0.9
0.46
0.09
Chris Basham
41
3430
5
4
1
2.4
3.3
0.06
0.09
Overall Performance by Player (P=Playing, NP=Not Playing)
Tough to highlight standouts for a team who deservedly finished in the automatic spots and it will be interesting to see where Chris Wilder decides to invest. Three worth a mention are John Fleck, Oliver Norwood and Mark Duffy. The Blades were considerably stronger during their minutes on the pitch.
Sheffield United had a goal difference per 90 minutes (GDp90 P) of 0.88 when Fleck played compared to -1.09 without him (GDp90 NP). Likewise, it was a GDp90 P of 0.92 and GDp90 NP of -0.54 for Norwood, and a GDp90 P of 1.18 and GDp90 NP of 0.27 for Duffy.
Player
Mins
GD P
GDp90 P
GDp90 NP
Diff
xGD P
xGDp90 P
xGDp90 NP
Diff
Team Average
4140
37
0.80
28.9
0.63
Dean Henderson
4140
37
0.80
28.9
0.63
Enda Stevens
4029
35
0.78
1.62
-0.84
28.3
0.63
0.52
0.11
John Fleck
3975
39
0.88
-1.09
1.97
28.0
0.63
0.51
0.12
John Egan
3915
33
0.76
1.60
-0.84
28.2
0.65
0.28
0.37
Oliver Norwood
3807
39
0.92
-0.54
1.46
28.1
0.66
0.22
0.45
Jack O Connell
3676
32
0.78
0.97
-0.19
26.2
0.64
0.53
0.11
Chris Basham
3430
22
0.58
1.90
-1.32
23.5
0.62
0.69
-0.07
David McGoldrick
3262
31
0.86
0.62
0.24
21.3
0.59
0.79
-0.20
Billy Sharp
3026
30
0.89
0.57
0.33
19.4
0.58
0.77
-0.19
Mark Duffy
2450
32
1.18
0.27
0.91
24.1
0.88
0.26
0.62
George Baldock
2275
17
0.67
0.97
-0.29
14.0
0.55
0.72
-0.17
Kieron Freeman
1748
17
0.88
0.75
0.12
15.1
0.78
0.52
0.26
Leon Clarke
929
1
0.10
1.01
-0.91
6.8
0.66
0.62
0.04
Martin Cranie
881
10
1.02
0.75
0.28
-0.3
-0.04
0.81
-0.84
Gary Madine
707
12
1.53
0.66
0.87
7.6
0.97
0.56
0.41
Kieran Dowell
666
7
0.95
0.78
0.17
6.1
0.82
0.59
0.23
Richard Stearman
437
5
1.03
0.78
0.25
2.4
0.49
0.64
-0.15
Scott Hogan
434
11
2.28
0.63
1.65
4.5
0.94
0.59
0.35
Sheffield Wednesday (Actual 12th, xG 19th)
Performance by Match
Performance by Formation
Starting Formation
Matches
Pts p90
xPts p90
4-3-3
1
3.0
1.9
3-4-3
4
2.5
1.0
Unknown
6
1.7
1.2
4-1-4-1
5
1.6
1.5
4-4-1-1
4
1.5
1.6
4-4-2 (Classic)
13
1.4
1.2
3-4-1-2
1
1.0
1.0
3-1-4-2
1
1.0
1.1
4-2-3-1
6
1.0
1.2
3-4-2-1
2
0.5
1.4
4-3-2-1
1
0.0
1.4
4-1-2-1-2 (Diamond Formation)
2
0.0
1.5
Performance by Manager
Jos Luhukay rightly faced the chop with all three managers to take helm subsequently improving the team. Steve Bruce has achieved playoff results in his stint but they have performed as a mid table team on xG.
Managerial Record
Matches
Pts p90
Rank
xPts p90
Rank
Jos Luhukay
22
1.1
20th
1.1
22nd
Lee Bullen
4
2.0
1.7
Steve Agnew
2
1.5
1.3
Steve Bruce
18
1.6
6th
1.4
12th
Attacking Performance by Player
Player
Apps
Mins
GI
G
A
xG
xA
xGp90
xAp90
Barry Bannan
41
3596
16
5
11
3.2
8.7
0.08
0.22
Adam Reach
43
3764
15
8
7
6.0
7.1
0.14
0.17
Steven Fletcher
39
2445
13
11
2
10.7
2.2
0.39
0.08
Lucas Jov£o
31
1606
12
10
2
5.8
2.0
0.32
0.11
Marco Matias
31
1799
8
6
2
3.1
1.4
0.16
0.07
Fernando Forestieri
23
1296
7
6
1
5.1
1.0
0.35
0.07
Atdhe Nuhiu
33
1530
6
4
2
4.7
1.5
0.28
0.09
Dominic Iorfa
11
835
4
3
1
1.4
0.6
0.15
0.07
Tom Lees
42
3780
4
2
2
2.5
2.7
0.06
0.06
George Boyd
20
1284
3
1
2
1.9
1.8
0.13
0.13
Overall Performance by Player (P=Playing, NP=Not Playing)
Tom Lees and Michael Hector, on loan from Chelsea, both had great seasons in defence with the Owls c.0.7 goals better per game with the pair in the team. Hector will be popular amongst Championship teams in the summer looking to secure a deal.
Player
Mins
GD P
GDp90 P
GDp90 NP
Diff
xGD P
xGDp90 P
xGDp90 NP
Diff
Team Average
4140
-2
-0.04
-6.6
-0.14
Tom Lees
3780
1
0.02
-0.75
0.77
-5.4
-0.13
-0.29
0.16
Adam Reach
3764
1
0.02
-0.72
0.74
-5.2
-0.13
-0.32
0.20
Barry Bannan
3596
-3
-0.08
0.17
-0.24
-7.1
-0.18
0.08
-0.26
Michael Hector
3242
4
0.11
-0.60
0.71
-2.4
-0.07
-0.42
0.35
Liam Palmer
3091
2
0.06
-0.34
0.40
-1.2
-0.03
-0.47
0.43
Joey Pelupessy
2483
-7
-0.25
0.27
-0.53
-8.1
-0.30
0.08
-0.38
Steven Fletcher
2445
1
0.04
-0.16
0.20
-1.3
-0.05
-0.28
0.23
Cameron Dawson
2340
-10
-0.38
0.40
-0.78
-9.3
-0.36
0.14
-0.49
Keiren Westwood
1890
8
0.38
-0.40
0.78
2.7
0.13
-0.37
0.50
Morgan Fox
1881
-9
-0.43
0.28
-0.71
-1.5
-0.07
-0.20
0.13
Marco Matias
1799
-3
-0.15
0.04
-0.19
-3.4
-0.17
-0.12
-0.05
Sam Hutchinson
1770
3
0.15
-0.19
0.34
0.4
0.02
-0.27
0.29
Lucas Jov£o
1606
-1
-0.06
-0.04
-0.02
-2.3
-0.13
-0.15
0.02
Atdhe Nuhiu
1530
-3
-0.18
0.03
-0.21
-3.3
-0.19
-0.11
-0.08
Jordan Thorniley
1518
-3
-0.18
0.03
-0.21
-5.0
-0.30
-0.05
-0.24
Fernando Forestieri
1296
-1
-0.07
-0.03
-0.04
-2.2
-0.15
-0.14
-0.01
George Boyd
1284
-1
-0.07
-0.03
-0.04
0.3
0.02
-0.22
0.24
Matt Penney
1079
-3
-0.25
0.03
-0.28
-4.6
-0.38
-0.06
-0.32
Stoke City (Actual 16th, xG 13th)
Performance by Match
Performance by Formation
Starting Formation
Matches
Pts p90
xPts p90
4-5-1
1
3.0
1.0
4-1-4-1
7
1.7
1.3
4-4-1-1
4
1.5
0.9
3-5-2
2
1.5
1.4
4-3-3
17
1.3
1.5
4-4-2 (Classic)
1
1.0
2.1
3-5-1-1
1
1.0
1.3
Unknown
6
0.8
1.3
5-3-2
2
0.5
1.5
4-1-2-1-2 (Diamond Formation)
4
0.3
1.2
4-2-3-1
1
0.0
0.4
Performance by Manager
Gary Rowett underperformed pre season expectations but Nathan Jones hasn’t had the expected improvement. Big summer window ahead of next season.
Managerial Record
Matches
Pts p90
Rank
xPts p90
Rank
Gary Rowett
26
1.3
14th
1.4
14th
Nathan Jones
20
1.0
21st
1.2
20th
Attacking Performance by Player
Player
Apps
Mins
GI
G
A
xG
xA
xGp90
xAp90
Tom Ince
38
3101
13
6
7
8.6
4.9
0.25
0.14
Benik Afobe
45
2823
10
8
2
9.4
1.4
0.30
0.05
Joe Allen
46
4132
10
6
4
6.2
6.0
0.13
0.13
James McClean
42
2948
9
3
6
4.7
4.1
0.14
0.13
Sam Clucas
26
2088
7
3
4
2.2
2.7
0.10
0.12
Erik Pieters
21
1847
4
2
2
0.4
0.7
0.02
0.03
Saido Berahino
22
1293
4
3
1
4.0
0.8
0.28
0.05
Sam Vokes
12
836
4
3
1
2.2
0.7
0.24
0.07
Oghenekaro Etebo
34
2609
3
2
1
2.2
2.4
0.08
0.08
Ashley Williams
33
2604
2
1
1
1.5
0.8
0.05
0.03
Overall Performance by Player (P=Playing, NP=Not Playing)
The quick of a small sample show how much better Stoke were in the 8 minutes Joe Allen didn’t play. On a serious note Tom Ince was positive for the Potters in his minutes this season. Nathan Jones will be hopeful he will have another strong season as they look to build on what was ultimately a hugely disappointing season.
Player
Mins
GD P
GDp90 P
GDp90 NP
Diff
xGD P
xGDp90 P
xGDp90 NP
Diff
Team Average
4140
-7
-0.15
-6.5
-0.14
Joe Allen
4132
-8
-0.17
11.25
-11.42
-6.5
-0.14
0.00
-0.14
Jack Butland
4050
-6
-0.13
-1.00
0.87
-6.9
-0.15
0.41
-0.56
Bruno Martins Indi
3126
-4
-0.12
-0.27
0.15
-2.5
-0.07
-0.35
0.28
Tom Ince
3101
0
0.00
-0.61
0.61
-0.6
-0.02
-0.51
0.50
James McClean
2948
-9
-0.27
0.15
-0.43
-8.4
-0.26
0.14
-0.40
Ryan Shawcross
2937
-5
-0.15
-0.15
0.00
-2.1
-0.06
-0.33
0.26
Benik Afobe
2823
-5
-0.16
-0.14
-0.02
-11.4
-0.36
0.34
-0.70
Oghenekaro Etebo
2609
-10
-0.34
0.18
-0.52
-0.8
-0.03
-0.34
0.31
Ashley Williams
2604
-9
-0.31
0.12
-0.43
-12.9
-0.45
0.38
-0.82
Ryan Woods
2271
3
0.12
-0.48
0.60
0.2
0.01
-0.32
0.33
Sam Clucas
2088
-4
-0.17
-0.13
-0.04
-5.7
-0.25
-0.03
-0.21
Thomas Edwards
1965
-7
-0.32
0.00
-0.32
-7.7
-0.35
0.05
-0.40
Erik Pieters
1847
0
0.00
-0.27
0.27
-3.8
-0.18
-0.11
-0.08
Rhu-Endly Martina
1599
1
0.06
-0.28
0.34
0.5
0.03
-0.25
0.27
Danny Batth
1530
-3
-0.18
-0.14
-0.04
-3.8
-0.23
-0.09
-0.13
Saido Berahino
1293
0
0.00
-0.22
0.22
-4.0
-0.28
-0.08
-0.20
Sam Vokes
836
-4
-0.43
-0.08
-0.35
-2.0
-0.21
-0.12
-0.09
Bojan Krkic
736
5
0.61
-0.32
0.93
3.7
0.45
-0.27
0.72
Swansea City (Actual 10th, xG 8th)
Performance by Match
Performance by Formation
Starting Formation
Matches
Pts p90
xPts p90
3-5-2
2
2.0
1.2
Unknown
6
1.8
1.1
4-2-3-1
23
1.7
1.6
4-3-3
6
1.3
1.6
3-4-1-2
1
1.0
1.4
4-2-2-2
1
1.0
1.0
4-4-2 (Classic)
3
0.3
1.2
4-1-4-1
1
0.0
2.3
3-4-3
2
0.0
1.5
3-4-2-1
1
0.0
0.8
Attacking Performance by Player
Player
Apps
Mins
GI
G
A
xG
xA
xGp90
xAp90
Oliver McBurnie
42
3414
26
22
4
15.7
3.8
0.41
0.10
Bersant Celina
38
2963
11
5
6
7.9
7.6
0.24
0.23
Daniel James
33
2507
11
4
7
8.3
5.1
0.30
0.18
Wayne Routledge
24
1848
8
5
3
3.9
6.0
0.19
0.29
Barrie McKay
29
1397
7
2
5
1.1
2.9
0.07
0.19
Connor Roberts
45
3956
6
5
1
4.9
5.5
0.11
0.13
Matt Grimes
45
3730
5
1
4
3.2
5.7
0.08
0.14
Courtney Baker-Richardson
15
533
4
3
1
2.8
0.5
0.47
0.09
Mike van der Hoorn
46
4069
4
3
1
4.4
2.0
0.10
0.04
George Byers
21
1647
3
2
1
2.1
1.2
0.11
0.07
Overall Performance by Player (P=Playing, NP=Not Playing)
Daniel James is the Swans player on everyones lips but the team actually had a better GD without him. Swansea had a Goal Difference per 90 mins (GDp90 P) of -0.11 when he was on the pitch compared to 0.33 without him (GDp90 NP). This is reversed based on xG performance.
Player
Mins
GD P
GDp90 P
GDp90 NP
Diff
xGD P
xGDp90 P
xGDp90 NP
Diff
Team Average
4140
3
0.07
9.2
0.20
Mike van der Hoorn
4069
3
0.07
0.00
0.07
9.5
0.21
-0.42
0.63
Connor Roberts
3956
-1
-0.02
1.96
-1.98
6.5
0.15
1.32
-1.17
Matt Grimes
3730
4
0.10
-0.22
0.32
12.9
0.31
-0.80
1.11
Oliver McBurnie
3414
5
0.13
-0.25
0.38
6.8
0.18
0.30
-0.12
Bersant Celina
2963
1
0.03
0.15
-0.12
5.2
0.16
0.31
-0.15
Kyle Naughton
2757
6
0.20
-0.20
0.39
13.4
0.44
-0.28
0.71
Daniel James
2507
-3
-0.11
0.33
-0.44
11.2
0.40
-0.11
0.51
Erwin Mulder
2227
1
0.04
0.09
-0.05
-3.3
-0.13
0.59
-0.72
Cameron Carter-Vickers
2203
-5
-0.20
0.37
-0.58
8.5
0.35
0.03
0.32
Joe Rodon
2052
2
0.09
0.04
0.04
-1.7
-0.08
0.47
-0.55
Kristoffer Nordfeldt
1913
2
0.09
0.04
0.05
12.5
0.59
-0.13
0.72
Jay Fulton
1910
-1
-0.05
0.16
-0.21
-1.2
-0.06
0.42
-0.48
Wayne Routledge
1848
8
0.39
-0.20
0.59
7.9
0.38
0.05
0.33
George Byers
1647
-1
-0.05
0.14
-0.20
9.1
0.50
0.00
0.49
Barrie McKay
1397
2
0.13
0.03
0.10
-2.6
-0.17
0.39
-0.56
Nathan Dyer
1360
4
0.26
-0.03
0.30
8.7
0.57
0.02
0.56
Leroy Fer
1351
8
0.53
-0.16
0.69
-0.4
-0.02
0.31
-0.33
Martin Olsson
1105
-4
-0.33
0.21
-0.53
-1.1
-0.09
0.31
-0.40
West Bromwich Albion (Actual 4th, xG 4th)
Performance by Match
Performance by Formation
Starting Formation
Matches
Pts p90
xPts p90
4-2-2-2
1
3.0
1.4
3-5-2
3
3.0
1.8
4-4-2 (Classic)
2
2.0
1.9
4-3-3
21
1.8
1.4
Unknown
6
1.7
1.4
3-4-1-2
10
1.5
1.6
3-4-3
2
0.5
1.0
4-4-1-1
1
0.0
2.1
Performance by Manager
Darren Moore was unlucky to lose his job with just 10 games to go having essentially secured a playoff spot. West Bromwich Albion have picked up more points under James Shan but xG performance indicate that is fortunate.
Managerial Record
Matches
Pts p90
Rank
xPts p90
Rank
Darren Moore
36
1.7
5th
1.5
4th
James Shan
10
1.9
3rd
1.4
10th
Attacking Performance by Player
Player
Apps
Mins
GI
G
A
xG
xA
xGp90
xAp90
Jay Rodriguez
45
3979
28
22
6
19.8
4.6
0.45
0.10
Dwight Gayle
39
2846
25
23
2
14.7
2.4
0.46
0.08
Harvey Barnes
26
2225
15
9
6
7.3
4.4
0.30
0.18
Matt Phillips
30
2092
12
5
7
2.8
7.6
0.12
0.33
Chris Brunt
31
2004
8
2
6
2.0
7.1
0.09
0.32
Kieran Gibbs
36
3037
8
4
4
1.6
3.7
0.05
0.11
Hal Robson-Kanu
34
1485
5
4
1
5.5
2.5
0.33
0.15
Stefan Johansen
12
883
5
2
3
0.7
2.3
0.08
0.24
Craig Dawson
41
3550
4
2
2
4.3
2.6
0.11
0.07
Jake Livermore
39
3182
4
2
2
1.7
1.9
0.05
0.05
Overall Performance by Player (P=Playing, NP=Not Playing)
The toughest one to draw conclusions from. The players at the top of the list with the most minutes played haven’t had a poisitve impact based on both actuals and xG performance. Looking further down the list Harvey Barnes (now back at Leicester City) and Matt Phillips are the first ones who fall into this category.
Player
Mins
GD P
GDp90 P
GDp90 NP
Diff
xGD P
xGDp90 P
xGDp90 NP
Diff
Team Average
4140
25
0.54
12.7
0.28
Sam Johnstone
4140
25
0.54
12.7
0.28
Jay Rodriguez
3979
22
0.50
1.68
-1.18
10.5
0.24
1.18
-0.94
Craig Dawson
3550
21
0.53
0.61
-0.08
10.6
0.27
0.31
-0.05
Ahmed Hegazy
3284
29
0.79
-0.42
1.22
5.8
0.16
0.72
-0.56
Jake Livermore
3182
24
0.68
0.09
0.58
9.1
0.26
0.34
-0.08
Kieran Gibbs
3037
30
0.89
-0.41
1.30
9.0
0.27
0.29
-0.03
Dwight Gayle
2846
20
0.63
0.35
0.28
5.6
0.18
0.49
-0.31
Harvey Barnes
2225
21
0.85
0.19
0.66
8.2
0.33
0.21
0.12
Kyle Bartley
2187
12
0.49
0.60
-0.11
6.9
0.29
0.26
0.02
Matt Phillips
2092
17
0.73
0.35
0.38
11.3
0.49
0.06
0.43
Tosin Adarabioyo
2029
6
0.27
0.81
-0.54
8.4
0.37
0.18
0.19
Chris Brunt
2004
15
0.67
0.42
0.25
7.4
0.33
0.22
0.11
Mason Holgate
1659
3
0.16
0.80
-0.64
0.7
0.04
0.43
-0.40
Hal Robson-Kanu
1485
9
0.55
0.54
0.00
13.2
0.80
-0.02
0.82
Gareth Barry
1388
17
1.10
0.26
0.84
8.7
0.56
0.13
0.43
Rekeem Harper
1131
0
0.00
0.75
-0.75
-1.4
-0.11
0.42
-0.53
James Morrison
963
0
0.00
0.71
-0.71
5.1
0.47
0.21
0.26
Conor Townsend
957
1
0.09
0.68
-0.58
4.9
0.46
0.22
0.25
Wigan Athletic (Actual 18th, xG 14th)
Performance by Match
Performance by Formation
Starting Formation
Matches
Pts p90
xPts p90
Unknown
6
1.7
1.8
4-2-3-1
13
1.6
1.1
3-5-2
1
1.0
0.8
3-4-2-1
1
1.0
2.3
5-4-1
1
1.0
1.9
4-4-1-1
20
0.9
1.4
4-1-4-1
3
0.3
1.2
3-4-3
1
0.0
1.0
Attacking Performance by Player
Player
Apps
Mins
GI
G
A
xG
xA
xGp90
xAp90
Nick Powell
32
1996
14
8
6
8.5
3.3
0.38
0.15
Joe Garner
30
1507
9
8
1
7.1
1.0
0.42
0.06
Michael Jacobs
22
1689
8
4
4
3.5
2.6
0.19
0.14
Josh Windass
38
2675
7
5
2
7.1
4.1
0.24
0.14
Gavin Massey
19
1170
6
5
1
1.6
2.4
0.13
0.18
Lee Evans
34
2828
6
1
5
2.6
4.9
0.08
0.16
Reece James
45
3972
6
3
3
3.4
9.7
0.08
0.22
Leon Clarke
15
838
5
3
2
4.6
0.6
0.49
0.06
William Grigg
17
895
5
4
1
5.1
0.9
0.52
0.09
Nathan Byrne
30
2349
4
1
3
1.4
1.7
0.05
0.06
Overall Performance by Player (P=Playing, NP=Not Playing)
Reece James tops the list for minutes played and tops the list for greatest performance impact for the Latics. Wigan had a Goal Difference per 90 mins (GDp90 P) of -0.25 when he was on the pitch compared to -1.07 without him (GDp90 NP). He’s another Chelsea loanee who’s had a great Championship season and another who might benefit from the transfer ban.
In recent weeks and months I’ve read a couple of snippets posted on Twitter about Sunderland and their expected goals (xG) performance, namely from Mark O’Haire, George Elek and Ted Knuston, which has caused quite a reaction from parts of the Black Cats fanbase.
For what it’s worth here’s my take on how I rate Sunderland, why they are overperforming xG and whether it is sustainable.
NOTE: For those not familiar with xG this is a metric to monitor the quality of goalscoring chances. A value between 0 and 1 is assigned based on the probability the chance will result in a goal. A 1 in 20 long range shot with have a probability of 5% (an xG of 0.05) whereas a penalty has a 3 in 4 expectancy and therefore an xG of 0.75.
Sunderland 2018/19 xG Performance
GF
GA
GD
Points
Rank
Actual Performance
42
20
22
44
2nd
Expected Performance
24
25
-1
28
16th
My xG model, like others, ranks Sunderland considerably lower than the 2nd place they currently find themselves in. The area in particular which sticks out is the goals scored. In simple terms they were expected to score 24 goals from the chances created so far this season but have scored a whopping 42.
On a match by match basis, Sunderland have only outcreated opponents based on xG in 9 of the 21 games with a clear split between performances at home and away.
Green = Win, Yellow = Draw, Red = Loss
At the Stadium of Light performances have been strong, winning xG on 7 of the 10 matches, and reflecting the high points haul collected. Away from the North East they have only won xG on 2 of the 11 occasions and it is here when Sunderland appear to be vulnerable. The Black Cats have consistently conceded chances on the road which the opponents have failed to capitalise on.
Looking purely at shot conversion rate, Sunderland’s opponent have the second lowest rate. At the other end of the pitch they are converting their chances into goals at the highest rate in the whole league. These numbers are why the Black Cats find themselves in the automatic spots heading into the festive period.
Those numbers look very good but as xG shows they are experiencing an overperformance particularly on the attacking side.
An xG overperformance in the short term is entirely feasible and actually quite common. Over the longer term one of two things tends to happen (i) the number of goals scored reverts back in line with expected goals or (ii) an increase in performance maintains the inflated level of goalscoring. Sunderland are an anomaly as we are now 22 games into the season (21 in Sunderland’s case) and so far, neither has happened.
So what’s driving this? Is Sunderland’s attack so superior to the remainder of the league that an xG model is not sufficiently capturing the quality of the squad?
Sunderland 2018/19 Shots
The first thing to point out is that Sunderland have been very accurate with the chances they have created.
Shots on Target %
Rank
Sunderland
42.2%
3rd
League Average
37.2%
They rank third for shots on target behind only high performing Luton and fellow xG overperforming Peterborough. This may be due to a superior quality of player but has been aided by the high proportion of shots taken from around the penalty spot area (25%) compared to the remainder of the league (20%).
The problem why their expected goals scored is low is the number of attempts Sunderland have taken.
Number of Attempts
Rank
Sunderland
223
21st
League Average
256
Only three teams have had fewer attempts. On the other hand, fellow promotion rivals Barnsley (321), Portsmouth (287) and Luton (281) all have a significantly higher number of attempts and hence are all rated superior by xG numbers. It may be that the attackers have been more selectively with chances, waiting for a better shooting position before pulling the trigger, something which won’t be captured in my xG model.
The resultant of so few shot attempts means Sunderland need to be clinical – and they have. As shown in the chart earlier no one is taking chances at the rate of the Black Cats.
Sunderland 2018/19 Attacking Performance
Josh Maja has been the standout performer in terms of goals with 12 in the league to date. Though a word of caution is that he has scored 8 goals more than expected using xG and is therefore experiencing a hot streak which is unlikely to continue. In addition, Maguire, Gooch, McGeady and Cattermole have added another 19 goals, a further 8 goals than expected using xG.
Looking at the players to score 10+ league goals this season Maja has the standout shot conversion.
Team
Player
Minutes
Shots
Goals
Shot Conversion
Gillingham
Thomas Eaves
1759
57
14
25%
Doncaster Rovers
John Marquis
1980
59
12
20%
Rochdale
Ian Henderson
1979
49
12
24%
Sunderland
Josh Maja
1347
29
12
41%
Plymouth Argyle
Freddie Ladapo
1770
53
11
21%
Charlton Athletic
Karlan Ahearne-Grant
1711
38
11
29%
Barnsley
Kieffer Moore
1656
66
11
17%
Charlton Athletic
Lyle Taylor
1862
51
10
20%
Luton Town
Elliot Lee
1593
61
10
16%
Peterborough United
Matthew Godden
1556
36
10
28%
12 goals from 29 attempts (41%) is remarkable as the other top goalscorers range between 16% and 29%. To maintain this goalscoring performance Josh Maja will have to be one the best finisher the league has ever seen. Very unlikely.
He’s also be aided by team mates scoring low probability chances at a higher rate than expected as shown by a selection of videos below.
Gillingham Away
George Honeyman and Max Power score in quick successions to put Sunderland 3-1 up.
Peterborough Home
Josh Maja scoring through multiple bodies to put Sunderland 1-0 up.
Southend Home
Chris Maguire scoring a long range screamer to put Sunderland 2-0 up.
Plymouth Away
Aiden McGeady this time scoring from outside the box to put Sunderland 1-0 up.
The numbers say to me that Sunderland will experience a dip in results, most likely away from home, starting this weekend in the big game away at table toppers Portsmouth.
As a devout follower of expected goals (or xG) AFC Wimbledon are providing the biggest headache of all 72 teams in the Football League. When looking at the League One table no one is expecting to see them in the top half. When Neal Ardley lost his job in November after six years in charge no one screamed that the team were in a false position in the table. Yet on my xG performance metrics the Dons should have the fourth highest points total behind only promotion chasing Luton, Barnsley and Portsmouth.
They actually find themselves in 23rd place, six points from safety. In a league with four relegation spots they are in real danger of returning to League Two so why are my performance numbers so different to the results?
NOTE: For those not familiar with xG this is a metric to monitor the quality of goalscoring chances. A value between 0 and 1 is assigned based on the probability the chance will result in a goal. A 1 in 20 long range shot with have a probability of 5% (an xG of 0.05) whereas a penalty has a 3 in 4 expectancy and therefore an xG of 0.75.
2018/19 AFC Wimbledon xG Performance by Match
Green = Win, Yellow = Draw, Red = Loss
The Dons started the season well with five points from the first three games and no goals conceded with impressive performances against both Fleetwood and Coventry. 13 defeats in the following 18 games and only one clean sheet shows how quickly fortunes can change at this level.
Since the early season shutouts, the Dons have consistently found them giving up chances in nearly all of their matches so the lack of a clean sheet comes as no surprise. Interestingly they have outcreated their opponents, based on xG, in 13 matches this season but have not managed to translate this into results. The problem being they are not scoring the volume of goals they should be with the chances created.
GF
GA
GD
Pts
Position
Actual Performance
15
31
-16
15
23rd
Expected Performance
28
22
6
32
4th
In total 13 goals fewer than expected have been scored and nine more goals than expected conceded. Try telling the Dons fans that the numbers say they should have a +6 goal difference rather than the actual -16! Expected points look particularly high at 32 and it’s unlikely many will have them as the fourth best team in the league.
2018/19 AFC Wimbledon Attacking Performance
The goalscoring underperformance noted is consistent amongst four of the five attacking threats with only Mitchell Pinnock scoring the amount of goals expected from the chances created. Joe Pigott is the club’s top goalscorer this season on four goals yet should have had another three. Pigott, Kwesi Appiah and Jake Jervis should have scored 14 league goals between them but have only hit the net six times.
2018/19 League One Attacking Performance
In comparison to the rest of the league the trio stick out amongst the biggest underperformers. An underperformance against xG in the short term is usually attributed to a combination of poor finishing, good goalkeeping and bad luck. As the season progresses if these chances keep coming the current trend should (in theory) reverse and the goals will follow.
AFC Wimbledon Big Chances Missed
Due to the low scoring nature of football games are often decided by the odd goal and therefore it is imperative big chances are taken in order to have a successful season. The Dons have missed a number of big chances as rated by my xG performance model with a selection shown below using the AFC Wimbledon TV YouTube channel:
Home to Coventry (Drew 0-0). Tom Soares’ weak shot eventually saved by the goalkeeper.
Home to Sunderland (Lost 2-1). Adedeji Oshilaja’s chance at 1-1 in the six yard box shooting over the bar.
Away to Burton (Lost 3-0). Joe Pigott’s has two big chances chances at 1-0 down. Firstly a close range shot that hits the bar, followed by a header that goes over the bar.
Away to Plymouth (Lost 1-0). Jake Jervis’ shot at 0-0 when a simple tap in was all that was needed.
Had the Dons been fortunate enough to score all of these chances at the game state then they could have had an additional 11 points and be placed in mid table.
Looking Ahead
Wally Downes was appointed as the successor to Ardley at the start of the month tasked with securing survival. The Dons will need to start scoring these big chances if that is to happen. However, don’t be surprised if they end up pulling themselves out of the relegation zone in the coming months. Expected goals is a strong indicator of future performance so it should be onwards and upwards for the curious case that is AFC Wimbledon.
It’s incredible to think about the ten years that followed Portsmouth’s 2008 FA Cup win. Administration and three relegations in four years consigned the south coast outfit to the bottom tier of the EFL with little hope of the tide turning. The astute appointment of Paul Cook in May 2015 was just what was needed to lay the foundations the club is successfully building on now. The second and final season of his spell ended in promotion to League One as champions.
Kenny Jackett was the man tasked with building on those foundations and Portsmouth finished last season in 8th, five points from the playoffs. It is remarkable that the season felt a slight disappointed with expectations this was a side capable of more. For a team not achieving promotion, recruitment and forward planning must be easier without the rigmarole of the playoffs. Three of the four playoff teams would ultimately remain in the league but would need to draw multiple wish lists should promotion be achieved and therefore a higher calibre of player needed. Not a problem Portsmouth would have had.
2017/18 League One Table
Based on expected goals (or xG) Portsmouth should have scored 57 goals, exactly what was achieved. The problem was at the other end of the pitch, 12 more goals conceded than expected hampered the points haul and prevented the playoff place. On my xG model Portsmouth were fourth strongest side in the league with the three superior teams (Wigan, Rotherham and Blackburn) all achieving promotion.
For those not familiar with xG this is a metric to monitor the quality of goalscoring chances. A value between 0 and 1 is assigned based on the probability the chance will result in a goal. A 1 in 20 long range shot with have a probability of 5% (an xG of 0.05) whereas a penalty has a 3 in 4 expectancy and therefore an xG of 0.75.
Team
G
W
D
L
GF
GA
Pts
xGF
xGA
xPts
Wigan Athletic
46
29
11
6
89
29
98
71
36
83.4
Blackburn Rovers
46
28
12
6
82
40
96
63
45
72.1
Shrewsbury Town
46
25
12
9
60
39
87
51
50
62.5
Rotherham United
46
24
7
15
73
53
79
66
48
74.1
Scunthorpe United
46
19
17
10
65
50
74
55
55
63.6
Charlton Athletic
46
20
11
15
58
51
71
54
52
63.7
Plymouth Argyle
46
19
11
16
58
59
68
49
61
56.5
Portsmouth
46
20
6
20
57
56
66
57
44
70.7
Peterborough United
46
17
13
16
68
60
64
59
62
61.2
Southend United
46
17
12
17
58
62
63
61
60
63.4
Bradford City
46
18
9
19
57
67
63
56
57
62.3
Blackpool
46
15
15
16
60
55
60
58
51
66.4
Bristol Rovers
46
16
11
19
60
66
59
56
56
62.6
Fleetwood Town
46
16
9
21
59
68
57
45
51
59.0
Doncaster Rovers
46
13
17
16
52
52
56
49
48
62.9
Gillingham
46
13
17
16
50
55
56
50
63
55.8
Oxford United
46
15
11
20
61
66
56
60
63
59.9
AFC Wimbledon
46
13
14
19
47
58
53
49
51
62.2
Walsall
46
13
13
20
53
66
52
46
60
53.7
Rochdale
46
11
18
17
49
57
51
57
55
63.8
Oldham Athletic
46
11
17
18
58
75
50
54
60
59.3
Northampton Town
46
12
11
23
43
77
47
47
67
52.6
MK Dons
46
11
12
23
43
69
45
48
61
54.7
Bury
46
8
12
26
41
71
36
57
61
61.3
Expectations increased ahead of the 2018/19 season with Portsmouth starting 11/1 joint third favourites behind Sunderland and Barnsley. It was a surprise they did not start the season at shorter odds though both of the teams mentioned were relegated from the Championship with squads of a higher quality than typical of League One.
2018/19 League One Table
However, with almost half of the season gone it is Portsmouth who currently lead the way. Pompey are the third strongest team based on expected points per game (another performance metric using expected goals) ahead all but Barnsley and Luton.
The advantage for Jackett’s outfit now is that they already have points on the board. Four points ahead of nearest challengers Sunderland and even more ahead of the two aforementioned stronger teams based on xG performance. This may prove to be an unsurmountable gap for the chasers.
My xG model ranks Sunderland and Peterborough particularly poorly but we’ll save those two for another day!
G
W
D
L
GF
GA
Pts
xGF
xGA
xPts
Portsmouth
19
13
5
1
32
15
44
27
20
30.3
Sunderland
19
11
7
1
39
18
40
22
23
25.0
Luton Town
20
11
5
4
39
21
38
30
20
33.5
Peterborough United
20
11
5
4
36
24
38
24
29
23.6
Barnsley
19
10
5
4
34
19
35
30
18
32.9
Charlton Athletic
19
10
4
5
31
22
34
27
26
26.9
Doncaster Rovers
20
9
5
6
30
26
32
28
25
29.6
Blackpool
19
8
7
4
23
18
31
25
21
27.9
Coventry City
20
8
5
7
21
23
29
26
24
29.1
Wycombe Wanderers
20
7
7
6
29
28
28
22
25
25.6
Accrington Stanley
20
7
7
6
22
24
28
26
26
27.9
Fleetwood Town
20
7
6
7
28
21
27
18
24
22.9
Walsall
20
7
6
7
21
28
27
23
32
22.2
Southend United
20
8
2
10
25
26
26
24
22
28.2
Shrewsbury Town
20
6
6
8
23
25
24
26
19
30.7
Burton Albion
19
7
3
9
24
27
24
27
22
29.0
Rochdale
20
6
5
9
27
38
23
28
28
26.8
Gillingham
20
6
3
11
29
34
21
21
30
23.2
Oxford United
20
5
6
9
25
31
21
21
22
26.9
Scunthorpe United
20
5
6
9
29
42
21
23
30
23.2
Bristol Rovers
20
4
5
11
17
21
17
25
21
30.4
Plymouth Argyle
20
4
4
12
21
37
16
21
35
20.4
AFC Wimbledon
20
4
2
14
14
30
14
27
20
31.0
Bradford City
20
4
2
14
15
36
14
20
32
21.0
2018/19 Portsmouth xG Performance by Match
It’s ominous for the title rivals that Pompey seems to be in the best form they have been all season. Since the surprise defeat at home to Gillingham at the start of October performances have become much more consistent outcreating opponents in all but one of the matches. Results have matched with 17 points taken from the 8 matches.
Green = Win, Yellow = Draw, Red = Loss
The biggest improvement has been the reduction in chances given away. In games against Fleetwood, Burton and Accrington the opposition were limited to very little so it can be considered unfortunate that two of the games ended in draws.
The defender who stands out on my xG performance is Nathan Thompson, the right back signed from Swindon on a free transfer in the summer of 2017. He only played once in the first five games but has been integral since.
Minutes
GF per 90
GA per 90
xGF per 90
xGA per 90
Portsmouth 2018/19
1710
1.7
0.8
1.4
1.0
with Nathan Thompson
1091
1.6
0.8
1.5
0.8
without Thompson
619
1.7
0.7
1.4
1.5
Whilst in the team expected goals conceded per match are 0.8 the same as actual goals conceded per match. However without him they were expected to concede twice as many. They can be considered fortunate actual goals conceded were not higher when he did not play.
2018/2019 Portsmouth Attacking Performance
In attack Kenny Jackett has favoured Oliver Hawkins leading the line with Ronan Curtis, Gareth Evans and Jamal Lowe providing support behind in a 4-2-3-1 formation. Goals have been evenly spread amongst the four providing Pompey fans comfort the team does not have an over reliance on one player in the goalscoring department.
Should Jackett turn to the bench then step forward Brett Pitman. He played 75% of the minutes last season but has only featured in 30% of the minutes this season. He’s scored three goals (and provided three assists) in 500 minutes and compares favourably to the strikers both at Fratton Park and across League One.
His experience will be vital for the run-in and it would be no surprise to see him come off the bench to score some match winning goals, in what will hopefully prove to be a successful promotion season for fans. Pompey are back and heading for the second rung of English football.
Note:
For those who’s attention has been caught by the league’s largest overperformer in the chart above, the one with roughly 0.8 goals per 90 but only 0.3 xG – it’s Sunderland’s Josh Maja. This is one of the reasons why my xG model rates Sunderland so poorly. It’s unlikely his goalscoring rate will continue so unless the returning Charlie Wyke can provide the goals they may find Luton and/or Barnsley breathing down their neck more closely after the busy festive period.