It’s incredible to think about the ten years that followed Portsmouth’s 2008 FA Cup win. Administration and three relegations in four years consigned the south coast outfit to the bottom tier of the EFL with little hope of the tide turning. The astute appointment of Paul Cook in May 2015 was just what was needed to lay the foundations the club is successfully building on now. The second and final season of his spell ended in promotion to League One as champions.
Kenny Jackett was the man tasked with building on those foundations and Portsmouth finished last season in 8th, five points from the playoffs. It is remarkable that the season felt a slight disappointed with expectations this was a side capable of more. For a team not achieving promotion, recruitment and forward planning must be easier without the rigmarole of the playoffs. Three of the four playoff teams would ultimately remain in the league but would need to draw multiple wish lists should promotion be achieved and therefore a higher calibre of player needed. Not a problem Portsmouth would have had.
2017/18 League One Table
Based on expected goals (or xG) Portsmouth should have scored 57 goals, exactly what was achieved. The problem was at the other end of the pitch, 12 more goals conceded than expected hampered the points haul and prevented the playoff place. On my xG model Portsmouth were fourth strongest side in the league with the three superior teams (Wigan, Rotherham and Blackburn) all achieving promotion.
For those not familiar with xG this is a metric to monitor the quality of goalscoring chances. A value between 0 and 1 is assigned based on the probability the chance will result in a goal. A 1 in 20 long range shot with have a probability of 5% (an xG of 0.05) whereas a penalty has a 3 in 4 expectancy and therefore an xG of 0.75.
| Team | G | W | D | L | GF | GA | Pts | xGF | xGA | xPts |
| Wigan Athletic | 46 | 29 | 11 | 6 | 89 | 29 | 98 | 71 | 36 | 83.4 |
| Blackburn Rovers | 46 | 28 | 12 | 6 | 82 | 40 | 96 | 63 | 45 | 72.1 |
| Shrewsbury Town | 46 | 25 | 12 | 9 | 60 | 39 | 87 | 51 | 50 | 62.5 |
| Rotherham United | 46 | 24 | 7 | 15 | 73 | 53 | 79 | 66 | 48 | 74.1 |
| Scunthorpe United | 46 | 19 | 17 | 10 | 65 | 50 | 74 | 55 | 55 | 63.6 |
| Charlton Athletic | 46 | 20 | 11 | 15 | 58 | 51 | 71 | 54 | 52 | 63.7 |
| Plymouth Argyle | 46 | 19 | 11 | 16 | 58 | 59 | 68 | 49 | 61 | 56.5 |
| Portsmouth | 46 | 20 | 6 | 20 | 57 | 56 | 66 | 57 | 44 | 70.7 |
| Peterborough United | 46 | 17 | 13 | 16 | 68 | 60 | 64 | 59 | 62 | 61.2 |
| Southend United | 46 | 17 | 12 | 17 | 58 | 62 | 63 | 61 | 60 | 63.4 |
| Bradford City | 46 | 18 | 9 | 19 | 57 | 67 | 63 | 56 | 57 | 62.3 |
| Blackpool | 46 | 15 | 15 | 16 | 60 | 55 | 60 | 58 | 51 | 66.4 |
| Bristol Rovers | 46 | 16 | 11 | 19 | 60 | 66 | 59 | 56 | 56 | 62.6 |
| Fleetwood Town | 46 | 16 | 9 | 21 | 59 | 68 | 57 | 45 | 51 | 59.0 |
| Doncaster Rovers | 46 | 13 | 17 | 16 | 52 | 52 | 56 | 49 | 48 | 62.9 |
| Gillingham | 46 | 13 | 17 | 16 | 50 | 55 | 56 | 50 | 63 | 55.8 |
| Oxford United | 46 | 15 | 11 | 20 | 61 | 66 | 56 | 60 | 63 | 59.9 |
| AFC Wimbledon | 46 | 13 | 14 | 19 | 47 | 58 | 53 | 49 | 51 | 62.2 |
| Walsall | 46 | 13 | 13 | 20 | 53 | 66 | 52 | 46 | 60 | 53.7 |
| Rochdale | 46 | 11 | 18 | 17 | 49 | 57 | 51 | 57 | 55 | 63.8 |
| Oldham Athletic | 46 | 11 | 17 | 18 | 58 | 75 | 50 | 54 | 60 | 59.3 |
| Northampton Town | 46 | 12 | 11 | 23 | 43 | 77 | 47 | 47 | 67 | 52.6 |
| MK Dons | 46 | 11 | 12 | 23 | 43 | 69 | 45 | 48 | 61 | 54.7 |
| Bury | 46 | 8 | 12 | 26 | 41 | 71 | 36 | 57 | 61 | 61.3 |
Expectations increased ahead of the 2018/19 season with Portsmouth starting 11/1 joint third favourites behind Sunderland and Barnsley. It was a surprise they did not start the season at shorter odds though both of the teams mentioned were relegated from the Championship with squads of a higher quality than typical of League One.
2018/19 League One Table
However, with almost half of the season gone it is Portsmouth who currently lead the way. Pompey are the third strongest team based on expected points per game (another performance metric using expected goals) ahead all but Barnsley and Luton.
The advantage for Jackett’s outfit now is that they already have points on the board. Four points ahead of nearest challengers Sunderland and even more ahead of the two aforementioned stronger teams based on xG performance. This may prove to be an unsurmountable gap for the chasers.
My xG model ranks Sunderland and Peterborough particularly poorly but we’ll save those two for another day!
| G | W | D | L | GF | GA | Pts | xGF | xGA | xPts | |
| Portsmouth | 19 | 13 | 5 | 1 | 32 | 15 | 44 | 27 | 20 | 30.3 |
| Sunderland | 19 | 11 | 7 | 1 | 39 | 18 | 40 | 22 | 23 | 25.0 |
| Luton Town | 20 | 11 | 5 | 4 | 39 | 21 | 38 | 30 | 20 | 33.5 |
| Peterborough United | 20 | 11 | 5 | 4 | 36 | 24 | 38 | 24 | 29 | 23.6 |
| Barnsley | 19 | 10 | 5 | 4 | 34 | 19 | 35 | 30 | 18 | 32.9 |
| Charlton Athletic | 19 | 10 | 4 | 5 | 31 | 22 | 34 | 27 | 26 | 26.9 |
| Doncaster Rovers | 20 | 9 | 5 | 6 | 30 | 26 | 32 | 28 | 25 | 29.6 |
| Blackpool | 19 | 8 | 7 | 4 | 23 | 18 | 31 | 25 | 21 | 27.9 |
| Coventry City | 20 | 8 | 5 | 7 | 21 | 23 | 29 | 26 | 24 | 29.1 |
| Wycombe Wanderers | 20 | 7 | 7 | 6 | 29 | 28 | 28 | 22 | 25 | 25.6 |
| Accrington Stanley | 20 | 7 | 7 | 6 | 22 | 24 | 28 | 26 | 26 | 27.9 |
| Fleetwood Town | 20 | 7 | 6 | 7 | 28 | 21 | 27 | 18 | 24 | 22.9 |
| Walsall | 20 | 7 | 6 | 7 | 21 | 28 | 27 | 23 | 32 | 22.2 |
| Southend United | 20 | 8 | 2 | 10 | 25 | 26 | 26 | 24 | 22 | 28.2 |
| Shrewsbury Town | 20 | 6 | 6 | 8 | 23 | 25 | 24 | 26 | 19 | 30.7 |
| Burton Albion | 19 | 7 | 3 | 9 | 24 | 27 | 24 | 27 | 22 | 29.0 |
| Rochdale | 20 | 6 | 5 | 9 | 27 | 38 | 23 | 28 | 28 | 26.8 |
| Gillingham | 20 | 6 | 3 | 11 | 29 | 34 | 21 | 21 | 30 | 23.2 |
| Oxford United | 20 | 5 | 6 | 9 | 25 | 31 | 21 | 21 | 22 | 26.9 |
| Scunthorpe United | 20 | 5 | 6 | 9 | 29 | 42 | 21 | 23 | 30 | 23.2 |
| Bristol Rovers | 20 | 4 | 5 | 11 | 17 | 21 | 17 | 25 | 21 | 30.4 |
| Plymouth Argyle | 20 | 4 | 4 | 12 | 21 | 37 | 16 | 21 | 35 | 20.4 |
| AFC Wimbledon | 20 | 4 | 2 | 14 | 14 | 30 | 14 | 27 | 20 | 31.0 |
| Bradford City | 20 | 4 | 2 | 14 | 15 | 36 | 14 | 20 | 32 | 21.0 |
2018/19 Portsmouth xG Performance by Match
It’s ominous for the title rivals that Pompey seems to be in the best form they have been all season. Since the surprise defeat at home to Gillingham at the start of October performances have become much more consistent outcreating opponents in all but one of the matches. Results have matched with 17 points taken from the 8 matches.
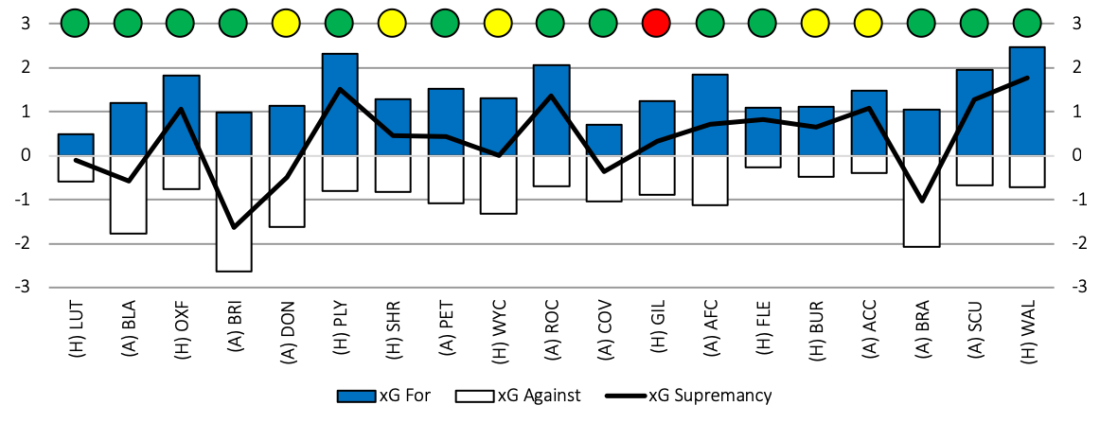
The biggest improvement has been the reduction in chances given away. In games against Fleetwood, Burton and Accrington the opposition were limited to very little so it can be considered unfortunate that two of the games ended in draws.
The defender who stands out on my xG performance is Nathan Thompson, the right back signed from Swindon on a free transfer in the summer of 2017. He only played once in the first five games but has been integral since.
| Minutes | GF per 90 | GA per 90 | xGF per 90 | xGA per 90 | |
| Portsmouth 2018/19 | 1710 | 1.7 | 0.8 | 1.4 | 1.0 |
| with Nathan Thompson | 1091 | 1.6 | 0.8 | 1.5 | 0.8 |
| without Thompson | 619 | 1.7 | 0.7 | 1.4 | 1.5 |
Whilst in the team expected goals conceded per match are 0.8 the same as actual goals conceded per match. However without him they were expected to concede twice as many. They can be considered fortunate actual goals conceded were not higher when he did not play.
2018/2019 Portsmouth Attacking Performance
In attack Kenny Jackett has favoured Oliver Hawkins leading the line with Ronan Curtis, Gareth Evans and Jamal Lowe providing support behind in a 4-2-3-1 formation. Goals have been evenly spread amongst the four providing Pompey fans comfort the team does not have an over reliance on one player in the goalscoring department.
Should Jackett turn to the bench then step forward Brett Pitman. He played 75% of the minutes last season but has only featured in 30% of the minutes this season. He’s scored three goals (and provided three assists) in 500 minutes and compares favourably to the strikers both at Fratton Park and across League One. 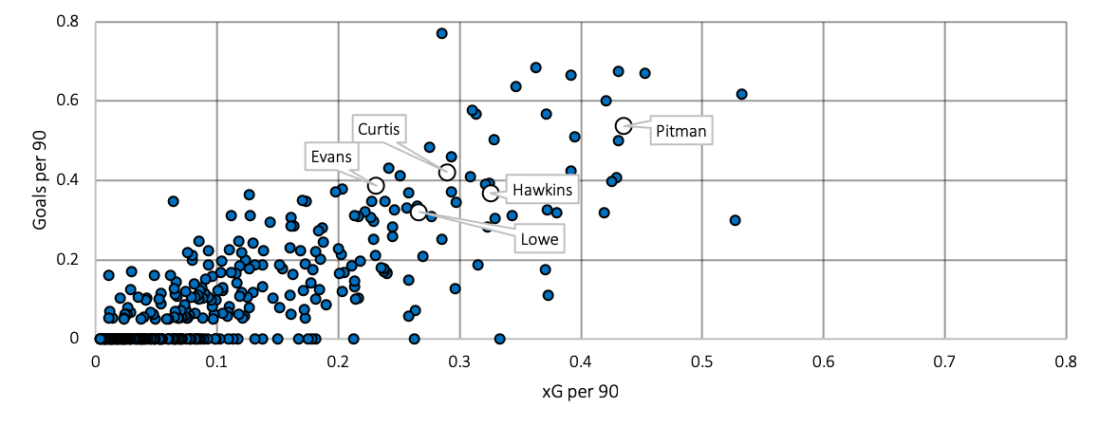
His experience will be vital for the run-in and it would be no surprise to see him come off the bench to score some match winning goals, in what will hopefully prove to be a successful promotion season for fans. Pompey are back and heading for the second rung of English football.
Note:
For those who’s attention has been caught by the league’s largest overperformer in the chart above, the one with roughly 0.8 goals per 90 but only 0.3 xG – it’s Sunderland’s Josh Maja. This is one of the reasons why my xG model rates Sunderland so poorly. It’s unlikely his goalscoring rate will continue so unless the returning Charlie Wyke can provide the goals they may find Luton and/or Barnsley breathing down their neck more closely after the busy festive period.
