Another action packed Championship season draws to a close. Norwich City, Sheffield United and one other will playing Premier League football season, whereas at the other end Bolton Wanderers, Ipswich Town and Rotherham United faced the dreaded relegation into the third tier of English football.
Here’s my review of the season utilising everybody’s favourite football analytical metric – Expected Goals (or xG).
NOTE: For those not familiar with xG this is a metric to monitor the quality of goalscoring chances. A value between 0 and 1 is assigned based on the probability the chance will result in a goal. A 1 in 20 long range shot with have a probability of 5% (an xG of 0.05) whereas a penalty has a 3 in 4 expectancy and therefore an xG of 0.75.
League Table
Over the course of the season my xG model has aligned very closely to the actual table. The top three are consistent across both albeit I rate Leeds United as the strongest team in the league. It’s hard to argue Sheffield United (xG ranked 2nd) and Norwich City (3rd) haven’t deserved automatic promotion with their contrasting styles though.
West Bromwich Albion (4th) and Aston Villa (5th) are worthy of their play off spots, however Derby County (15th) appear to have been fortunate.
At the bottom it suggests Millwall (7th) should have been one place outside of the playoffs rather than relegation. The bottom three of Rotherham United (21st), Bolton Wanderers (22nd) and Ipswich Town (24th) all performed poorly with Reading (23rd) fortunate to survive.
It’s worth noting Rotherham United look considerably better on my xG model than the other two and they would be my pick to perform best next season at this early stage albeit both Bolton and Ipswich are likely to have greater budgets in the summer.
| Team | GF | GA | GD | Pts | xGF | xGA | xGD | xPts | Rank | |
| 1 | Norwich City | 93 | 57 | 36 | 94 | 76 | 59 | 17 | 72.3 | 3 |
| 2 | Sheffield United | 78 | 41 | 37 | 89 | 75 | 46 | 29 | 78.6 | 2 |
| 3 | Leeds United | 73 | 50 | 23 | 83 | 80 | 43 | 37 | 82.2 | 1 |
| 4 | West Bromwich Albion | 87 | 62 | 25 | 80 | 76 | 63 | 13 | 69.2 | 4 |
| 5 | Aston Villa | 82 | 61 | 21 | 76 | 75 | 62 | 13 | 69.2 | 5 |
| 6 | Derby County | 69 | 54 | 15 | 74 | 59 | 65 | -6 | 61.0 | 15 |
| 7 | Middlesbrough | 49 | 41 | 8 | 73 | 68 | 63 | 5 | 66.4 | 9 |
| 8 | Bristol City | 59 | 53 | 6 | 70 | 64 | 61 | 3 | 65.2 | 11 |
| 9 | Nottingham Forest | 61 | 54 | 7 | 66 | 59 | 67 | -8 | 60.4 | 16 |
| 10 | Swansea City | 65 | 62 | 3 | 65 | 69 | 60 | 9 | 66.5 | 8 |
| 11 | Brentford | 73 | 59 | 14 | 64 | 66 | 52 | 14 | 68.8 | 6 |
| 12 | Sheffield Wednesday | 60 | 62 | -2 | 64 | 58 | 65 | -7 | 59.2 | 19 |
| 13 | Hull City | 66 | 68 | -2 | 62 | 59 | 69 | -10 | 56.6 | 20 |
| 14 | Preston North End | 67 | 67 | 0 | 61 | 62 | 65 | -3 | 59.5 | 12 |
| 15 | Blackburn Rovers | 64 | 69 | -5 | 60 | 67 | 68 | -1 | 63.0 | 18 |
| 16 | Stoke City | 45 | 52 | -7 | 55 | 52 | 58 | -6 | 60.2 | 13 |
| 17 | Birmingham City | 64 | 58 | 6 | 52 | 60 | 59 | 1 | 64.1 | 17 |
| 18 | Wigan Athletic | 51 | 64 | -13 | 52 | 68 | 69 | 0 | 62.2 | 14 |
| 19 | Queens Park Rangers | 53 | 71 | -18 | 51 | 64 | 62 | 1 | 65.4 | 10 |
| 20 | Reading | 49 | 66 | -17 | 47 | 49 | 85 | -36 | 44.6 | 23 |
| 21 | Millwall | 48 | 64 | -16 | 44 | 69 | 58 | 10 | 67.7 | 7 |
| 22 | Rotherham United | 52 | 83 | -31 | 40 | 64 | 78 | -13 | 55.5 | 21 |
| 23 | Bolton Wanderers | 29 | 78 | -49 | 32 | 44 | 68 | -24 | 46.8 | 22 |
| 24 | Ipswich Town | 36 | 77 | -41 | 31 | 46 | 83 | -37 | 44.2 | 24 |
The remainder of the article is a club-by-club review focusing on five areas:
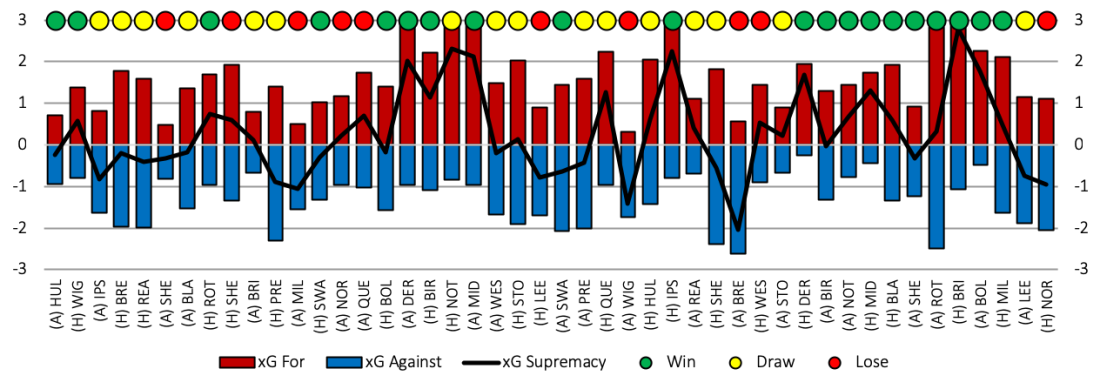
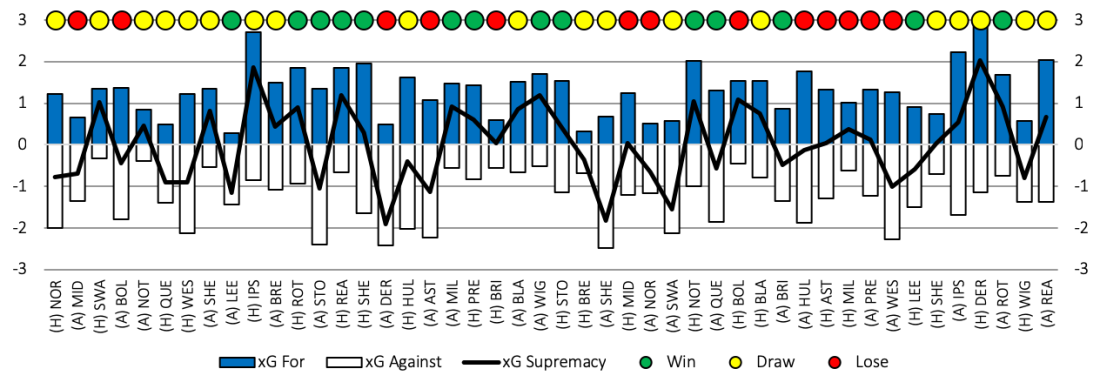
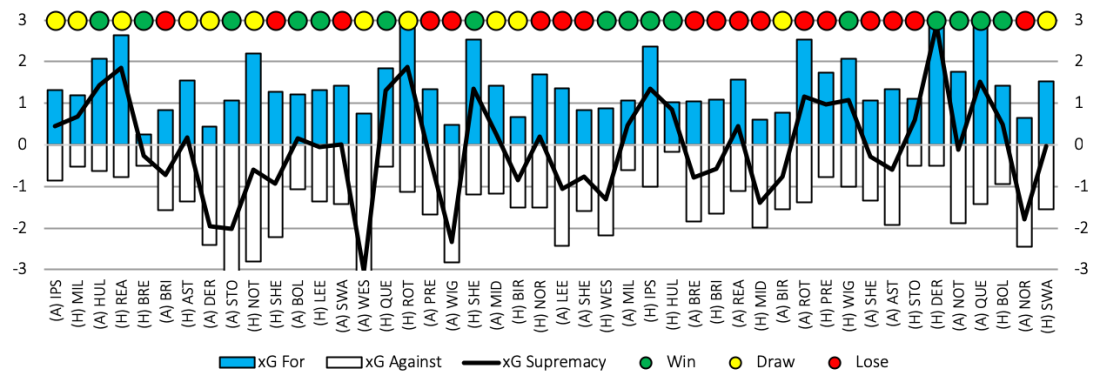
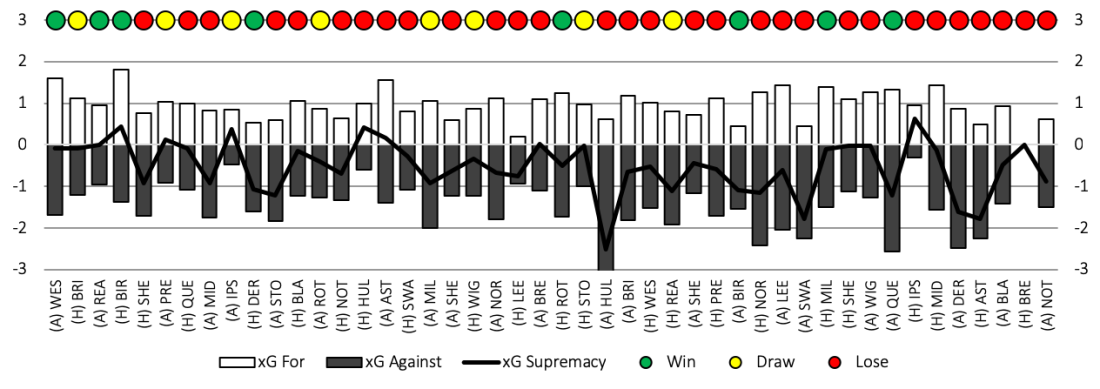
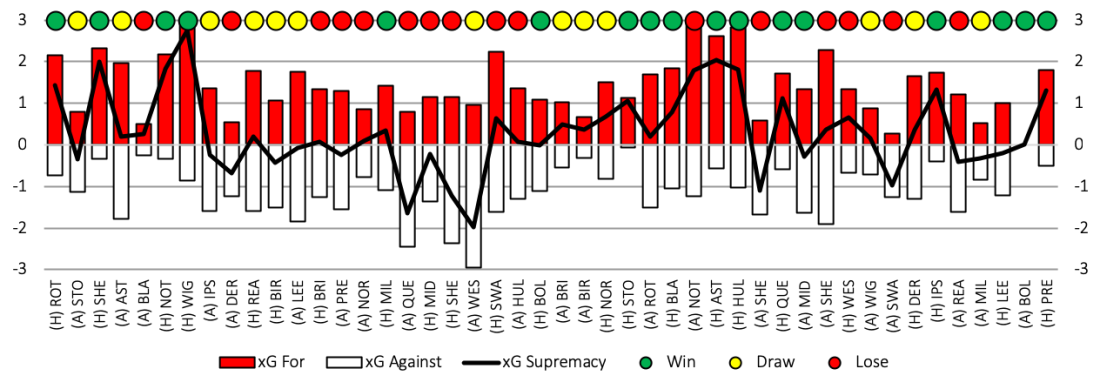
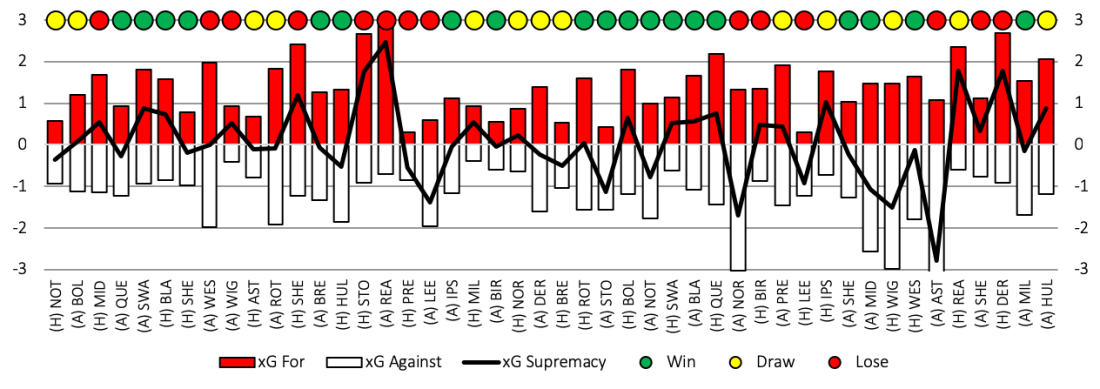
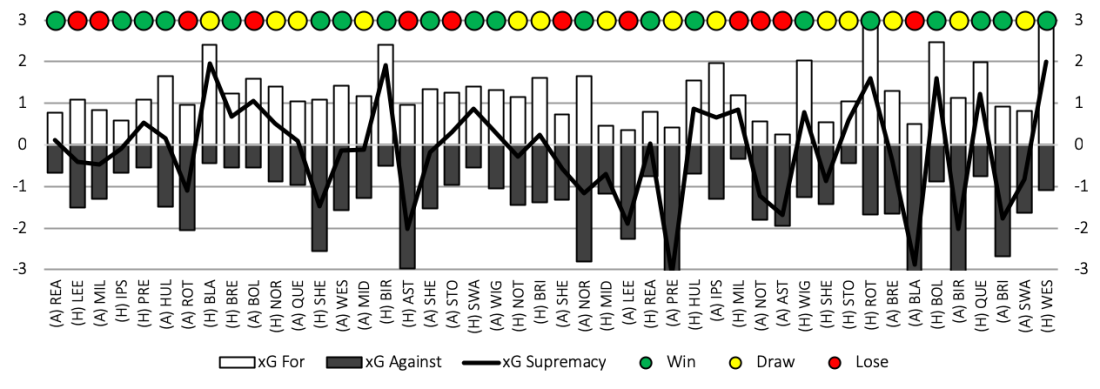
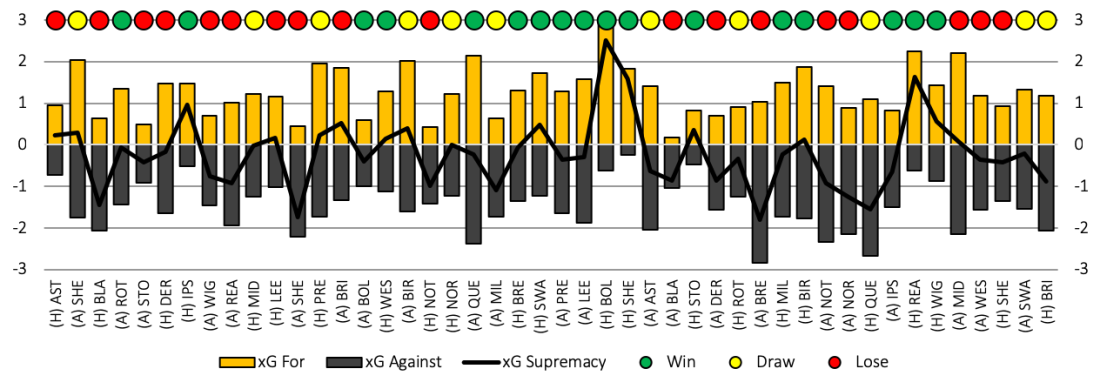
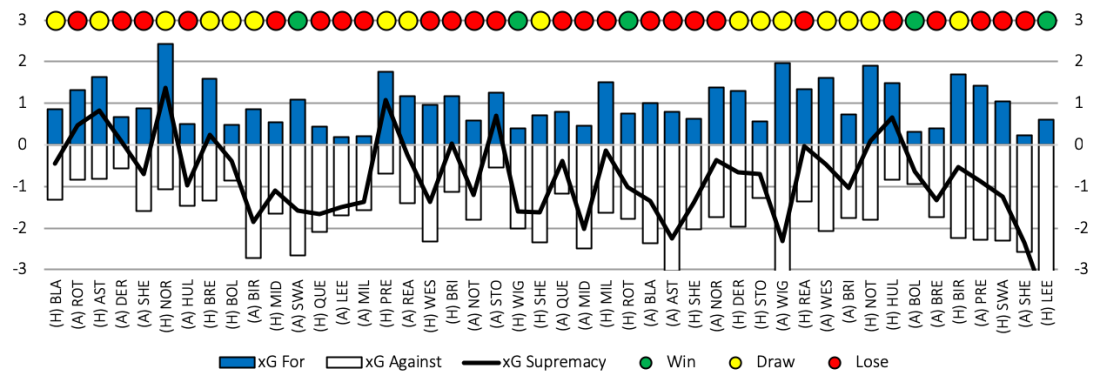
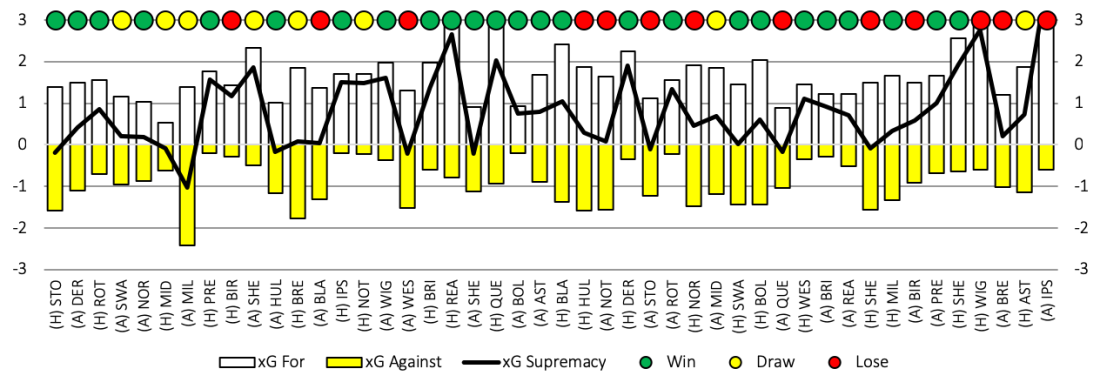
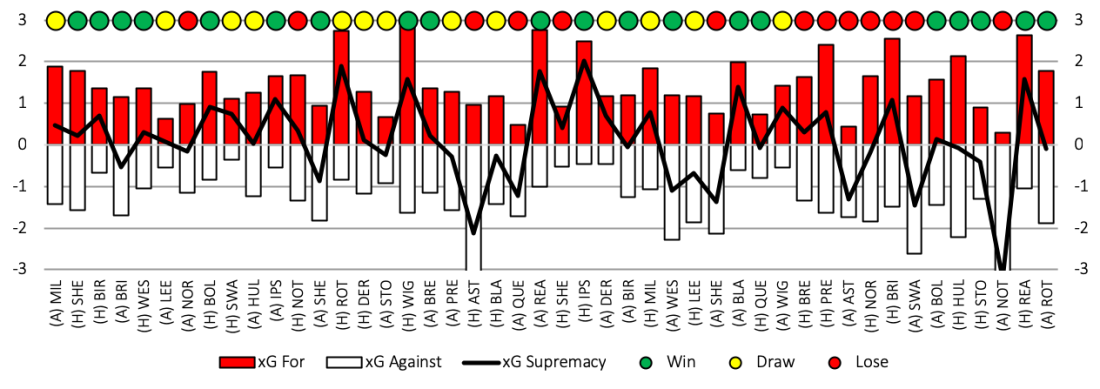
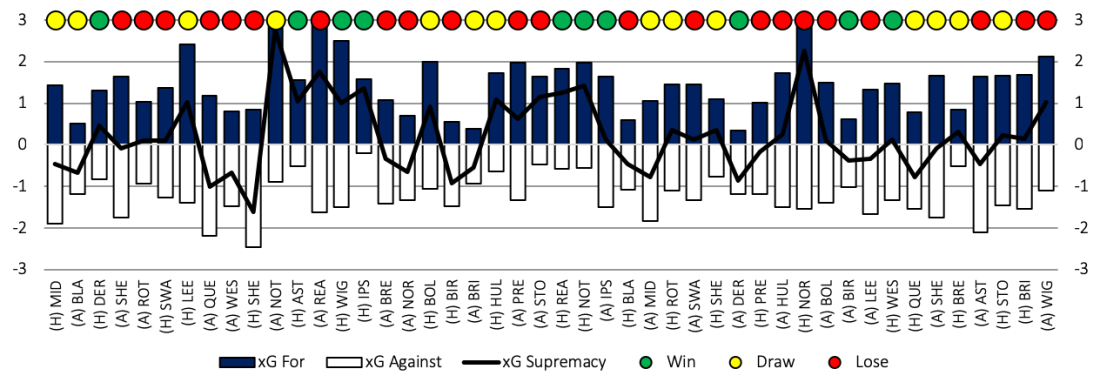
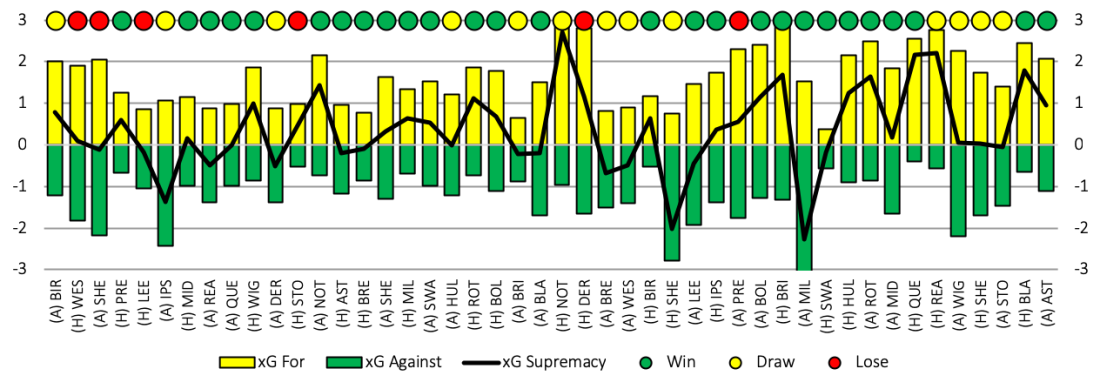
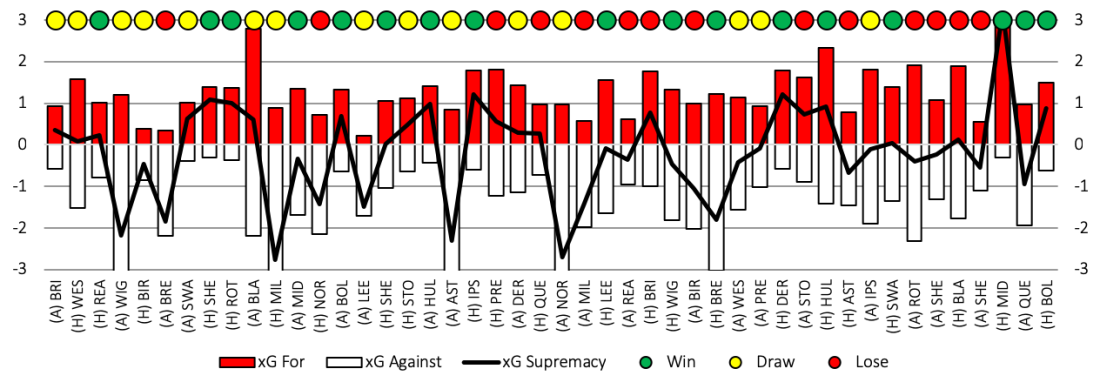
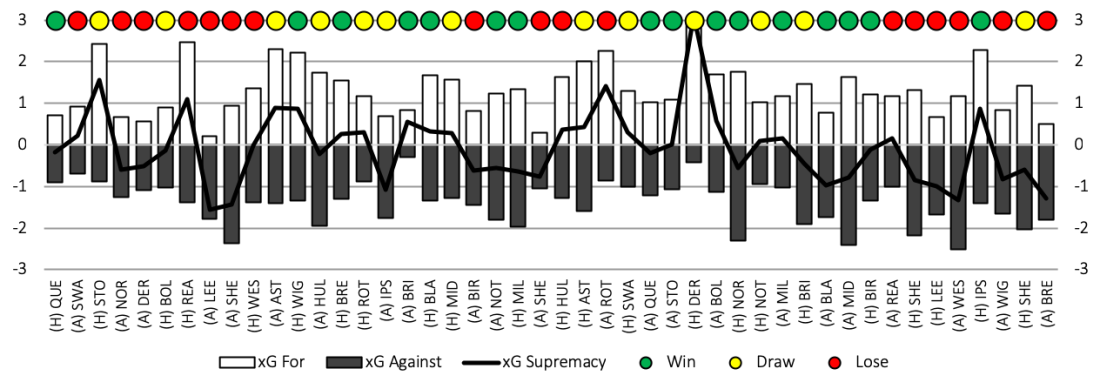
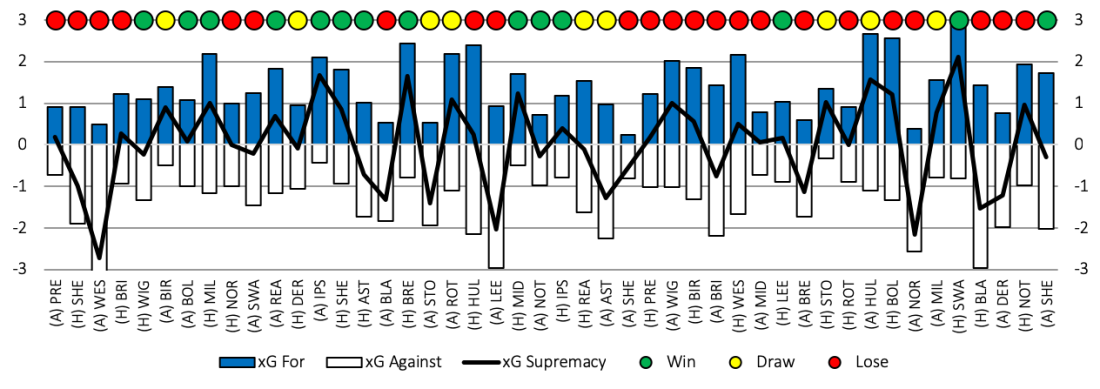
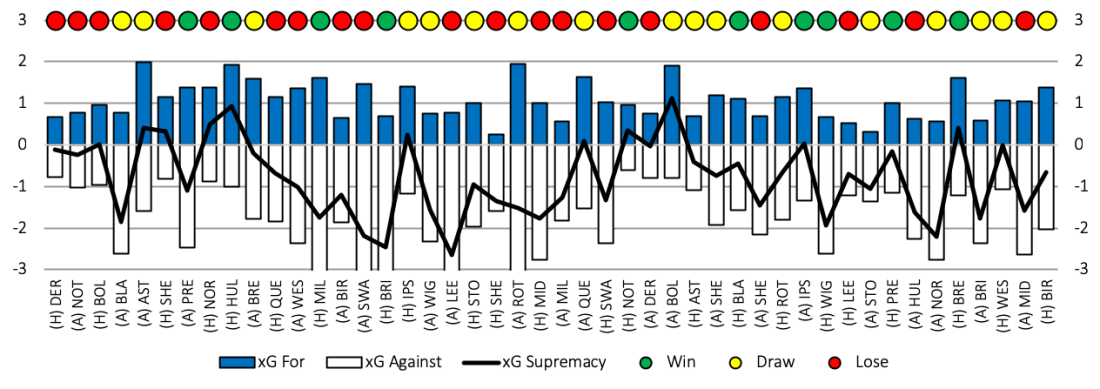
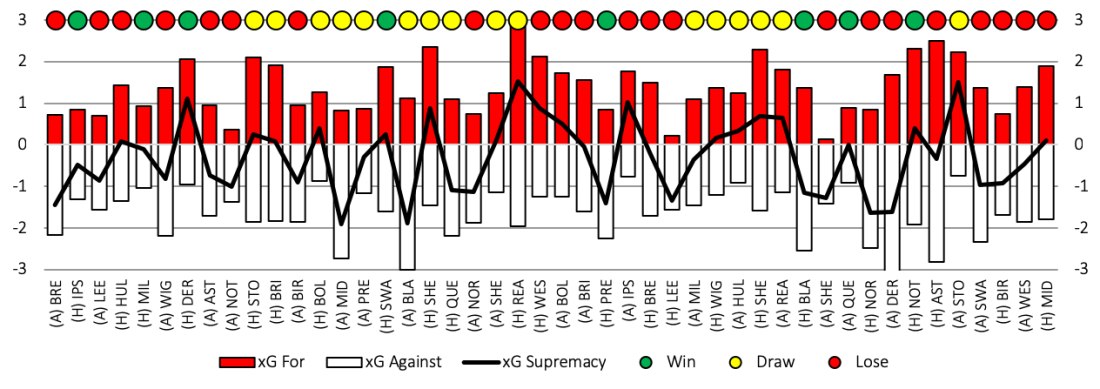
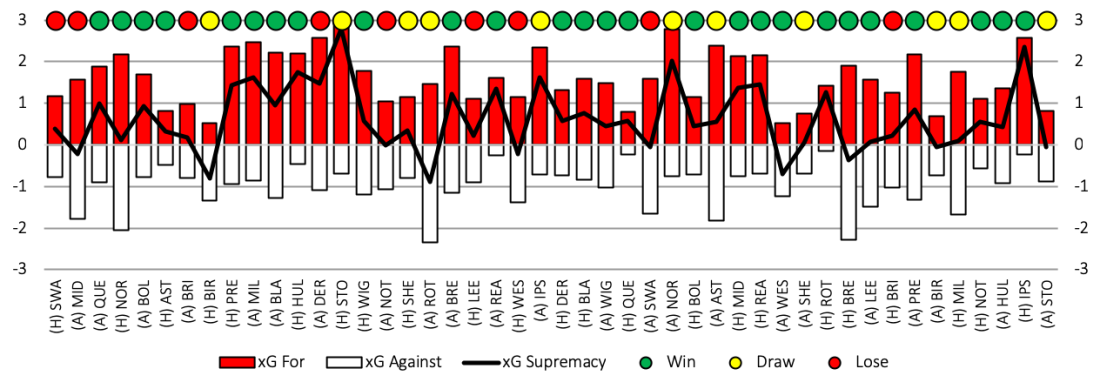
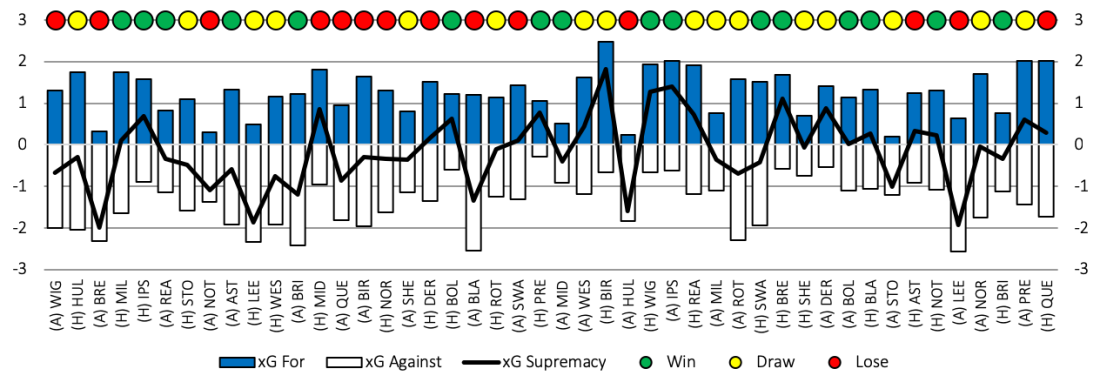
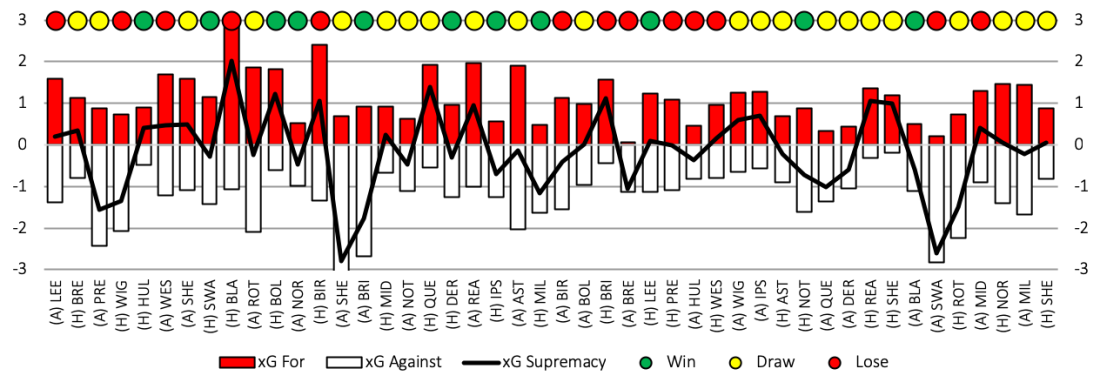
- Performance by Match – A graphical representation of the xG created and conceded by match day. Useful to highlight sections of the season the team performed particularly well/poor. The colour coding at the top indicating the actual match result.
- Performance by Formation – A table to show actual and expected points based on the starting formation used. Useful context to see teams which have a distinct set up and which teams tinkered regularly during the season.
- Performance by Manager – A table to show actual and expected points by manager for those teams who made a change during the season.
- Attacking Performance by Player – A table to show actual and expected goal involvement by player.
- Overall Performance by Player – A new concept to me which attempts to demonstrate the influence a player has to the team by assessing the actual and expected performance when the player featured and when the player was absent.
Aston Villa (Actual 5th, xG 5th)
Performance by Match
Performance by Formation
| Starting Formation | Matches | Pts p90 | xPts p90 |
| 4-3-3 | 9 | 1.9 | 1.8 |
| 4-4-1-1 | 9 | 1.8 | 1.6 |
| 4-1-4-1 | 17 | 1.6 | 1.4 |
| Unknown | 6 | 1.5 | 1.2 |
| 4-4-2 (Classic) | 3 | 1.3 | 1.7 |
| 4-2-3-1 | 2 | 1.0 | 1.1 |
Performance by Manager
Dean Smith had the exact impact the Villa fans would have hoped for. Still would have fallen just short if Smith had been in charge for the whole season.
| Managerial Record | Matches | Pts p90 | Rank | xPts p90 | Rank |
| Steve Bruce | 11 | 1.4 | 13th | 1.3 | 18th |
| Kevin MacDonald | 1 | 0.0 | 0.7 | ||
| Dean Smith | 34 | 1.8 | 4th | 1.6 | 3rd |
Attacking Performance by Player
| Player | Apps | Mins | GI | G | A | xG | xA | xGp90 | xAp90 |
| Tammy Abraham | 37 | 3150 | 28 | 25 | 3 | 20.9 | 2.5 | 0.60 | 0.07 |
| Conor Hourihane | 43 | 3084 | 18 | 7 | 11 | 6.3 | 10.1 | 0.18 | 0.29 |
| John McGinn | 40 | 3464 | 15 | 6 | 9 | 6.9 | 6.9 | 0.18 | 0.18 |
| Jack Grealish | 31 | 2698 | 12 | 6 | 6 | 4.7 | 6.1 | 0.16 | 0.20 |
| Anwar El Ghazi | 31 | 2183 | 11 | 5 | 6 | 4.9 | 5.6 | 0.20 | 0.23 |
| Jonathan Kodjia | 39 | 2021 | 11 | 9 | 2 | 7.7 | 2.2 | 0.34 | 0.10 |
| Ahmed Elmohamady | 38 | 2945 | 9 | 2 | 7 | 1.8 | 4.5 | 0.05 | 0.14 |
| Albert Adomah | 35 | 1861 | 6 | 4 | 2 | 3.8 | 4.0 | 0.19 | 0.20 |
| Yannick Bolasie | 21 | 953 | 6 | 2 | 4 | 2.6 | 3.2 | 0.24 | 0.30 |
| James Chester | 28 | 2520 | 5 | 5 | 0 | 2.8 | 0.1 | 0.10 | 0.00 |
Overall Performance by Player (P=Playing, NP=Not Playing)
Those who have doubts over Jack Grealish appear unfounded. Villa had a Goal Difference per 90 mins (GDp90 P) of 0.90 when he was on the pitch compared to -0.37 without him (GDp90 NP) for an actual difference of 1.28.
Tammy Abraham another one with a strong impact, 0.72 actual difference and 0.57 xGD difference, and will hopefully get a shot in the Premier League next season.
| Player | Mins | GD P | GDp90 P | GDp90 NP | Diff | xGD P | xGDp90 P | xGDp90 NP | Diff |
| Team Average | 4140 | 21 | 0.46 | 12.9 | 0.28 | ||||
| John McGinn | 3464 | 15 | 0.39 | 0.80 | -0.41 | 10.1 | 0.26 | 0.37 | -0.11 |
| Tammy Abraham | 3150 | 22 | 0.63 | -0.09 | 0.72 | 14.6 | 0.42 | -0.16 | 0.57 |
| Conor Hourihane | 3084 | 18 | 0.53 | 0.26 | 0.27 | 9.4 | 0.27 | 0.30 | -0.02 |
| Ahmed Elmohamady | 2945 | 18 | 0.55 | 0.23 | 0.32 | 8.9 | 0.27 | 0.31 | -0.03 |
| Alan Hutton | 2874 | 2 | 0.06 | 1.35 | -1.29 | 3.2 | 0.10 | 0.69 | -0.59 |
| Jack Grealish | 2698 | 27 | 0.90 | -0.37 | 1.28 | 12.6 | 0.42 | 0.02 | 0.40 |
| James Chester | 2520 | 8 | 0.29 | 0.72 | -0.44 | 7.9 | 0.28 | 0.28 | 0.00 |
| Neil Taylor | 2473 | 18 | 0.66 | 0.16 | 0.49 | 12.5 | 0.46 | 0.02 | 0.43 |
| Anwar El Ghazi | 2183 | 15 | 0.62 | 0.28 | 0.34 | 9.6 | 0.40 | 0.15 | 0.25 |
| Axel Tuanzebe | 2096 | 9 | 0.39 | 0.53 | -0.14 | 7.1 | 0.31 | 0.25 | 0.05 |
| vòrjan Nyland | 2070 | 7 | 0.30 | 0.61 | -0.30 | 5.2 | 0.23 | 0.34 | -0.11 |
| Glenn Whelan | 2054 | 10 | 0.44 | 0.47 | -0.04 | 8.5 | 0.37 | 0.19 | 0.18 |
| Jonathan Kodjia | 2021 | 4 | 0.18 | 0.72 | -0.54 | 1.8 | 0.08 | 0.47 | -0.39 |
| Albert Adomah | 1861 | 15 | 0.73 | 0.24 | 0.49 | 11.0 | 0.53 | 0.08 | 0.45 |
| Jed Steer | 1395 | 19 | 1.23 | 0.07 | 1.16 | 9.7 | 0.62 | 0.11 | 0.52 |
| Tyrone Mings | 1350 | 14 | 0.93 | 0.23 | 0.71 | 4.3 | 0.29 | 0.28 | 0.01 |
| Mile Jedinak | 1129 | -1 | -0.08 | 0.66 | -0.74 | 2.8 | 0.22 | 0.30 | -0.08 |
| Yannick Bolasie | 953 | 6 | 0.57 | 0.42 | 0.14 | 3.6 | 0.34 | 0.26 | 0.08 |
Birmingham City (Actual 17th, xG 12th)
Performance by Match
Performance by Formation
| Starting Formation | Matches | Pts p90 | xPts p90 |
| 4-4-2 (Classic) | 40 | 1.4 | 1.4 |
| Unknown | 6 | 0.7 | 1.3 |
Attacking Performance by Player
| Player | Apps | Mins | GI | G | A | xG | xA | xGp90 | xAp90 |
| Che Adams | 46 | 3740 | 26 | 22 | 4 | 14.7 | 6.5 | 0.35 | 0.16 |
| Lukas Jutkiewicz | 46 | 3824 | 24 | 14 | 10 | 14.2 | 5.9 | 0.33 | 0.14 |
| Jota | 40 | 2874 | 14 | 3 | 11 | 4.4 | 8.2 | 0.14 | 0.26 |
| Jacques Maghoma | 41 | 3024 | 11 | 6 | 5 | 4.7 | 4.3 | 0.14 | 0.13 |
| Michael Morrison | 43 | 3831 | 8 | 7 | 1 | 4.3 | 1.3 | 0.10 | 0.03 |
| Connor Mahoney | 29 | 1501 | 6 | 2 | 4 | 1.9 | 4.0 | 0.11 | 0.24 |
| Gary Gardner | 40 | 3258 | 5 | 2 | 3 | 4.4 | 1.7 | 0.12 | 0.05 |
| Kristian Pedersen | 39 | 3494 | 3 | 1 | 2 | 0.4 | 1.3 | 0.01 | 0.03 |
| Maikel Kieftenbeld | 36 | 2944 | 3 | 1 | 2 | 0.9 | 0.9 | 0.03 | 0.03 |
| Craig Gardner | 21 | 738 | 2 | 1 | 1 | 1.8 | 0.9 | 0.22 | 0.11 |
Overall Performance by Player (P=Playing, NP=Not Playing)
A small concentration of players have played the majority of the minutes. Lee Camp and Lukas Jutkiewicz the stand out performers for both actual and xGD difference.
| Player | Mins | GD P | GDp90 P | GDp90 NP | Diff | xGD P | xGDp90 P | xGDp90 NP | Diff |
| Team Average | 4140 | 6 | 0.13 | 1.4 | 0.03 | ||||
| Lee Camp | 3960 | 7 | 0.16 | -0.50 | 0.66 | 2.9 | 0.07 | -0.74 | 0.80 |
| Harlee Dean | 3883 | 4 | 0.09 | 0.70 | -0.61 | 1.0 | 0.02 | 0.14 | -0.11 |
| Michael Morrison | 3831 | 7 | 0.16 | -0.29 | 0.46 | 0.5 | 0.01 | 0.25 | -0.24 |
| Lukas Jutkiewicz | 3824 | 9 | 0.21 | -0.85 | 1.07 | 2.9 | 0.07 | -0.44 | 0.51 |
| Maxime Colin | 3793 | 11 | 0.26 | -1.30 | 1.56 | 1.7 | 0.04 | -0.08 | 0.12 |
| Che Adams | 3740 | 4 | 0.10 | 0.45 | -0.35 | 1.7 | 0.04 | -0.08 | 0.12 |
| Kristian Pedersen | 3494 | -2 | -0.05 | 1.11 | -1.17 | 1.6 | 0.04 | -0.03 | 0.07 |
| Gary Gardner | 3258 | 8 | 0.22 | -0.20 | 0.43 | 2.6 | 0.07 | -0.12 | 0.19 |
| Jacques Maghoma | 3024 | 11 | 0.33 | -0.40 | 0.73 | 2.4 | 0.07 | -0.08 | 0.15 |
| Maikel Kieftenbeld | 2944 | 7 | 0.21 | -0.08 | 0.29 | -2.6 | -0.08 | 0.30 | -0.38 |
| Jota | 2874 | 11 | 0.34 | -0.36 | 0.70 | 1.8 | 0.06 | -0.03 | 0.09 |
| Wes Harding | 1534 | 5 | 0.29 | 0.03 | 0.26 | -1.5 | -0.09 | 0.10 | -0.19 |
| Connor Mahoney | 1501 | -2 | -0.12 | 0.27 | -0.39 | 0.8 | 0.05 | 0.02 | 0.03 |
| Craig Gardner | 738 | -1 | -0.12 | 0.19 | -0.31 | 0.0 | 0.00 | 0.04 | -0.04 |
| David Davis | 688 | -1 | -0.13 | 0.18 | -0.31 | 2.8 | 0.37 | -0.04 | 0.41 |
| Kerim Mrabti | 620 | -4 | -0.58 | 0.26 | -0.84 | 1.1 | 0.16 | 0.01 | 0.16 |
| Charlie Lakin | 437 | 0 | 0.00 | 0.15 | -0.15 | -0.6 | -0.12 | 0.05 | -0.17 |
| Omar Bogle | 359 | 0 | 0.00 | 0.14 | -0.14 | 0.7 | 0.18 | 0.02 | 0.16 |
Blackburn Rovers (Actual 15th, xG 18th)
Performance by Match
Performance by Formation
| Starting Formation | Matches | Pts p90 | xPts p90 |
| 3-4-3 | 2 | 1.5 | 1.7 |
| Unknown | 6 | 1.5 | 1.7 |
| 4-2-3-1 | 35 | 1.4 | 1.3 |
| 3-4-1-2 | 1 | 0.0 | 1.9 |
| 4-4-1-1 | 1 | 0.0 | 1.8 |
| 4-3-3 | 1 | 0.0 | 1.8 |
Attacking Performance by Player
| Player | Apps | Mins | GI | G | A | xG | xA | xGp90 | xAp90 |
| Bradley Dack | 42 | 3454 | 22 | 15 | 7 | 18.2 | 5.2 | 0.47 | 0.13 |
| Danny Graham | 43 | 3030 | 19 | 15 | 4 | 10.6 | 4.1 | 0.31 | 0.12 |
| Charlie Mulgrew | 29 | 2383 | 10 | 10 | 0 | 5.5 | 1.0 | 0.21 | 0.04 |
| Adam Armstrong | 43 | 2853 | 8 | 5 | 3 | 6.2 | 4.7 | 0.20 | 0.15 |
| Harrison Reed | 32 | 2407 | 8 | 3 | 5 | 2.7 | 4.2 | 0.10 | 0.16 |
| Amari i Bell | 38 | 3204 | 4 | 3 | 1 | 1.7 | 1.6 | 0.05 | 0.05 |
| Elliott Bennett | 40 | 3402 | 4 | 1 | 3 | 2.0 | 3.7 | 0.05 | 0.10 |
| Joe Rothwell | 33 | 1542 | 4 | 2 | 2 | 3.6 | 2.7 | 0.21 | 0.15 |
| Ben Brereton | 24 | 677 | 2 | 1 | 1 | 1.7 | 1.0 | 0.23 | 0.14 |
| Craig Conway | 21 | 946 | 2 | 1 | 1 | 1.1 | 3.1 | 0.10 | 0.29 |
Overall Performance by Player (P=Playing, NP=Not Playing)
Danny Graham has been the standout performer for Rovers this season. Blackburn have an actual Goal Difference per 90 mins of 0.21 (GDp90 P) when he’s played and -0.97 without him (GDp90 NP).
Darragh Lenihan is another one who has had a good season and has been missed when he’s not played based on both actual and xG performances. At 25 he still has the potential to improve further.
| Player | Mins | GD P | GDp90 P | GDp90 NP | Diff | xGD P | xGDp90 P | xGDp90 NP | Diff |
| Team Average | 4140 | -5 | -0.11 | -1.0 | -0.02 | ||||
| David Raya Martin | 3682 | -8 | -0.20 | 0.59 | -0.79 | -0.3 | -0.01 | -0.13 | 0.12 |
| Bradley Dack | 3454 | 2 | 0.05 | -0.92 | 0.97 | -2.3 | -0.06 | 0.17 | -0.23 |
| Elliott Bennett | 3402 | -5 | -0.13 | 0.00 | -0.13 | 3.5 | 0.09 | -0.55 | 0.64 |
| Amari i Bell | 3204 | 1 | 0.03 | -0.58 | 0.61 | -1.9 | -0.05 | 0.09 | -0.14 |
| Danny Graham | 3030 | 7 | 0.21 | -0.97 | 1.18 | 5.8 | 0.17 | -0.55 | 0.72 |
| Darragh Lenihan | 2982 | 1 | 0.03 | -0.47 | 0.50 | 2.1 | 0.06 | -0.24 | 0.31 |
| Adam Armstrong | 2853 | -6 | -0.19 | 0.07 | -0.26 | -3.7 | -0.12 | 0.19 | -0.31 |
| Corry Evans | 2679 | 1 | 0.03 | -0.37 | 0.40 | 0.8 | 0.03 | -0.11 | 0.14 |
| Harrison Reed | 2407 | -4 | -0.15 | -0.05 | -0.10 | -4.9 | -0.18 | 0.20 | -0.38 |
| Charlie Mulgrew | 2383 | -16 | -0.60 | 0.56 | -1.17 | -3.4 | -0.13 | 0.12 | -0.25 |
| Ryan Nyambe | 2312 | -3 | -0.12 | -0.10 | -0.02 | 2.4 | 0.10 | -0.17 | 0.27 |
| Richard Smallwood | 2254 | -17 | -0.68 | 0.57 | -1.25 | -8.3 | -0.33 | 0.35 | -0.68 |
| Derrick Williams | 2222 | -3 | -0.12 | -0.09 | -0.03 | -4.0 | -0.16 | 0.14 | -0.30 |
| Lewis Travis | 1775 | 6 | 0.30 | -0.42 | 0.72 | 1.1 | 0.06 | -0.08 | 0.14 |
| Joe Rothwell | 1542 | -3 | -0.18 | -0.07 | -0.11 | 0.9 | 0.05 | -0.07 | 0.12 |
| Jack Rodwell | 1440 | -2 | -0.13 | -0.10 | -0.03 | -2.0 | -0.12 | 0.03 | -0.16 |
| Craig Conway | 946 | 2 | 0.19 | -0.20 | 0.39 | 0.4 | 0.04 | -0.04 | 0.07 |
| Kasey Palmer | 775 | -1 | -0.12 | -0.11 | -0.01 | 0.4 | 0.05 | -0.04 | 0.09 |
Bolton Wanderers (Actual 23rd, xG 22nd)
Performance by Match
Performance by Formation
| Starting Formation | Matches | Pts p90 | xPts p90 |
| Unknown | 6 | 1.8 | 1.3 |
| 3-5-2 | 1 | 1.0 | 1.1 |
| 4-4-2 (Classic) | 4 | 0.8 | 1.0 |
| 4-4-1-1 | 8 | 0.8 | 1.0 |
| 5-3-2 | 4 | 0.8 | 0.8 |
| 4-2-3-1 | 14 | 0.4 | 1.0 |
| 4-1-4-1 | 5 | 0.4 | 0.9 |
| 3-4-1-2 | 1 | 0.0 | 1.6 |
| 3-5-1-1 | 1 | 0.0 | 1.3 |
| 4-5-1 | 1 | 0.0 | 0.8 |
Attacking Performance by Player
| Player | Apps | Mins | GI | G | A | xG | xA | xGp90 | xAp90 |
| Sammy Ameobi | 30 | 2339 | 7 | 4 | 3 | 4.0 | 3.6 | 0.15 | 0.14 |
| William Buckley | 32 | 1841 | 6 | 4 | 2 | 4.2 | 1.6 | 0.21 | 0.08 |
| Josh Magennis | 42 | 2722 | 5 | 4 | 1 | 7.5 | 2.4 | 0.25 | 0.08 |
| Pawel Olkowski | 37 | 3099 | 5 | 2 | 3 | 1.2 | 2.0 | 0.03 | 0.06 |
| Callum Connolly | 16 | 1358 | 4 | 2 | 2 | 1.8 | 0.8 | 0.12 | 0.05 |
| Gary O Neil | 29 | 2047 | 4 | 3 | 1 | 1.5 | 4.0 | 0.06 | 0.18 |
| Mark Beevers | 32 | 2765 | 3 | 3 | 0 | 2.1 | 0.6 | 0.07 | 0.02 |
| Clayton Donaldson | 30 | 1592 | 2 | 1 | 1 | 3.7 | 0.5 | 0.21 | 0.03 |
| Craig Noone | 35 | 2226 | 2 | 1 | 1 | 2.6 | 3.3 | 0.11 | 0.13 |
| David Wheater | 33 | 2880 | 2 | 0 | 2 | 3.0 | 1.2 | 0.09 | 0.04 |
Overall Performance by Player (P=Playing, NP=Not Playing)
In a poor season, Josh Magennis has been a positive with the team performing better with him on the pitch. He’s scored 10 goals in both of his League One seasons and will be key to any success next year.
22 year old Joe Williams also catches the eye following his loan spell from Everton. It’ll be interesting to see who takes him next season but he appears to be capable at Championship level.
| Player | Mins | GD P | GDp90 P | GDp90 NP | Diff | xGD P | xGDp90 P | xGDp90 NP | Diff |
| Team Average | 4050 | -48 | -1.07 | -24.2 | -0.54 | ||||
| Pawel Olkowski | 3099 | -29 | -0.84 | -1.80 | 0.96 | -16.8 | -0.49 | -0.70 | 0.22 |
| Jason Lowe | 3017 | -33 | -0.98 | -1.31 | 0.32 | -17.3 | -0.51 | -0.60 | 0.09 |
| David Wheater | 2880 | -31 | -0.97 | -1.31 | 0.34 | -18.5 | -0.58 | -0.43 | -0.14 |
| Mark Beevers | 2765 | -33 | -1.07 | -1.05 | -0.02 | -16.2 | -0.53 | -0.56 | 0.03 |
| Josh Magennis | 2722 | -22 | -0.73 | -1.76 | 1.03 | -12.4 | -0.41 | -0.80 | 0.39 |
| Joe Williams | 2527 | -29 | -1.03 | -1.12 | 0.09 | -12.1 | -0.43 | -0.72 | 0.29 |
| Ben Alnwick | 2430 | -26 | -0.96 | -1.22 | 0.26 | -11.7 | -0.43 | -0.70 | 0.26 |
| Sammy Ameobi | 2339 | -30 | -1.15 | -0.95 | -0.21 | -15.0 | -0.58 | -0.48 | -0.10 |
| Andrew Taylor | 2252 | -21 | -0.84 | -1.35 | 0.51 | -10.2 | -0.41 | -0.70 | 0.30 |
| Craig Noone | 2226 | -29 | -1.17 | -0.94 | -0.24 | -14.2 | -0.57 | -0.49 | -0.08 |
| Jack Hobbs | 2117 | -28 | -1.19 | -0.93 | -0.26 | -11.4 | -0.48 | -0.60 | 0.11 |
| Gary O Neil | 2047 | -27 | -1.19 | -0.94 | -0.24 | -14.2 | -0.63 | -0.45 | -0.18 |
| William Buckley | 1841 | -17 | -0.83 | -1.26 | 0.43 | -12.0 | -0.59 | -0.50 | -0.09 |
| Remi Matthews | 1620 | -22 | -1.22 | -0.96 | -0.26 | -12.5 | -0.70 | -0.43 | -0.26 |
| Clayton Donaldson | 1592 | -25 | -1.41 | -0.84 | -0.57 | -11.7 | -0.66 | -0.46 | -0.20 |
| Callum Connolly | 1358 | -22 | -1.46 | -0.87 | -0.59 | -10.4 | -0.69 | -0.46 | -0.23 |
| Marc Wilson | 1233 | -13 | -0.95 | -1.12 | 0.17 | -6.8 | -0.50 | -0.56 | 0.06 |
| Josh Vela | 1147 | -17 | -1.33 | -0.96 | -0.37 | -7.4 | -0.58 | -0.52 | -0.06 |
Brentford (Actual 11th, xG 6th)
Performance by Match
Performance by Formation
| Starting Formation | Matches | Pts p90 | xPts p90 |
| 5-4-1 | 1 | 3.0 | 1.3 |
| Unknown | 6 | 1.8 | 1.8 |
| 3-4-3 | 20 | 1.7 | 1.7 |
| 3-4-2-1 | 2 | 1.5 | 1.5 |
| 4-1-4-1 | 1 | 1.0 | 0.5 |
| 4-2-3-1 | 15 | 0.7 | 1.3 |
Performance by Manager
Both actual and xG performances dropped following Dean Smith’s departure. The club still remains in capable hands with Thomas Frank though.
| Managerial Record | Matches | Pts p90 | Rank | xPts p90 | Rank |
| Dean Smith | 12 | 1.5 | 9th | 1.6 | 3rd |
| Thomas Frank | 34 | 1.4 | 13th | 1.5 | 7th |
Attacking Performance by Player
| Player | Apps | Mins | GI | G | A | xG | xA | xGp90 | xAp90 |
| Neal Maupay | 43 | 3713 | 33 | 25 | 8 | 23.6 | 4.8 | 0.57 | 0.12 |
| Said Benrahma | 36 | 2287 | 24 | 10 | 14 | 8.2 | 9.4 | 0.32 | 0.37 |
| Ollie Watkins | 41 | 3126 | 16 | 10 | 6 | 9.0 | 6.5 | 0.26 | 0.19 |
| Sergi Canos | 44 | 2195 | 14 | 7 | 7 | 6.6 | 4.1 | 0.27 | 0.17 |
| Romaine Sawyers | 42 | 3642 | 6 | 0 | 6 | 2.0 | 4.7 | 0.05 | 0.12 |
| Kamohelo Mokotjo | 35 | 2293 | 5 | 3 | 2 | 1.1 | 1.7 | 0.04 | 0.07 |
| Henrik Dalsgaard | 40 | 3572 | 4 | 2 | 2 | 2.0 | 4.9 | 0.05 | 0.12 |
| Lewis MacLeod | 17 | 975 | 4 | 3 | 1 | 2.0 | 2.3 | 0.18 | 0.21 |
| Rico Henry | 14 | 1074 | 3 | 1 | 2 | 0.9 | 1.0 | 0.07 | 0.08 |
| Emiliano Marcondes | 13 | 449 | 2 | 0 | 2 | 0.9 | 0.5 | 0.18 | 0.10 |
Overall Performance by Player (P=Playing, NP=Not Playing)
A number of players with positive seasons for the Bees. Ollie Watkins has always impressed me when I’ve watched him play and the numbers back up the eye. Brentford have an actual Goal Difference per 90 mins of 0.40 (GDp90 P) with him and -0.10 without him (GDp90 NP) for a 0.50 difference. Based on xG performance the difference is even grater at 0.80.
| Player | Mins | GD P | GDp90 P | GDp90 NP | Diff | xGD P | xGDp90 P | xGDp90 NP | Diff |
| Team Average | 4050 | 13 | 0.29 | 13.9 | 0.31 | ||||
| Ezri Konsa Ngoyo | 3752 | 14 | 0.34 | -0.30 | 0.64 | 12.4 | 0.30 | 0.46 | -0.16 |
| Neal Maupay | 3713 | 14 | 0.34 | -0.27 | 0.61 | 12.9 | 0.31 | 0.27 | 0.04 |
| Romaine Sawyers | 3642 | 10 | 0.25 | 0.66 | -0.41 | 12.2 | 0.30 | 0.38 | -0.08 |
| Henrik Dalsgaard | 3572 | 7 | 0.18 | 1.13 | -0.95 | 9.8 | 0.25 | 0.78 | -0.54 |
| Ollie Watkins | 3126 | 14 | 0.40 | -0.10 | 0.50 | 17.1 | 0.49 | -0.31 | 0.80 |
| Daniel Bentley | 2955 | 13 | 0.40 | 0.00 | 0.40 | 12.1 | 0.37 | 0.15 | 0.22 |
| Yoann Barbet | 2693 | 11 | 0.37 | 0.13 | 0.23 | 14.8 | 0.50 | -0.06 | 0.56 |
| Kamohelo Mokotjo | 2293 | 7 | 0.27 | 0.31 | -0.03 | 8.9 | 0.35 | 0.26 | 0.09 |
| Said Benrahma | 2287 | 9 | 0.35 | 0.20 | 0.15 | 15.2 | 0.60 | -0.06 | 0.66 |
| Sergi Canos | 2195 | 9 | 0.37 | 0.19 | 0.17 | 7.6 | 0.31 | 0.31 | 0.00 |
| Moses Odubajo | 2175 | 11 | 0.46 | 0.10 | 0.36 | 7.4 | 0.31 | 0.31 | -0.01 |
| Julian Jeanvier | 2098 | 7 | 0.30 | 0.28 | 0.02 | 9.9 | 0.42 | 0.19 | 0.23 |
| Chris Mepham | 1943 | 1 | 0.05 | 0.51 | -0.47 | 3.2 | 0.15 | 0.46 | -0.31 |
| Josh McEachran | 1487 | -3 | -0.18 | 0.56 | -0.74 | -1.1 | -0.06 | 0.53 | -0.59 |
| Luke Daniels | 1080 | 0 | 0.00 | 0.39 | -0.39 | 1.7 | 0.15 | 0.37 | -0.22 |
| Rico Henry | 1074 | 8 | 0.67 | 0.15 | 0.52 | 3.6 | 0.30 | 0.31 | -0.01 |
| Lewis MacLeod | 975 | 5 | 0.46 | 0.23 | 0.23 | 4.5 | 0.42 | 0.28 | 0.14 |
| Nico Yennaris | 897 | -7 | -0.70 | 0.57 | -1.27 | -0.1 | -0.01 | 0.40 | -0.41 |
Bristol City (Actual 8th, xG 11th)
Performance by Match
Performance by Formation
| Starting Formation | Matches | Pts p90 | xPts p90 |
| 4-1-4-1 | 14 | 1.9 | 1.4 |
| Unknown | 6 | 1.8 | 1.5 |
| 3-5-2 | 3 | 1.7 | 1.2 |
| 3-4-2-1 | 2 | 1.5 | 1.4 |
| 4-2-3-1 | 7 | 1.6 | 1.6 |
| 5-3-2 | 3 | 1.0 | 1.4 |
| 4-4-2 (Classic) | 11 | 1.0 | 1.4 |
Attacking Performance by Player
| Player | Apps | Mins | GI | G | A | xG | xA | xGp90 | xAp90 |
| Andreas Weimann | 44 | 3348 | 15 | 10 | 5 | 8.6 | 4.5 | 0.23 | 0.12 |
| Famara Diedhiou | 40 | 3102 | 15 | 13 | 2 | 15.8 | 3.1 | 0.46 | 0.09 |
| Jamie Paterson | 41 | 2654 | 9 | 5 | 4 | 5.0 | 5.2 | 0.17 | 0.17 |
| Josh Brownhill | 45 | 4013 | 9 | 5 | 4 | 7.1 | 3.7 | 0.16 | 0.08 |
| Matty Taylor | 33 | 1200 | 9 | 4 | 5 | 3.4 | 2.8 | 0.26 | 0.21 |
| Callum O Dowda | 31 | 1801 | 8 | 4 | 4 | 3.1 | 3.4 | 0.16 | 0.17 |
| Niclas Eliasson | 33 | 1972 | 8 | 2 | 6 | 3.0 | 6.2 | 0.14 | 0.28 |
| Jack Hunt | 33 | 2713 | 6 | 1 | 5 | 0.5 | 2.6 | 0.02 | 0.09 |
| Marlon Pack | 46 | 4098 | 5 | 2 | 3 | 3.5 | 3.5 | 0.08 | 0.08 |
| Adam Webster | 44 | 3747 | 3 | 3 | 0 | 3.8 | 1.7 | 0.09 | 0.04 |
Overall Performance by Player (P=Playing, NP=Not Playing)
A mixed bag with Niclas Eliasson and Matty Taylor the two for have improved both actual and xG performance during their limited minutes. Both appear to be deserving of more time on the field.
| Player | Mins | GD P | GDp90 P | GDp90 NP | Diff | xGD P | xGDp90 P | xGDp90 NP | Diff |
| Team Average | 4140 | 6 | 0.13 | 3.5 | 0.08 | ||||
| Marlon Pack | 4098 | 4 | 0.09 | 4.29 | -4.20 | 2.3 | 0.05 | 2.48 | -2.43 |
| Josh Brownhill | 4013 | 4 | 0.09 | 1.42 | -1.33 | 1.9 | 0.04 | 1.12 | -1.08 |
| Adam Webster | 3747 | 2 | 0.05 | 0.92 | -0.87 | 5.3 | 0.13 | -0.43 | 0.56 |
| Tomas Kalas | 3406 | 5 | 0.13 | 0.12 | 0.01 | 2.4 | 0.06 | 0.13 | -0.06 |
| Andreas Weimann | 3348 | 4 | 0.11 | 0.23 | -0.12 | -0.5 | -0.01 | 0.45 | -0.46 |
| Famara Diedhiou | 3102 | 3 | 0.09 | 0.26 | -0.17 | 4.1 | 0.12 | -0.06 | 0.18 |
| Jack Hunt | 2713 | 3 | 0.10 | 0.19 | -0.09 | 2.9 | 0.10 | 0.03 | 0.06 |
| Jamie Paterson | 2654 | 0 | 0.00 | 0.36 | -0.36 | 3.6 | 0.12 | -0.01 | 0.13 |
| Niki Mv§enpv§v§ | 2405 | 2 | 0.07 | 0.21 | -0.13 | 2.8 | 0.11 | 0.03 | 0.07 |
| Lloyd Kelly | 2311 | 2 | 0.08 | 0.20 | -0.12 | 1.8 | 0.07 | 0.08 | -0.01 |
| Jay Dasilva | 2036 | 2 | 0.09 | 0.17 | -0.08 | 5.2 | 0.23 | -0.08 | 0.31 |
| Niclas Eliasson | 1972 | 11 | 0.50 | -0.21 | 0.71 | 5.2 | 0.24 | -0.07 | 0.31 |
| Callum O Dowda | 1801 | 7 | 0.35 | -0.04 | 0.39 | -0.1 | -0.01 | 0.14 | -0.14 |
| Max O Leary | 1285 | 1 | 0.07 | 0.16 | -0.09 | 0.1 | 0.01 | 0.11 | -0.10 |
| Matty Taylor | 1200 | 11 | 0.83 | -0.15 | 0.98 | 3.3 | 0.24 | 0.01 | 0.24 |
| Eros Pisano | 1106 | 2 | 0.16 | 0.12 | 0.04 | -0.7 | -0.06 | 0.12 | -0.18 |
| Nathan Baker | 923 | -1 | -0.10 | 0.20 | -0.29 | -2.2 | -0.21 | 0.16 | -0.37 |
| Bailey Wright | 843 | -1 | -0.11 | 0.19 | -0.30 | -3.7 | -0.39 | 0.19 | -0.59 |
Derby County (Actual 6th, xG 15th)
Performance by Match
Performance by Formation
| Starting Formation | Matches | Pts p90 | xPts p90 |
| Unknown | 6 | 2.0 | 1.3 |
| 4-3-3 | 22 | 1.8 | 1.4 |
| 4-2-3-1 | 17 | 1.4 | 1.2 |
| 3-5-2 | 1 | 0.0 | 1.9 |
Attacking Performance by Player
| Player | Apps | Mins | GI | G | A | xG | xA | xGp90 | xAp90 |
| Harry Wilson | 40 | 3186 | 18 | 15 | 3 | 9.6 | 5.2 | 0.27 | 0.15 |
| Martyn Waghorn | 36 | 2183 | 12 | 9 | 3 | 6.4 | 1.8 | 0.26 | 0.07 |
| Mason Mount | 35 | 3051 | 12 | 8 | 4 | 7.8 | 6.1 | 0.23 | 0.18 |
| Jack Marriott | 33 | 1860 | 11 | 7 | 4 | 5.9 | 1.8 | 0.29 | 0.09 |
| Jayden Bogle | 40 | 3485 | 10 | 2 | 8 | 1.8 | 5.1 | 0.05 | 0.13 |
| Tom Lawrence | 33 | 2627 | 8 | 6 | 2 | 5.0 | 4.0 | 0.17 | 0.14 |
| Mason Bennett | 30 | 1108 | 7 | 3 | 4 | 2.5 | 2.7 | 0.20 | 0.22 |
| Bradley Johnson | 27 | 2092 | 5 | 2 | 3 | 2.0 | 1.1 | 0.09 | 0.05 |
| Craig Bryson | 28 | 2120 | 5 | 3 | 2 | 2.3 | 1.2 | 0.10 | 0.05 |
| Craig Forsyth | 13 | 961 | 4 | 0 | 4 | 0.1 | 1.9 | 0.01 | 0.18 |
Overall Performance by Player (P=Playing, NP=Not Playing)
Mason Mount has had a great season and has been hugely influential in helping the Rams to the last play off spot. Derby County have an actual Goal Difference per 90 mins of 0.65 (GDp90 P) when he’s played and -0.58 without him (GDp90 NP). The 19 year old has a big future and with the enforced transfer ban at Chelsea it will be interesting to see if he secures any minutes there.
Jayden Bogle and Scott Malone are the other pair who rank highly on the numbers.
| Player | Mins | GD P | GDp90 P | GDp90 NP | Diff | xGD P | xGDp90 P | xGDp90 NP | Diff |
| Team Average | 4140 | 15 | 0.33 | -6.4 | -0.14 | ||||
| Richard Keogh | 4122 | 15 | 0.33 | 0.00 | 0.33 | -6.4 | -0.14 | -0.23 | 0.10 |
| Fikayo Tomori | 3791 | 11 | 0.26 | 1.03 | -0.77 | -5.7 | -0.14 | -0.18 | 0.04 |
| Jayden Bogle | 3485 | 19 | 0.49 | -0.55 | 1.04 | -0.1 | 0.00 | -0.87 | 0.87 |
| Harry Wilson | 3186 | 18 | 0.51 | -0.28 | 0.79 | -5.3 | -0.15 | -0.11 | -0.04 |
| Mason Mount | 3051 | 22 | 0.65 | -0.58 | 1.23 | -2.0 | -0.06 | -0.37 | 0.31 |
| Scott Carson | 2700 | 1 | 0.03 | 0.88 | -0.84 | -3.7 | -0.12 | -0.17 | 0.05 |
| Tom Lawrence | 2627 | 13 | 0.45 | 0.12 | 0.33 | -7.1 | -0.24 | 0.04 | -0.28 |
| Martyn Waghorn | 2183 | 12 | 0.49 | 0.14 | 0.36 | -4.1 | -0.17 | -0.11 | -0.06 |
| Craig Bryson | 2120 | 5 | 0.21 | 0.45 | -0.23 | 1.5 | 0.07 | -0.35 | 0.42 |
| Bradley Johnson | 2092 | 12 | 0.52 | 0.13 | 0.38 | 2.4 | 0.11 | -0.39 | 0.49 |
| Scott Malone | 2075 | 17 | 0.74 | -0.09 | 0.82 | 2.0 | 0.09 | -0.37 | 0.45 |
| Tom Huddlestone | 1883 | 7 | 0.33 | 0.32 | 0.02 | -3.8 | -0.18 | -0.10 | -0.08 |
| Jack Marriott | 1860 | -1 | -0.05 | 0.63 | -0.68 | -5.4 | -0.26 | -0.04 | -0.22 |
| Duane Holmes | 1490 | 4 | 0.24 | 0.37 | -0.13 | -7.4 | -0.45 | 0.03 | -0.48 |
| Kelle Roos | 1440 | 14 | 0.88 | 0.03 | 0.84 | -2.7 | -0.17 | -0.12 | -0.05 |
| Florian Jozefzoon | 1287 | -10 | -0.70 | 0.79 | -1.49 | -5.5 | -0.38 | -0.03 | -0.35 |
| David Nugent | 1134 | 6 | 0.48 | 0.27 | 0.21 | 3.5 | 0.28 | -0.30 | 0.57 |
| Mason Bennett | 1108 | 13 | 1.06 | 0.06 | 1.00 | 3.6 | 0.29 | -0.30 | 0.59 |
Hull City (Actual 13th, xG 20th)
Performance by Match
Performance by Formation
| Starting Formation | Matches | Pts p90 | xPts p90 |
| 4-5-1 | 3 | 2.3 | 1.4 |
| 4-4-1-1 | 30 | 1.6 | 1.3 |
| 3-4-2-1 | 1 | 1.0 | 1.4 |
| 5-3-2 | 1 | 1.0 | 1.3 |
| Unknown | 6 | 0.7 | 1.2 |
| 3-5-2 | 1 | 0.0 | 0.5 |
| 3-4-3 | 1 | 0.0 | 1.8 |
| 4-4-2 (Classic) | 2 | 0.0 | 0.8 |
| 4-1-4-1 | 1 | 0.0 | 0.5 |
Attacking Performance by Player
| Player | Apps | Mins | GI | G | A | xG | xA | xGp90 | xAp90 |
| Jarrod Bowen | 46 | 3951 | 26 | 22 | 4 | 16.1 | 5.6 | 0.37 | 0.13 |
| Kamil Grosicki | 39 | 3005 | 21 | 9 | 12 | 8.7 | 12.3 | 0.26 | 0.37 |
| Fraizer Campbell | 39 | 2590 | 18 | 12 | 6 | 7.1 | 2.2 | 0.25 | 0.08 |
| Evandro Goebel | 23 | 1184 | 7 | 3 | 4 | 1.7 | 2.3 | 0.13 | 0.17 |
| Jackson Irvine | 38 | 3178 | 7 | 6 | 1 | 5.6 | 2.8 | 0.16 | 0.08 |
| Jordy de Wijs | 32 | 2631 | 4 | 1 | 3 | 2.8 | 1.5 | 0.10 | 0.05 |
| Marc Pugh | 14 | 819 | 4 | 3 | 1 | 2.4 | 1.2 | 0.26 | 0.13 |
| Markus Henriksen | 39 | 3441 | 4 | 2 | 2 | 2.5 | 2.0 | 0.07 | 0.05 |
| Todd Kane | 38 | 3213 | 4 | 3 | 1 | 1.3 | 2.4 | 0.04 | 0.07 |
| Chris Martin | 30 | 1402 | 3 | 2 | 1 | 3.6 | 1.3 | 0.23 | 0.08 |
Overall Performance by Player (P=Playing, NP=Not Playing)
Jarrod Bowen hasn’t missed many minutes but the Tigers have been better with him. At just 21 years old he’s worthy of a punt from a non Top 6 Premier League team.
Reece Burke has had a good season on loan from West Ham and a strong pre-season may see him remain in London. If he’s out on loan again he’s likely to end up at a better team than Hull (sorry!).
| Player | Mins | GD P | GDp90 P | GDp90 NP | Diff | xGD P | xGDp90 P | xGDp90 NP | Diff |
| Team Average | 4140 | -2 | -0.04 | -9.7 | -0.21 | ||||
| Jarrod Bowen | 3951 | 0 | 0.00 | -0.95 | 0.95 | -7.2 | -0.16 | -1.19 | 1.02 |
| David Marshall | 3826 | 3 | 0.07 | -1.43 | 1.50 | -7.0 | -0.16 | -0.77 | 0.60 |
| Markus Henriksen | 3441 | 1 | 0.03 | -0.39 | 0.41 | -7.2 | -0.19 | -0.32 | 0.13 |
| Todd Kane | 3213 | -8 | -0.22 | 0.58 | -0.81 | -9.1 | -0.26 | -0.05 | -0.21 |
| Jackson Irvine | 3178 | -4 | -0.11 | 0.19 | -0.30 | -11.9 | -0.34 | 0.21 | -0.55 |
| Eric Lichaj | 3163 | -7 | -0.20 | 0.46 | -0.66 | -6.7 | -0.19 | -0.28 | 0.09 |
| Kamil Grosicki | 3005 | 9 | 0.27 | -0.87 | 1.14 | -2.8 | -0.08 | -0.55 | 0.46 |
| Reece Burke | 2781 | 6 | 0.19 | -0.53 | 0.72 | -1.2 | -0.04 | -0.56 | 0.52 |
| Jordy de Wijs | 2631 | 10 | 0.34 | -0.72 | 1.06 | 1.1 | 0.04 | -0.64 | 0.68 |
| Fraizer Campbell | 2590 | -6 | -0.21 | 0.23 | -0.44 | -9.0 | -0.31 | -0.04 | -0.27 |
| Stephen Kingsley | 2165 | -2 | -0.08 | 0.00 | -0.08 | -6.1 | -0.25 | -0.16 | -0.09 |
| Dan Batty | 1824 | -3 | -0.15 | 0.04 | -0.19 | -4.3 | -0.21 | -0.21 | -0.01 |
| Tommy Elphick | 1620 | 0 | 0.00 | -0.07 | 0.07 | -3.7 | -0.20 | -0.21 | 0.01 |
| Kevin Stewart | 1597 | -1 | -0.06 | -0.04 | -0.02 | -6.8 | -0.38 | -0.10 | -0.28 |
| Chris Martin | 1402 | 9 | 0.58 | -0.36 | 0.94 | 0.8 | 0.05 | -0.34 | 0.40 |
| Evandro Goebel | 1184 | -3 | -0.23 | 0.03 | -0.26 | -1.8 | -0.14 | -0.24 | 0.10 |
| Robbie McKenzie | 1093 | -11 | -0.91 | 0.27 | -1.17 | -9.2 | -0.76 | -0.01 | -0.75 |
| Marc Pugh | 819 | 1 | 0.11 | -0.08 | 0.19 | -2.7 | -0.29 | -0.19 | -0.10 |
Ipswich Town (Actual 24th, xG 24th)
Performance by Match
Performance by Formation
| Starting Formation | Matches | Pts p90 | xPts p90 |
| 4-2-3-1 | 9 | 1.2 | 0.8 |
| 3-5-2 | 1 | 1.0 | 1.4 |
| 4-1-2-1-2 (Diamond Formation) | 2 | 1.0 | 1.0 |
| 3-4-1-2 | 1 | 1.0 | 0.4 |
| Unknown | 6 | 0.5 | 1.6 |
| 4-3-3 | 19 | 0.6 | 1.0 |
| 4-1-4-1 | 2 | 0.5 | 0.5 |
| 3-5-1-1 | 1 | 0.0 | 1.3 |
| 4-4-1-1 | 1 | 0.0 | 0.8 |
| 4-2-2-2 | 1 | 0.0 | 0.7 |
| 4-4-2 (Classic) | 2 | 0.0 | 0.6 |
| 5-3-2 | 1 | 0.0 | 0.7 |
Performance by Manager
Things started very badly for Paul Hurst and Paul Lambert didn’t improve upon them with performances actually deteriorating.
| Managerial Record | Matches | Pts p90 | Rank | xPts p90 | Rank |
| Paul Hurst | 14 | 0.6 | 24th | 1.1 | 22nd |
| Bryan Klug | 1 | 0.0 | 0.7 | ||
| Paul Lambert | 31 | 0.7 | 24th | 0.9 | 24th |
Attacking Performance by Player
| Player | Apps | Mins | GI | G | A | xG | xA | xGp90 | xAp90 |
| Freddie Sears | 24 | 1862 | 10 | 6 | 4 | 4.4 | 1.1 | 0.21 | 0.05 |
| Gwion Edwards | 33 | 2315 | 8 | 6 | 2 | 3.4 | 2.6 | 0.13 | 0.10 |
| Collin Quaner | 16 | 976 | 7 | 4 | 3 | 2.9 | 1.0 | 0.27 | 0.09 |
| Kayden Jackson | 34 | 1544 | 5 | 3 | 2 | 3.7 | 1.4 | 0.22 | 0.08 |
| Jon Nolan | 26 | 2001 | 3 | 3 | 0 | 2.7 | 1.5 | 0.12 | 0.07 |
| Trevoh Chalobah | 43 | 3275 | 3 | 2 | 1 | 3.7 | 1.3 | 0.10 | 0.04 |
| Will Keane | 11 | 716 | 3 | 3 | 0 | 2.3 | 0.5 | 0.29 | 0.07 |
| Ellis Harrison | 15 | 775 | 2 | 1 | 1 | 2.4 | 0.8 | 0.28 | 0.09 |
| Flynn Downes | 29 | 1849 | 2 | 1 | 1 | 0.8 | 1.6 | 0.04 | 0.08 |
| Grant Ward | 14 | 922 | 2 | 0 | 2 | 1.0 | 1.9 | 0.09 | 0.19 |
Overall Performance by Player (P=Playing, NP=Not Playing)
Hard to find a positive in such a poor season but Gwion Edwards posted some very interesting numbers. Ipswich had a Goal Difference per 90 mins (GDp90 P) of -0.35 when he was on the pitch compared to -1.58 without him (GDp90 NP) for an actual difference of 1.23. He is surely going to attract the attention of a Championship team this summer.
| Player | Mins | GD P | GDp90 P | GDp90 NP | Diff | xGD P | xGDp90 P | xGDp90 NP | Diff |
| Team Average | 4140 | -41 | -0.89 | -36.9 | -0.80 | ||||
| Luke Chambers | 3870 | -40 | -0.93 | -0.33 | -0.60 | -34.1 | -0.79 | -0.93 | 0.13 |
| Trevoh Chalobah | 3275 | -33 | -0.91 | -0.83 | -0.07 | -29.5 | -0.81 | -0.77 | -0.04 |
| Cole Skuse | 2710 | -24 | -0.80 | -1.07 | 0.27 | -25.8 | -0.86 | -0.70 | -0.16 |
| Matthew Pennington | 2700 | -26 | -0.87 | -0.94 | 0.07 | -24.4 | -0.81 | -0.78 | -0.03 |
| Bartosz Bialkowski | 2520 | -25 | -0.89 | -0.89 | 0.00 | -20.0 | -0.71 | -0.94 | 0.23 |
| Jonas Knudsen | 2475 | -24 | -0.87 | -0.92 | 0.05 | -15.3 | -0.56 | -1.17 | 0.61 |
| Gwion Edwards | 2315 | -9 | -0.35 | -1.58 | 1.23 | -14.2 | -0.55 | -1.12 | 0.57 |
| Jon Nolan | 2001 | -19 | -0.85 | -0.93 | 0.07 | -12.2 | -0.55 | -1.04 | 0.49 |
| Freddie Sears | 1862 | -21 | -1.02 | -0.79 | -0.22 | -21.0 | -1.02 | -0.63 | -0.39 |
| Flynn Downes | 1849 | -30 | -1.46 | -0.43 | -1.03 | -18.5 | -0.90 | -0.72 | -0.18 |
| Alan Judge | 1683 | -16 | -0.86 | -0.92 | 0.06 | -19.4 | -1.04 | -0.64 | -0.40 |
| Myles Kenlock | 1626 | -14 | -0.77 | -0.97 | 0.19 | -20.0 | -1.11 | -0.60 | -0.51 |
| Dean Gerken | 1620 | -16 | -0.89 | -0.89 | 0.00 | -16.9 | -0.94 | -0.71 | -0.23 |
| Aristote Nsiala | 1610 | -18 | -1.01 | -0.82 | -0.19 | -16.5 | -0.92 | -0.73 | -0.20 |
| Kayden Jackson | 1544 | -19 | -1.11 | -0.76 | -0.34 | -14.4 | -0.84 | -0.78 | -0.06 |
| Jordan Spence | 1387 | -19 | -1.23 | -0.72 | -0.51 | -9.4 | -0.61 | -0.90 | 0.29 |
| James Bree | 1170 | -13 | -1.00 | -0.85 | -0.15 | -14.6 | -1.13 | -0.68 | -0.45 |
| Teddy Bishop | 1068 | -10 | -0.84 | -0.91 | 0.07 | -8.3 | -0.70 | -0.84 | 0.14 |
Leeds United (Actual 3rd, xG 1st)
Performance by Match
Performance by Formation
| Starting Formation | Matches | Pts p90 | xPts p90 |
| 3-4-3 | 4 | 3.0 | 2.0 |
| 4-2-3-1 | 1 | 3.0 | 1.9 |
| 3-4-3 (Diamond Formation) | 1 | 3.0 | 1.3 |
| Unknown | 6 | 2.3 | 1.5 |
| 4-1-4-1 | 34 | 1.5 | 1.8 |
Attacking Performance by Player
| Player | Apps | Mins | GI | G | A | xG | xA | xGp90 | xAp90 |
| Pablo Hernv°ndez | 39 | 3334 | 24 | 12 | 12 | 9.4 | 12.1 | 0.26 | 0.33 |
| Mateusz Klich | 46 | 3824 | 18 | 10 | 8 | 6.1 | 5.5 | 0.14 | 0.13 |
| Kemar Roofe | 30 | 2338 | 16 | 14 | 2 | 15.7 | 2.3 | 0.61 | 0.09 |
| Ezgjan Alioski | 44 | 3663 | 12 | 7 | 5 | 6.9 | 7.0 | 0.17 | 0.17 |
| Patrick Bamford | 21 | 1361 | 11 | 9 | 2 | 8.8 | 1.9 | 0.58 | 0.13 |
| Luke Ayling | 38 | 3247 | 8 | 2 | 6 | 4.8 | 6.0 | 0.13 | 0.17 |
| Tyler Roberts | 28 | 1865 | 8 | 3 | 5 | 4.9 | 2.3 | 0.23 | 0.11 |
| Jack Harrison | 36 | 2413 | 6 | 4 | 2 | 4.4 | 4.0 | 0.16 | 0.15 |
| Barry Douglas | 28 | 2076 | 5 | 0 | 5 | 1.0 | 4.7 | 0.04 | 0.21 |
| Jack Clarke | 22 | 798 | 4 | 2 | 2 | 1.2 | 2.3 | 0.13 | 0.26 |
Overall Performance by Player (P=Playing, NP=Not Playing)
Pablo Hernandez has had a great season judged both on actual and xG performance. At the other end of the spectrum it doesn’t read positive for Pontus Jansson. Leeds had a Goal Difference per 90 mins (GDp90 NP) of 1.58 without him but just 0.22 with him (GDp90 P).
| Player | Mins | GD P | GDp90 P | GDp90 NP | Diff | xGD P | xGDp90 P | xGDp90 NP | Diff |
| Team Average | 4140 | 23 | 0.50 | 36.9 | 0.80 | ||||
| Mateusz Klich | 3824 | 19 | 0.45 | 1.14 | -0.69 | 33.9 | 0.80 | 0.87 | -0.07 |
| Ezgjan Alioski | 3663 | 21 | 0.52 | 0.38 | 0.14 | 28.5 | 0.70 | 1.58 | -0.88 |
| Kalvin Phillips | 3551 | 23 | 0.58 | 0.00 | 0.58 | 31.5 | 0.80 | 0.83 | -0.03 |
| Liam Cooper | 3351 | 20 | 0.54 | 0.34 | 0.19 | 28.9 | 0.78 | 0.91 | -0.14 |
| Pablo Hernv°ndez | 3334 | 21 | 0.57 | 0.22 | 0.34 | 33.9 | 0.92 | 0.33 | 0.59 |
| Pontus Jansson | 3283 | 8 | 0.22 | 1.58 | -1.36 | 27.6 | 0.76 | 0.97 | -0.21 |
| Luke Ayling | 3247 | 17 | 0.47 | 0.60 | -0.13 | 24.4 | 0.68 | 1.26 | -0.58 |
| Bailey Peacock-Farrell | 2520 | 16 | 0.57 | 0.39 | 0.18 | 18.9 | 0.67 | 1.00 | -0.33 |
| Jack Harrison | 2413 | 8 | 0.30 | 0.78 | -0.48 | 21.2 | 0.79 | 0.82 | -0.02 |
| Kemar Roofe | 2338 | 11 | 0.42 | 0.60 | -0.18 | 23.4 | 0.90 | 0.67 | 0.23 |
| Barry Douglas | 2076 | 15 | 0.65 | 0.35 | 0.30 | 16.9 | 0.73 | 0.87 | -0.14 |
| Adam Forshaw | 1883 | 3 | 0.14 | 0.80 | -0.65 | 19.6 | 0.94 | 0.69 | 0.25 |
| Tyler Roberts | 1865 | 8 | 0.39 | 0.59 | -0.21 | 14.7 | 0.71 | 0.88 | -0.17 |
| Francisco Casilla Cortv©s | 1530 | 5 | 0.29 | 0.62 | -0.33 | 16.6 | 0.98 | 0.70 | 0.28 |
| Samuel Sv°iz | 1370 | 16 | 1.05 | 0.23 | 0.82 | 13.2 | 0.87 | 0.77 | 0.10 |
| Patrick Bamford | 1361 | 10 | 0.66 | 0.42 | 0.24 | 12.5 | 0.83 | 0.79 | 0.04 |
| Stuart Dallas | 1242 | 1 | 0.07 | 0.68 | -0.61 | 12.8 | 0.93 | 0.75 | 0.18 |
| Gaetano Berardi | 896 | 10 | 1.00 | 0.36 | 0.64 | 6.3 | 0.63 | 0.85 | -0.21 |
Middlesbrough (Actual 7th, xG 9th)
Performance by Match
Performance by Formation
| Starting Formation | Matches | Pts p90 | xPts p90 |
| 3-5-2 | 2 | 3.0 | 1.3 |
| Unknown | 6 | 2.3 | 1.5 |
| 5-4-1 | 3 | 2.0 | 1.2 |
| 4-3-3 | 9 | 1.7 | 1.6 |
| 3-5-1-1 | 9 | 1.8 | 1.5 |
| 4-2-3-1 | 4 | 1.3 | 1.3 |
| 3-4-1-2 | 1 | 1.0 | 1.9 |
| 5-3-2 | 2 | 1.0 | 1.4 |
| 3-4-2-1 | 10 | 0.8 | 1.3 |
Performance by Manager
Although results were okay under Aitor Karanka performances were poor. Under Martin O’Neill points have been picked up at a slower pace but xG performances have improved. A mixed season all round.
| Managerial Record | Matches | Pts p90 | Rank | xPts p90 | Rank |
| Aitor Karanka | 26 | 1.5 | 9th | 1.3 | 20th |
| Martin O’Neill | 20 | 1.4 | 13th | 1.4 | 14th |
Attacking Performance by Player
| Player | Apps | Mins | GI | G | A | xG | xA | xGp90 | xAp90 |
| Britt Assombalonga | 42 | 2684 | 14 | 14 | 0 | 12.6 | 2.4 | 0.42 | 0.08 |
| Jordan Hugill | 36 | 1785 | 8 | 6 | 2 | 9.7 | 1.3 | 0.49 | 0.07 |
| Jonny Howson | 46 | 3943 | 7 | 1 | 6 | 4.1 | 8.3 | 0.09 | 0.19 |
| Muhamed Besic | 37 | 2340 | 7 | 2 | 5 | 2.3 | 4.8 | 0.09 | 0.18 |
| Lewis Wing | 28 | 1798 | 6 | 3 | 3 | 3.1 | 4.1 | 0.16 | 0.21 |
| Ashley Fletcher | 21 | 1155 | 5 | 5 | 0 | 4.8 | 1.8 | 0.37 | 0.14 |
| Dael Fry | 34 | 2863 | 4 | 0 | 4 | 1.0 | 1.6 | 0.03 | 0.05 |
| George Friend | 38 | 3271 | 4 | 2 | 2 | 3.3 | 2.5 | 0.09 | 0.07 |
| George Saville | 34 | 2520 | 4 | 4 | 0 | 3.2 | 4.8 | 0.12 | 0.17 |
| Marcus Tavernier | 19 | 483 | 4 | 3 | 1 | 1.3 | 1.3 | 0.25 | 0.25 |
Overall Performance by Player (P=Playing, NP=Not Playing)
Lewis Wing catches the eye. Boro have posted positive numbers when playing and negative numbers without him. He will become an integral part of the promotion push next season if he can add more goals and assists.
| Player | Mins | GD P | GDp90 P | GDp90 NP | Diff | xGD P | xGDp90 P | xGDp90 NP | Diff |
| Team Average | 4140 | 8 | 0.17 | 4.8 | 0.10 | ||||
| Darren Randolph | 4140 | 8 | 0.17 | 4.8 | 0.10 | ||||
| Jonny Howson | 3943 | 7 | 0.16 | 0.46 | -0.30 | 6.0 | 0.14 | -0.54 | 0.68 |
| Aden Flint | 3544 | 6 | 0.15 | 0.30 | -0.15 | 2.6 | 0.07 | 0.34 | -0.27 |
| George Friend | 3271 | 4 | 0.11 | 0.41 | -0.30 | 5.9 | 0.16 | -0.11 | 0.28 |
| Ryan Shotton | 2877 | 7 | 0.22 | 0.07 | 0.15 | -0.6 | -0.02 | 0.39 | -0.41 |
| Dael Fry | 2863 | 7 | 0.22 | 0.07 | 0.15 | 1.8 | 0.06 | 0.21 | -0.16 |
| Daniel Ayala | 2776 | 1 | 0.03 | 0.46 | -0.43 | 4.8 | 0.16 | 0.00 | 0.16 |
| Britt Assombalonga | 2684 | 8 | 0.27 | 0.00 | 0.27 | 4.4 | 0.15 | 0.02 | 0.13 |
| George Saville | 2520 | 6 | 0.21 | 0.11 | 0.10 | 3.2 | 0.12 | 0.09 | 0.03 |
| Adam Clayton | 2489 | -3 | -0.11 | 0.60 | -0.71 | -5.4 | -0.20 | 0.56 | -0.75 |
| Muhamed Besic | 2340 | 13 | 0.50 | -0.25 | 0.75 | 9.9 | 0.38 | -0.25 | 0.63 |
| Stewart Downing | 2336 | -4 | -0.15 | 0.60 | -0.75 | -0.8 | -0.03 | 0.28 | -0.31 |
| Lewis Wing | 1798 | 16 | 0.80 | -0.31 | 1.11 | 9.5 | 0.48 | -0.18 | 0.66 |
| Jordan Hugill | 1785 | 0 | 0.00 | 0.31 | -0.31 | -1.0 | -0.05 | 0.22 | -0.27 |
| John Obi Mikel | 1600 | -4 | -0.23 | 0.43 | -0.65 | -3.7 | -0.21 | 0.30 | -0.51 |
| Ashley Fletcher | 1155 | 6 | 0.47 | 0.06 | 0.41 | 5.3 | 0.42 | -0.02 | 0.43 |
| Martin Braithwaite | 1109 | 10 | 0.81 | -0.06 | 0.87 | 5.3 | 0.43 | -0.02 | 0.45 |
| Paddy McNair | 733 | -2 | -0.25 | 0.26 | -0.51 | -1.4 | -0.18 | 0.16 | -0.34 |
Millwall (Actual 21st, xG 7th)
Performance by Match
Performance by Formation
| Starting Formation | Matches | Pts p90 | xPts p90 |
| 4-5-1 | 1 | 3.0 | 1.1 |
| 4-4-1-1 | 10 | 1.0 | 1.2 |
| 4-2-3-1 | 1 | 1.0 | 1.6 |
| 3-5-1-1 | 1 | 1.0 | 1.3 |
| 4-4-2 (Classic) | 27 | 0.9 | 1.6 |
| Unknown | 6 | 0.8 | 1.3 |
Attacking Performance by Player
| Player | Apps | Mins | GI | G | A | xG | xA | xGp90 | xAp90 |
| Lee Gregory | 43 | 3545 | 17 | 10 | 7 | 15.1 | 3.5 | 0.38 | 0.09 |
| Jake Cooper | 46 | 4140 | 12 | 6 | 6 | 9.0 | 3.5 | 0.20 | 0.08 |
| Jed Wallace | 42 | 3685 | 7 | 5 | 2 | 6.0 | 6.7 | 0.15 | 0.16 |
| Shaun Williams | 31 | 2636 | 7 | 5 | 2 | 3.7 | 5.4 | 0.13 | 0.18 |
| Steve Morison | 41 | 1975 | 7 | 1 | 6 | 5.7 | 3.6 | 0.26 | 0.16 |
| Shane Ferguson | 35 | 2465 | 6 | 2 | 4 | 2.2 | 8.1 | 0.08 | 0.29 |
| Ben Thompson | 13 | 1014 | 4 | 4 | 0 | 1.2 | 0.7 | 0.11 | 0.06 |
| Tom Elliott | 32 | 1220 | 4 | 3 | 1 | 4.1 | 1.7 | 0.30 | 0.13 |
| Aiden O Brien | 35 | 1498 | 3 | 2 | 1 | 3.1 | 0.8 | 0.19 | 0.05 |
| Ryan Leonard | 37 | 3298 | 3 | 2 | 1 | 3.3 | 1.3 | 0.09 | 0.04 |
Overall Performance by Player (P=Playing, NP=Not Playing)
The goals of Lee Gregory kept the Lions in the Championship this season and he will be sorely missed if he does move on during the summer. Millwall had a Goal Difference per 90 mins (GDp90 P) of -0.23 when he was on the pitch compared to -1.06 without him (GDp90 NP) for an actual difference of 0.83.
| Player | Mins | GD P | GDp90 P | GDp90 NP | Diff | xGD P | xGDp90 P | xGDp90 NP | Diff |
| Team Average | 4140 | -16 | -0.35 | 10.2 | 0.22 | ||||
| Jake Cooper | 4140 | -16 | -0.35 | 10.2 | 0.22 | ||||
| Jed Wallace | 3685 | -15 | -0.37 | -0.20 | -0.17 | 6.3 | 0.15 | 0.79 | -0.63 |
| Mahlon Romeo | 3619 | -11 | -0.27 | -0.86 | 0.59 | 9.4 | 0.23 | 0.15 | 0.08 |
| Lee Gregory | 3545 | -9 | -0.23 | -1.06 | 0.83 | 12.5 | 0.32 | -0.34 | 0.66 |
| Ryan Leonard | 3298 | -11 | -0.30 | -0.53 | 0.23 | 8.5 | 0.23 | 0.19 | 0.04 |
| Shaun Williams | 2636 | -16 | -0.55 | 0.00 | -0.55 | 4.4 | 0.15 | 0.35 | -0.20 |
| James Meredith | 2615 | -22 | -0.76 | 0.35 | -1.11 | 4.6 | 0.16 | 0.34 | -0.18 |
| Shane Ferguson | 2465 | -3 | -0.11 | -0.70 | 0.59 | 13.6 | 0.50 | -0.18 | 0.68 |
| Jordan Archer | 2160 | -10 | -0.42 | -0.27 | -0.14 | 5.6 | 0.24 | 0.21 | 0.03 |
| Shaun Hutchinson | 2148 | -8 | -0.34 | -0.36 | 0.03 | 6.2 | 0.26 | 0.18 | 0.08 |
| Steve Morison | 1975 | -9 | -0.41 | -0.29 | -0.12 | 6.6 | 0.30 | 0.15 | 0.15 |
| Ryan Tunnicliffe | 1958 | -10 | -0.46 | -0.25 | -0.21 | 1.7 | 0.08 | 0.35 | -0.28 |
| Murray Wallace | 1638 | -8 | -0.44 | -0.29 | -0.15 | 3.8 | 0.21 | 0.23 | -0.03 |
| Aiden O Brien | 1498 | -1 | -0.06 | -0.51 | 0.45 | 7.1 | 0.43 | 0.11 | 0.32 |
| Tom Elliott | 1220 | -4 | -0.30 | -0.37 | 0.07 | 10.8 | 0.80 | -0.02 | 0.81 |
| Ben Marshall | 1183 | 2 | 0.15 | -0.55 | 0.70 | -1.4 | -0.10 | 0.35 | -0.46 |
| Ben Amos | 1080 | -6 | -0.50 | -0.29 | -0.21 | 4.8 | 0.40 | 0.16 | 0.24 |
| Ben Thompson | 1014 | -1 | -0.09 | -0.43 | 0.34 | 0.9 | 0.08 | 0.27 | -0.19 |
Norwich City (Actual 1st, xG 3rd)
Performance by Match
Performance by Formation
| Starting Formation | Matches | Pts p90 | xPts p90 |
| 4-2-3-1 | 40 | 2.2 | 1.6 |
| Unknown | 6 | 0.8 | 1.4 |
Attacking Performance by Player
| Player | Apps | Mins | GI | G | A | xG | xA | xGp90 | xAp90 |
| Teemu Pukki | 42 | 3738 | 38 | 29 | 9 | 19.6 | 6.3 | 0.47 | 0.15 |
| Emiliano Buendv?a Stati | 38 | 2881 | 20 | 8 | 12 | 8.0 | 9.6 | 0.25 | 0.30 |
| Mario Vrancic | 35 | 1477 | 17 | 10 | 7 | 3.8 | 2.8 | 0.23 | 0.17 |
| Onel Hernv°ndez | 40 | 3145 | 17 | 8 | 9 | 8.6 | 7.4 | 0.25 | 0.21 |
| Marco Stiepermann | 43 | 3308 | 15 | 9 | 6 | 7.0 | 8.5 | 0.19 | 0.23 |
| Kenny McLean | 19 | 1344 | 9 | 3 | 6 | 1.6 | 2.5 | 0.11 | 0.17 |
| Maximillian Aarons | 41 | 3665 | 8 | 2 | 6 | 1.8 | 4.6 | 0.04 | 0.11 |
| Jordan Rhodes | 31 | 1011 | 7 | 6 | 1 | 5.2 | 0.3 | 0.47 | 0.03 |
| Ben Godfrey | 28 | 2386 | 6 | 4 | 2 | 4.0 | 0.6 | 0.15 | 0.02 |
| Timm Klose | 25 | 2117 | 5 | 4 | 1 | 2.9 | 0.2 | 0.12 | 0.01 |
Overall Performance by Player (P=Playing, NP=Not Playing)
Teemu Pukki had an outstanding season and looks great on all my metrics. However, to shine the light on a couple of the supporting cast both Christoph Zimmermann (1.59 actual difference) and Emiliano Buendia (1.23 actual difference) catch the eye. The German centre half Zimmermann will need to maintain the high standards to keep the Canaries in the Premier League. While at just 22 years old Bunedia has a very bright future and is one to watch next season.
| Player | Mins | GD P | GDp90 P | GDp90 NP | Diff | xGD P | xGDp90 P | xGDp90 NP | Diff |
| Team Average | 4140 | 36 | 0.78 | 16.8 | 0.37 | ||||
| Tim Krul | 4140 | 36 | 0.78 | 16.8 | 0.37 | ||||
| Teemu Pukki | 3738 | 35 | 0.84 | 0.22 | 0.62 | 15.5 | 0.37 | 0.31 | 0.07 |
| Jamal Lewis | 3716 | 30 | 0.73 | 1.27 | -0.55 | 11.4 | 0.28 | 1.16 | -0.88 |
| Maximillian Aarons | 3665 | 38 | 0.93 | -0.38 | 1.31 | 14.7 | 0.36 | 0.40 | -0.04 |
| Christoph Zimmermann | 3496 | 40 | 1.03 | -0.56 | 1.59 | 14.2 | 0.37 | 0.37 | 0.00 |
| Marco Stiepermann | 3308 | 29 | 0.79 | 0.76 | 0.03 | 17.3 | 0.47 | -0.05 | 0.52 |
| Onel Hernv°ndez | 3145 | 29 | 0.83 | 0.63 | 0.20 | 12.4 | 0.36 | 0.40 | -0.04 |
| Emiliano Buendv?a Stati | 2881 | 37 | 1.16 | -0.07 | 1.23 | 12.9 | 0.40 | 0.28 | 0.13 |
| Ben Godfrey | 2386 | 23 | 0.87 | 0.67 | 0.20 | 11.3 | 0.43 | 0.28 | 0.14 |
| Alexander Tettey | 2378 | 14 | 0.53 | 1.12 | -0.59 | 7.6 | 0.29 | 0.47 | -0.18 |
| Timm Klose | 2117 | 13 | 0.55 | 1.02 | -0.47 | 9.4 | 0.40 | 0.33 | 0.07 |
| Tom Trybull | 1929 | 13 | 0.61 | 0.94 | -0.33 | 4.3 | 0.20 | 0.51 | -0.31 |
| Moritz Leitner | 1709 | 14 | 0.74 | 0.81 | -0.08 | 4.9 | 0.26 | 0.44 | -0.19 |
| Todd Cantwell | 1598 | 3 | 0.17 | 1.17 | -1.00 | 2.6 | 0.15 | 0.50 | -0.36 |
| Mario Vrancic | 1477 | 23 | 1.40 | 0.44 | 0.96 | 7.9 | 0.48 | 0.30 | 0.18 |
| Kenny McLean | 1344 | 17 | 1.14 | 0.61 | 0.53 | 10.3 | 0.69 | 0.21 | 0.48 |
| Jordan Rhodes | 1011 | 8 | 0.71 | 0.81 | -0.09 | 7.8 | 0.69 | 0.26 | 0.43 |
| Grant Hanley | 571 | -2 | -0.32 | 0.96 | -1.27 | 0.4 | 0.06 | 0.42 | -0.36 |
Nottingham Forest (Actual 9th, xG 16th)
Performance by Match
Performance by Formation
| Starting Formation | Matches | Pts p90 | xPts p90 |
| 3-4-3 | 1 | 3.0 | 1.9 |
| 4-1-2-1-2 (Diamond Formation) | 1 | 3.0 | 1.9 |
| 3-4-2-1 | 2 | 3.0 | 1.8 |
| 4-3-3 | 3 | 2.3 | 1.2 |
| 4-2-3-1 | 25 | 1.4 | 1.3 |
| Unknown | 6 | 1.2 | 1.1 |
| 4-1-4-1 | 3 | 1.0 | 1.5 |
| 4-3-2-1 | 2 | 0.5 | 1.1 |
| 4-4-2 (Classic) | 2 | 0.0 | 1.5 |
| 4-5-1 | 1 | 0.0 | 1.0 |
Attacking Performance by Player
| Player | Apps | Mins | GI | G | A | xG | xA | xGp90 | xAp90 |
| Joe Lolley | 45 | 3537 | 22 | 11 | 11 | 11.8 | 10.3 | 0.30 | 0.26 |
| Lewis Grabban | 39 | 2731 | 19 | 16 | 3 | 12.8 | 2.2 | 0.42 | 0.07 |
| Jov£o Carvalho | 38 | 2557 | 12 | 4 | 8 | 3.3 | 4.6 | 0.12 | 0.16 |
| Daryl Murphy | 28 | 1527 | 7 | 4 | 3 | 4.6 | 1.7 | 0.27 | 0.10 |
| Matthew Cash | 34 | 2433 | 7 | 6 | 1 | 5.3 | 2.5 | 0.20 | 0.09 |
| Ben Osborn | 39 | 2684 | 6 | 1 | 5 | 1.5 | 4.7 | 0.05 | 0.16 |
| Adlv®ne Guv©dioura | 27 | 1715 | 4 | 2 | 2 | 1.9 | 0.7 | 0.10 | 0.04 |
| Jack Colback | 38 | 3387 | 4 | 3 | 1 | 1.0 | 1.5 | 0.03 | 0.04 |
| Jack Robinson | 38 | 3234 | 4 | 2 | 2 | 1.4 | 2.2 | 0.04 | 0.06 |
| Karim Ansarifard | 10 | 287 | 3 | 2 | 1 | 1.8 | 0.0 | 0.55 | 0.01 |
Overall Performance by Player (P=Playing, NP=Not Playing)
Jack Robinson and Joao Carvalho look key to any chance of success next season. They are stand out performers on the numbers and Martin O’Neill will be hoping for he can keep hold of both them. Forest have a 0.33 Goal Difference (GDp90 P) when Robinson has played but -0.50 without him (GDp90 NP). Likewise for Carvalho, Forest have a GDp90 P of 0.60 and GDp90 NP of -0.57 in his minutes.
| Player | Mins | GD P | GDp90 P | GDp90 NP | Diff | xGD P | xGDp90 P | xGDp90 NP | Diff |
| Team Average | 4140 | 7 | 0.15 | -7.7 | -0.17 | ||||
| Costel Pantilimon | 3960 | 9 | 0.20 | -1.00 | 1.20 | -8.3 | -0.19 | 0.32 | -0.51 |
| Joe Lolley | 3537 | 7 | 0.18 | 0.00 | 0.18 | -7.1 | -0.18 | -0.08 | -0.10 |
| Jack Colback | 3387 | 2 | 0.05 | 0.60 | -0.54 | -10.2 | -0.27 | 0.30 | -0.57 |
| Jack Robinson | 3234 | 12 | 0.33 | -0.50 | 0.83 | -1.2 | -0.03 | -0.65 | 0.62 |
| Lewis Grabban | 2731 | 8 | 0.26 | -0.06 | 0.33 | -5.5 | -0.18 | -0.14 | -0.04 |
| Ben Osborn | 2684 | 8 | 0.27 | -0.06 | 0.33 | -0.3 | -0.01 | -0.46 | 0.45 |
| Jov£o Carvalho | 2557 | 17 | 0.60 | -0.57 | 1.17 | -6.1 | -0.21 | -0.09 | -0.12 |
| Tendayi Darikwa | 2520 | 7 | 0.25 | 0.00 | 0.25 | -6.9 | -0.25 | -0.04 | -0.20 |
| Matthew Cash | 2433 | 4 | 0.15 | 0.16 | -0.01 | -6.5 | -0.24 | -0.06 | -0.18 |
| Adlv®ne Guv©dioura | 1715 | 5 | 0.26 | 0.07 | 0.19 | -2.6 | -0.14 | -0.19 | 0.05 |
| Daniel Fox | 1581 | 3 | 0.17 | 0.14 | 0.03 | -9.9 | -0.56 | 0.08 | -0.64 |
| Daryl Murphy | 1527 | -5 | -0.29 | 0.41 | -0.71 | -2.5 | -0.15 | -0.18 | 0.03 |
| Yohan Benalouane | 1260 | -6 | -0.43 | 0.41 | -0.83 | -0.3 | -0.02 | -0.23 | 0.21 |
| Ryan Yates | 1231 | 1 | 0.07 | 0.19 | -0.11 | 3.3 | 0.24 | -0.34 | 0.59 |
| Saidy Janko | 1206 | -2 | -0.15 | 0.28 | -0.43 | -4.6 | -0.34 | -0.10 | -0.25 |
| Ben Watson | 1202 | 0 | 0.00 | 0.21 | -0.21 | -3.8 | -0.29 | -0.12 | -0.17 |
| Michael Hefele | 1120 | 0 | 0.00 | 0.21 | -0.21 | -4.7 | -0.38 | -0.09 | -0.29 |
| Tobias Figueiredo | 1031 | 8 | 0.70 | -0.03 | 0.73 | -4.4 | -0.39 | -0.09 | -0.29 |
Preston North End (Actual 14th, xG 12th)
Performance by Match
Performance by Formation
| Starting Formation | Matches | Pts p90 | xPts p90 |
| Unknown | 6 | 0.8 | 1.4 |
| 3-4-2-1 | 1 | 0.0 | 2.1 |
| 4-2-3-1 | 31 | 1.3 | 1.3 |
| 5-3-2 | 1 | 0.0 | 0.7 |
| 3-5-2 | 2 | 1.5 | 1.0 |
| 4-3-3 | 1 | 3.0 | 1.8 |
| 4-1-4-1 | 4 | 2.3 | 1.2 |
Attacking Performance by Player
| Player | Apps | Mins | GI | G | A | xG | xA | xGp90 | xAp90 |
| Alan Browne | 38 | 3171 | 17 | 12 | 5 | 6.4 | 4.4 | 0.18 | 0.12 |
| Callum Robinson | 27 | 2042 | 15 | 12 | 3 | 7.4 | 3.7 | 0.32 | 0.16 |
| Paul Gallagher | 39 | 2464 | 13 | 6 | 7 | 4.9 | 7.3 | 0.18 | 0.27 |
| Daniel Johnson | 34 | 2474 | 11 | 6 | 5 | 4.2 | 3.3 | 0.15 | 0.12 |
| Lukas Nmecha | 41 | 2319 | 9 | 4 | 5 | 7.3 | 3.5 | 0.28 | 0.13 |
| Sean Maguire | 26 | 1822 | 7 | 3 | 4 | 4.7 | 4.0 | 0.23 | 0.20 |
| Tom Barkhuizen | 34 | 2355 | 7 | 6 | 1 | 4.6 | 2.5 | 0.17 | 0.10 |
| Andrew Hughes | 32 | 2792 | 5 | 3 | 2 | 2.4 | 2.0 | 0.08 | 0.06 |
| Louis Moult | 23 | 927 | 5 | 4 | 1 | 2.3 | 1.5 | 0.23 | 0.15 |
| Darnell Fisher | 35 | 2872 | 4 | 0 | 4 | 0.7 | 3.2 | 0.02 | 0.10 |
Overall Performance by Player (P=Playing, NP=Not Playing)
Looking at the players with the most minutes Ben Pearson has the biggest positive influence on the Lilywhites. Preston had a Goal Difference per 90 mins (GDp90 P) of 0.37 when he was on the pitch compared to -0.68 without him (GDp90 NP). Conversely, the team performed better without Darnell Fisher.
| Player | Mins | GD P | GDp90 P | GDp90 NP | Diff | xGD P | xGDp90 P | xGDp90 NP | Diff |
| Team Average | 4140 | 0 | 0.00 | -3.5 | -0.08 | ||||
| Ben Davies | 3456 | 3 | 0.08 | -0.39 | 0.47 | -5.2 | -0.13 | 0.22 | -0.36 |
| Declan Rudd | 3240 | 0 | 0.00 | 0.00 | 0.00 | -1.2 | -0.03 | -0.23 | 0.20 |
| Alan Browne | 3171 | 1 | 0.03 | -0.09 | 0.12 | -5.2 | -0.15 | 0.16 | -0.31 |
| Darnell Fisher | 2872 | -8 | -0.25 | 0.57 | -0.82 | -5.0 | -0.16 | 0.10 | -0.26 |
| Andrew Hughes | 2792 | 7 | 0.23 | -0.47 | 0.69 | 1.2 | 0.04 | -0.31 | 0.35 |
| Ben Pearson | 2689 | 11 | 0.37 | -0.68 | 1.05 | 1.9 | 0.06 | -0.33 | 0.39 |
| Jordan Storey | 2485 | 4 | 0.14 | -0.22 | 0.36 | -1.5 | -0.05 | -0.11 | 0.06 |
| Daniel Johnson | 2474 | -3 | -0.11 | 0.16 | -0.27 | -7.9 | -0.29 | 0.24 | -0.52 |
| Paul Gallagher | 2464 | 5 | 0.18 | -0.27 | 0.45 | -0.3 | -0.01 | -0.17 | 0.16 |
| Tom Barkhuizen | 2355 | 1 | 0.04 | -0.05 | 0.09 | 1.0 | 0.04 | -0.23 | 0.27 |
| Lukas Nmecha | 2319 | -8 | -0.31 | 0.40 | -0.71 | -2.6 | -0.10 | -0.04 | -0.06 |
| Callum Robinson | 2042 | -6 | -0.26 | 0.26 | -0.52 | -5.1 | -0.23 | 0.07 | -0.30 |
| Tom Clarke | 1855 | 3 | 0.15 | -0.12 | 0.26 | 1.6 | 0.08 | -0.20 | 0.28 |
| Paul Huntington | 1845 | -6 | -0.29 | 0.24 | -0.53 | -0.4 | -0.02 | -0.12 | 0.10 |
| Sean Maguire | 1822 | 12 | 0.59 | -0.47 | 1.06 | -1.3 | -0.07 | -0.08 | 0.02 |
| Ryan Ledson | 1290 | -13 | -0.91 | 0.41 | -1.32 | -5.2 | -0.36 | 0.05 | -0.41 |
| Joshua Earl | 1055 | -7 | -0.60 | 0.20 | -0.80 | -4.8 | -0.41 | 0.04 | -0.45 |
| Louis Moult | 927 | -1 | -0.10 | 0.03 | -0.13 | -1.0 | -0.10 | -0.07 | -0.03 |
Queens Park Rangers (Actual 19th, xG 10th)
Performance by Match
Performance by Formation
| Starting Formation | Matches | Pts p90 | xPts p90 |
| 4-1-4-1 | 2 | 1.5 | 1.5 |
| 4-4-1-1 | 22 | 1.5 | 1.5 |
| 4-2-3-1 | 6 | 1.2 | 1.0 |
| Unknown | 6 | 0.7 | 1.2 |
| 4-4-2 (Classic) | 8 | 0.6 | 1.6 |
| 3-5-2 | 2 | 0.0 | 1.3 |
Performance by Manager
Although struggling in the table at the point of Steve McClaren’s departure expected performances were strong. The team have performed worse under John Eustace.
| Managerial Record | Matches | Pts p90 | Rank | xPts p90 | Rank |
| Steve McClaren | 39 | 1.1 | 19th | 1.4 | 8th |
| John Eustace | 7 | 1.0 | 21st | 1.3 | 20th |
Attacking Performance by Player
| Player | Apps | Mins | GI | G | A | xG | xA | xGp90 | xAp90 |
| Luke Freeman | 43 | 3777 | 13 | 7 | 6 | 6.6 | 10.0 | 0.16 | 0.24 |
| Nahki Wells | 40 | 2860 | 13 | 7 | 6 | 10.4 | 3.6 | 0.33 | 0.11 |
| Pawel Wszolek | 37 | 2448 | 8 | 4 | 4 | 3.9 | 3.4 | 0.14 | 0.13 |
| Eberechi Eze | 42 | 3192 | 7 | 4 | 3 | 5.4 | 2.6 | 0.15 | 0.07 |
| Massimo Luongo | 41 | 3620 | 7 | 3 | 4 | 5.8 | 3.3 | 0.14 | 0.08 |
| Matt Smith | 32 | 924 | 7 | 6 | 1 | 5.5 | 1.5 | 0.54 | 0.14 |
| Tomer Hemed | 26 | 1335 | 7 | 7 | 0 | 9.8 | 1.1 | 0.66 | 0.08 |
| Angel Rangel | 20 | 1736 | 4 | 2 | 2 | 0.7 | 1.3 | 0.04 | 0.07 |
| Jake Bidwell | 40 | 3484 | 4 | 0 | 4 | 1.6 | 4.4 | 0.04 | 0.11 |
| Josh Scowen | 34 | 2205 | 4 | 2 | 2 | 1.5 | 3.2 | 0.06 | 0.13 |
Overall Performance by Player (P=Playing, NP=Not Playing)
Two players stand head and shoulders above the rest of the squad: Joe Lumley and Toni Leistner. It’s noticeable how much worse the team have been without them with a GDp90 NP of -2.75 for Lumley and -2.69 for Leistner. Based on xG performance QPR are almost a goal a game better with them in the team then without. Between them they are forming the foundations of a solid defence.
| Player | Mins | GD P | GDp90 P | GDp90 NP | Diff | xGD P | xGDp90 P | xGDp90 NP | Diff |
| Team Average | 4140 | -18 | -0.39 | 1.4 | 0.03 | ||||
| Joe Lumley | 3780 | -7 | -0.17 | -2.75 | 2.58 | 4.7 | 0.11 | -0.81 | 0.92 |
| Luke Freeman | 3777 | -18 | -0.43 | 0.00 | -0.43 | -0.4 | -0.01 | 0.45 | -0.46 |
| Toni Leistner | 3739 | -6 | -0.14 | -2.69 | 2.55 | 4.8 | 0.12 | -0.77 | 0.88 |
| Massimo Luongo | 3620 | -10 | -0.25 | -1.38 | 1.14 | 4.5 | 0.11 | -0.54 | 0.65 |
| Jake Bidwell | 3484 | -18 | -0.46 | 0.00 | -0.46 | 1.4 | 0.04 | 0.01 | 0.03 |
| Eberechi Eze | 3192 | -10 | -0.28 | -0.76 | 0.48 | -1.9 | -0.05 | 0.31 | -0.37 |
| Joel Lynch | 3070 | -12 | -0.35 | -0.50 | 0.15 | 0.7 | 0.02 | 0.06 | -0.03 |
| Nahki Wells | 2860 | -9 | -0.28 | -0.63 | 0.35 | 1.1 | 0.03 | 0.02 | 0.01 |
| Pawel Wszolek | 2448 | -14 | -0.51 | -0.21 | -0.30 | -3.9 | -0.14 | 0.28 | -0.42 |
| Josh Scowen | 2205 | -14 | -0.57 | -0.19 | -0.39 | -3.5 | -0.14 | 0.23 | -0.37 |
| Jordan Cousins | 2107 | -12 | -0.51 | -0.27 | -0.25 | -4.4 | -0.19 | 0.26 | -0.44 |
| Darnell Furlong | 2074 | -11 | -0.48 | -0.30 | -0.17 | 0.2 | 0.01 | 0.05 | -0.05 |
| Angel Rangel | 1736 | 2 | 0.10 | -0.75 | 0.85 | 2.9 | 0.15 | -0.05 | 0.20 |
| Geoff Cameron | 1391 | -1 | -0.06 | -0.56 | 0.49 | 3.8 | 0.25 | -0.08 | 0.33 |
| Tomer Hemed | 1335 | 0 | 0.00 | -0.58 | 0.58 | 6.3 | 0.43 | -0.16 | 0.58 |
| Bright Samuel | 1129 | -5 | -0.40 | -0.39 | -0.01 | 3.8 | 0.30 | -0.07 | 0.37 |
| Matt Smith | 924 | -9 | -0.88 | -0.25 | -0.62 | 0.2 | 0.02 | 0.03 | -0.01 |
| Ryan Manning | 632 | -2 | -0.28 | -0.41 | 0.13 | 1.2 | 0.18 | 0.00 | 0.17 |
Reading (Actual 20th, xG 23rd)
Performance by Match
Performance by Formation
| Starting Formation | Matches | Pts p90 | xPts p90 |
| 4-1-4-1 | 1 | 3.0 | 0.5 |
| 4-3-3 | 10 | 1.3 | 1.0 |
| 4-2-3-1 | 23 | 1.1 | 1.0 |
| 4-3-2-1 | 1 | 1.0 | 0.8 |
| 5-3-2 | 3 | 0.7 | 0.5 |
| Unknown | 6 | 0.3 | 1.3 |
| 4-4-2 (Classic) | 1 | 0.0 | 0.4 |
| 4-3-1-2 | 1 | 0.0 | 0.5 |
Performance by Manager
A poor half season under Paul Clement was followed by an improved half season under José Gomes who steered them to safety. xG performance remained consistent throughout so Gomes has done well to keep them up.
| Managerial Record | Matches | Pts p90 | Rank | xPts p90 | Rank |
| Paul Clement | 20 | 0.9 | 22nd | 1.0 | 23rd |
| Scott Marshall | 3 | 0.3 | 0.6 | ||
| José Gomes | 23 | 1.2 | 17th | 1.0 | 23rd |
Attacking Performance by Player
| Player | Apps | Mins | GI | G | A | xG | xA | xGp90 | xAp90 |
| Yakou Meite | 37 | 2616 | 13 | 12 | 1 | 9.8 | 0.7 | 0.34 | 0.02 |
| Modou Barrow | 34 | 2150 | 10 | 4 | 6 | 2.7 | 4.0 | 0.11 | 0.17 |
| Jv=n Dadi Bv?dvarsson | 20 | 1002 | 7 | 7 | 0 | 3.8 | 0.6 | 0.34 | 0.05 |
| John Swift | 34 | 2548 | 6 | 3 | 3 | 4.5 | 4.7 | 0.16 | 0.17 |
| Leandro Bacuna | 26 | 2102 | 6 | 3 | 3 | 2.2 | 2.9 | 0.09 | 0.12 |
| Sam Baldock | 20 | 1364 | 6 | 5 | 1 | 4.5 | 1.2 | 0.30 | 0.08 |
| Andy Yiadom | 45 | 4050 | 5 | 1 | 4 | 1.8 | 3.7 | 0.04 | 0.08 |
| Garath McCleary | 31 | 1524 | 3 | 0 | 3 | 2.1 | 3.5 | 0.13 | 0.21 |
| Nv©lson Oliveira | 10 | 675 | 3 | 3 | 0 | 2.9 | 0.8 | 0.39 | 0.11 |
| Andy Rinomhota | 25 | 2114 | 2 | 1 | 1 | 0.6 | 1.3 | 0.02 | 0.05 |
Overall Performance by Player (P=Playing, NP=Not Playing)
Captain marvel Liam Moore is the standout for the Royals. Reading have looked pretty poor throughout the season albeit less poor when he’s been present. A goal difference per 90 (GDp90 P) of -0.24 when he’s played far superior to -1.00 without him (GDp90 NP).
| Player | Mins | GD P | GDp90 P | GDp90 NP | Diff | xGD P | xGDp90 P | xGDp90 NP | Diff |
| Team Average | 4140 | -17 | -0.37 | -36.3 | -0.79 | ||||
| Andy Yiadom | 4050 | -17 | -0.38 | 0.00 | -0.38 | -34.7 | -0.77 | -1.57 | 0.80 |
| Liam Moore | 3420 | -9 | -0.24 | -1.00 | 0.76 | -29.1 | -0.77 | -0.90 | 0.13 |
| Yakou Meite | 2616 | -16 | -0.55 | -0.06 | -0.49 | -25.8 | -0.89 | -0.62 | -0.27 |
| Tyler Blackett | 2578 | -11 | -0.38 | -0.35 | -0.04 | -29.8 | -1.04 | -0.38 | -0.66 |
| John Swift | 2548 | -7 | -0.25 | -0.57 | 0.32 | -20.3 | -0.72 | -0.90 | 0.19 |
| Modou Barrow | 2150 | -11 | -0.46 | -0.27 | -0.19 | -14.5 | -0.61 | -0.99 | 0.38 |
| Andy Rinomhota | 2114 | -7 | -0.30 | -0.44 | 0.15 | -22.5 | -0.96 | -0.61 | -0.35 |
| Leandro Bacuna | 2102 | -7 | -0.30 | -0.44 | 0.14 | -17.8 | -0.76 | -0.82 | 0.06 |
| Tiago Ilori | 1710 | -8 | -0.42 | -0.33 | -0.09 | -10.0 | -0.53 | -0.97 | 0.44 |
| Emiliano Martinez | 1620 | -5 | -0.28 | -0.43 | 0.15 | -13.9 | -0.77 | -0.80 | 0.03 |
| Matt Miazga | 1620 | -5 | -0.28 | -0.43 | 0.15 | -13.9 | -0.77 | -0.80 | 0.03 |
| Chris Gunter | 1557 | -6 | -0.35 | -0.38 | 0.04 | -17.4 | -1.01 | -0.66 | -0.35 |
| Garath McCleary | 1524 | -5 | -0.30 | -0.41 | 0.12 | -17.8 | -1.05 | -0.64 | -0.41 |
| Lewis Baker | 1479 | -7 | -0.43 | -0.34 | -0.09 | -14.3 | -0.87 | -0.75 | -0.12 |
| Liam Kelly | 1412 | -4 | -0.25 | -0.43 | 0.17 | -16.2 | -1.03 | -0.66 | -0.37 |
| Sam Baldock | 1364 | -4 | -0.26 | -0.42 | 0.16 | -12.3 | -0.81 | -0.78 | -0.04 |
| Anssi Jaakkola | 1350 | -8 | -0.53 | -0.29 | -0.24 | -16.9 | -1.13 | -0.63 | -0.50 |
| Oviemuno Ejaria | 1303 | -3 | -0.21 | -0.44 | 0.24 | -9.7 | -0.67 | -0.84 | 0.17 |
Rotherham United (Actual 22nd, xG 21st)
Performance by Match
Performance by Formation
| Starting Formation | Matches | Pts p90 | xPts p90 |
| 4-2-3-1 | 1 | 3.0 | 1.4 |
| 4-3-3 | 7 | 1.1 | 1.4 |
| 4-4-1-1 | 5 | 1.2 | 1.4 |
| 3-5-2 | 2 | 1.0 | 1.4 |
| Unknown | 6 | 1.0 | 1.0 |
| 4-1-4-1 | 23 | 0.7 | 1.1 |
| 4-4-2 (Classic) | 2 | 0.0 | 1.4 |
Attacking Performance by Player
| Player | Apps | Mins | GI | G | A | xG | xA | xGp90 | xAp90 |
| Will Vaulks | 41 | 3672 | 14 | 7 | 7 | 7.8 | 5.3 | 0.19 | 0.13 |
| Michael Smith | 44 | 3836 | 12 | 8 | 4 | 10.1 | 4.1 | 0.24 | 0.10 |
| Semi Ajayi | 46 | 4107 | 8 | 7 | 1 | 8.5 | 1.8 | 0.19 | 0.04 |
| Richard Towell | 34 | 2494 | 6 | 4 | 2 | 4.5 | 1.6 | 0.16 | 0.06 |
| Jon Taylor | 41 | 2527 | 5 | 4 | 1 | 5.0 | 3.3 | 0.18 | 0.12 |
| Ryan Manning | 18 | 1175 | 5 | 4 | 1 | 5.5 | 1.1 | 0.42 | 0.08 |
| Clark Robertson | 28 | 2366 | 4 | 3 | 1 | 4.0 | 1.0 | 0.15 | 0.04 |
| Joe Newell | 31 | 1640 | 4 | 0 | 4 | 2.4 | 6.3 | 0.13 | 0.34 |
| Anthony Forde | 28 | 1507 | 3 | 1 | 2 | 1.2 | 3.1 | 0.07 | 0.18 |
| Matt Crooks | 16 | 736 | 3 | 3 | 0 | 2.2 | 0.8 | 0.27 | 0.10 |
Overall Performance by Player (P=Playing, NP=Not Playing)
The top five players in the list below featured in around 90% of more of the total minutes and it’s noticeable how the team performed better when they were involved. If they can keep this nucleus of players together then that provides a strong foundation to build on next season in League One.
| Player | Mins | GD P | GDp90 P | GDp90 NP | Diff | xGD P | xGDp90 P | xGDp90 NP | Diff |
| Team Average | 4140 | -31 | -0.67 | -13.4 | -0.29 | ||||
| Semi Ajayi | 4107 | -30 | -0.66 | -2.73 | 2.07 | -13.5 | -0.30 | 0.20 | -0.50 |
| Marek Rodak | 4050 | -30 | -0.67 | -1.00 | 0.33 | -13.5 | -0.30 | 0.10 | -0.40 |
| Joe Mattock | 3890 | -26 | -0.60 | -1.80 | 1.20 | -12.1 | -0.28 | -0.49 | 0.21 |
| Michael Smith | 3836 | -25 | -0.59 | -1.78 | 1.19 | -11.5 | -0.27 | -0.56 | 0.29 |
| Will Vaulks | 3672 | -23 | -0.56 | -1.54 | 0.97 | -7.9 | -0.19 | -1.06 | 0.87 |
| Zak Vyner | 2583 | -25 | -0.87 | -0.35 | -0.52 | -6.7 | -0.23 | -0.39 | 0.15 |
| Jon Taylor | 2527 | -22 | -0.78 | -0.50 | -0.28 | -10.8 | -0.38 | -0.15 | -0.24 |
| Richard Towell | 2494 | -21 | -0.76 | -0.55 | -0.21 | -7.9 | -0.29 | -0.30 | 0.01 |
| Clark Robertson | 2366 | -12 | -0.46 | -0.96 | 0.51 | -2.0 | -0.07 | -0.58 | 0.51 |
| Ryan Williams | 2358 | -11 | -0.42 | -1.01 | 0.59 | -4.8 | -0.18 | -0.43 | 0.25 |
| Richard Wood | 2047 | -17 | -0.75 | -0.60 | -0.15 | -11.7 | -0.51 | -0.08 | -0.44 |
| Joe Newell | 1640 | -13 | -0.71 | -0.65 | -0.07 | -2.1 | -0.11 | -0.41 | 0.29 |
| Billy Jones | 1613 | -15 | -0.84 | -0.57 | -0.27 | -8.8 | -0.49 | -0.16 | -0.33 |
| Anthony Forde | 1507 | -16 | -0.96 | -0.51 | -0.44 | -5.8 | -0.34 | -0.26 | -0.08 |
| Michael Ihiekwe | 1317 | -10 | -0.68 | -0.67 | -0.01 | -4.4 | -0.30 | -0.29 | -0.01 |
| Ryan Manning | 1175 | -9 | -0.69 | -0.67 | -0.02 | -3.9 | -0.30 | -0.29 | 0.00 |
| Ben Wiles | 934 | -5 | -0.48 | -0.73 | 0.25 | -2.8 | -0.26 | -0.30 | 0.03 |
| Kyle Vassell | 897 | 0 | 0.00 | -0.86 | 0.86 | -1.5 | -0.15 | -0.33 | 0.18 |
Sheffield United (Actual 2nd, xG 2nd)
Performance by Match
Performance by Formation
| Starting Formation | Matches | Pts p90 | xPts p90 |
| 3-4-2-1 | 1 | 3.0 | 1.8 |
| 3-4-1-2 | 30 | 2.0 | 1.8 |
| Unknown | 6 | 2.0 | 1.6 |
| 3-5-2 | 9 | 1.7 | 1.5 |
Attacking Performance by Player
| Player | Apps | Mins | GI | G | A | xG | xA | xGp90 | xAp90 |
| Billy Sharp | 40 | 3026 | 27 | 23 | 4 | 15.5 | 2.6 | 0.46 | 0.08 |
| David McGoldrick | 45 | 3262 | 19 | 15 | 4 | 17.0 | 3.5 | 0.47 | 0.10 |
| John Fleck | 45 | 3975 | 12 | 2 | 10 | 2.9 | 8.7 | 0.07 | 0.20 |
| Mark Duffy | 36 | 2450 | 12 | 6 | 6 | 3.1 | 5.8 | 0.11 | 0.21 |
| Oliver Norwood | 43 | 3807 | 11 | 3 | 8 | 3.7 | 12.1 | 0.09 | 0.29 |
| Enda Stevens | 45 | 4029 | 10 | 4 | 6 | 3.6 | 5.7 | 0.08 | 0.13 |
| Jack O Connell | 41 | 3676 | 6 | 3 | 3 | 4.0 | 2.9 | 0.10 | 0.07 |
| Kieron Freeman | 20 | 1748 | 6 | 2 | 4 | 1.2 | 3.6 | 0.06 | 0.18 |
| Leon Clarke | 23 | 929 | 6 | 3 | 3 | 4.8 | 0.9 | 0.46 | 0.09 |
| Chris Basham | 41 | 3430 | 5 | 4 | 1 | 2.4 | 3.3 | 0.06 | 0.09 |
Overall Performance by Player (P=Playing, NP=Not Playing)
Tough to highlight standouts for a team who deservedly finished in the automatic spots and it will be interesting to see where Chris Wilder decides to invest. Three worth a mention are John Fleck, Oliver Norwood and Mark Duffy. The Blades were considerably stronger during their minutes on the pitch.
Sheffield United had a goal difference per 90 minutes (GDp90 P) of 0.88 when Fleck played compared to -1.09 without him (GDp90 NP). Likewise, it was a GDp90 P of 0.92 and GDp90 NP of -0.54 for Norwood, and a GDp90 P of 1.18 and GDp90 NP of 0.27 for Duffy.
| Player | Mins | GD P | GDp90 P | GDp90 NP | Diff | xGD P | xGDp90 P | xGDp90 NP | Diff |
| Team Average | 4140 | 37 | 0.80 | 28.9 | 0.63 | ||||
| Dean Henderson | 4140 | 37 | 0.80 | 28.9 | 0.63 | ||||
| Enda Stevens | 4029 | 35 | 0.78 | 1.62 | -0.84 | 28.3 | 0.63 | 0.52 | 0.11 |
| John Fleck | 3975 | 39 | 0.88 | -1.09 | 1.97 | 28.0 | 0.63 | 0.51 | 0.12 |
| John Egan | 3915 | 33 | 0.76 | 1.60 | -0.84 | 28.2 | 0.65 | 0.28 | 0.37 |
| Oliver Norwood | 3807 | 39 | 0.92 | -0.54 | 1.46 | 28.1 | 0.66 | 0.22 | 0.45 |
| Jack O Connell | 3676 | 32 | 0.78 | 0.97 | -0.19 | 26.2 | 0.64 | 0.53 | 0.11 |
| Chris Basham | 3430 | 22 | 0.58 | 1.90 | -1.32 | 23.5 | 0.62 | 0.69 | -0.07 |
| David McGoldrick | 3262 | 31 | 0.86 | 0.62 | 0.24 | 21.3 | 0.59 | 0.79 | -0.20 |
| Billy Sharp | 3026 | 30 | 0.89 | 0.57 | 0.33 | 19.4 | 0.58 | 0.77 | -0.19 |
| Mark Duffy | 2450 | 32 | 1.18 | 0.27 | 0.91 | 24.1 | 0.88 | 0.26 | 0.62 |
| George Baldock | 2275 | 17 | 0.67 | 0.97 | -0.29 | 14.0 | 0.55 | 0.72 | -0.17 |
| Kieron Freeman | 1748 | 17 | 0.88 | 0.75 | 0.12 | 15.1 | 0.78 | 0.52 | 0.26 |
| Leon Clarke | 929 | 1 | 0.10 | 1.01 | -0.91 | 6.8 | 0.66 | 0.62 | 0.04 |
| Martin Cranie | 881 | 10 | 1.02 | 0.75 | 0.28 | -0.3 | -0.04 | 0.81 | -0.84 |
| Gary Madine | 707 | 12 | 1.53 | 0.66 | 0.87 | 7.6 | 0.97 | 0.56 | 0.41 |
| Kieran Dowell | 666 | 7 | 0.95 | 0.78 | 0.17 | 6.1 | 0.82 | 0.59 | 0.23 |
| Richard Stearman | 437 | 5 | 1.03 | 0.78 | 0.25 | 2.4 | 0.49 | 0.64 | -0.15 |
| Scott Hogan | 434 | 11 | 2.28 | 0.63 | 1.65 | 4.5 | 0.94 | 0.59 | 0.35 |
Sheffield Wednesday (Actual 12th, xG 19th)
Performance by Match
Performance by Formation
| Starting Formation | Matches | Pts p90 | xPts p90 |
| 4-3-3 | 1 | 3.0 | 1.9 |
| 3-4-3 | 4 | 2.5 | 1.0 |
| Unknown | 6 | 1.7 | 1.2 |
| 4-1-4-1 | 5 | 1.6 | 1.5 |
| 4-4-1-1 | 4 | 1.5 | 1.6 |
| 4-4-2 (Classic) | 13 | 1.4 | 1.2 |
| 3-4-1-2 | 1 | 1.0 | 1.0 |
| 3-1-4-2 | 1 | 1.0 | 1.1 |
| 4-2-3-1 | 6 | 1.0 | 1.2 |
| 3-4-2-1 | 2 | 0.5 | 1.4 |
| 4-3-2-1 | 1 | 0.0 | 1.4 |
| 4-1-2-1-2 (Diamond Formation) | 2 | 0.0 | 1.5 |
Performance by Manager
Jos Luhukay rightly faced the chop with all three managers to take helm subsequently improving the team. Steve Bruce has achieved playoff results in his stint but they have performed as a mid table team on xG.
| Managerial Record | Matches | Pts p90 | Rank | xPts p90 | Rank |
| Jos Luhukay | 22 | 1.1 | 20th | 1.1 | 22nd |
| Lee Bullen | 4 | 2.0 | 1.7 | ||
| Steve Agnew | 2 | 1.5 | 1.3 | ||
| Steve Bruce | 18 | 1.6 | 6th | 1.4 | 12th |
Attacking Performance by Player
| Player | Apps | Mins | GI | G | A | xG | xA | xGp90 | xAp90 |
| Barry Bannan | 41 | 3596 | 16 | 5 | 11 | 3.2 | 8.7 | 0.08 | 0.22 |
| Adam Reach | 43 | 3764 | 15 | 8 | 7 | 6.0 | 7.1 | 0.14 | 0.17 |
| Steven Fletcher | 39 | 2445 | 13 | 11 | 2 | 10.7 | 2.2 | 0.39 | 0.08 |
| Lucas Jov£o | 31 | 1606 | 12 | 10 | 2 | 5.8 | 2.0 | 0.32 | 0.11 |
| Marco Matias | 31 | 1799 | 8 | 6 | 2 | 3.1 | 1.4 | 0.16 | 0.07 |
| Fernando Forestieri | 23 | 1296 | 7 | 6 | 1 | 5.1 | 1.0 | 0.35 | 0.07 |
| Atdhe Nuhiu | 33 | 1530 | 6 | 4 | 2 | 4.7 | 1.5 | 0.28 | 0.09 |
| Dominic Iorfa | 11 | 835 | 4 | 3 | 1 | 1.4 | 0.6 | 0.15 | 0.07 |
| Tom Lees | 42 | 3780 | 4 | 2 | 2 | 2.5 | 2.7 | 0.06 | 0.06 |
| George Boyd | 20 | 1284 | 3 | 1 | 2 | 1.9 | 1.8 | 0.13 | 0.13 |
Overall Performance by Player (P=Playing, NP=Not Playing)
Tom Lees and Michael Hector, on loan from Chelsea, both had great seasons in defence with the Owls c.0.7 goals better per game with the pair in the team. Hector will be popular amongst Championship teams in the summer looking to secure a deal.
| Player | Mins | GD P | GDp90 P | GDp90 NP | Diff | xGD P | xGDp90 P | xGDp90 NP | Diff |
| Team Average | 4140 | -2 | -0.04 | -6.6 | -0.14 | ||||
| Tom Lees | 3780 | 1 | 0.02 | -0.75 | 0.77 | -5.4 | -0.13 | -0.29 | 0.16 |
| Adam Reach | 3764 | 1 | 0.02 | -0.72 | 0.74 | -5.2 | -0.13 | -0.32 | 0.20 |
| Barry Bannan | 3596 | -3 | -0.08 | 0.17 | -0.24 | -7.1 | -0.18 | 0.08 | -0.26 |
| Michael Hector | 3242 | 4 | 0.11 | -0.60 | 0.71 | -2.4 | -0.07 | -0.42 | 0.35 |
| Liam Palmer | 3091 | 2 | 0.06 | -0.34 | 0.40 | -1.2 | -0.03 | -0.47 | 0.43 |
| Joey Pelupessy | 2483 | -7 | -0.25 | 0.27 | -0.53 | -8.1 | -0.30 | 0.08 | -0.38 |
| Steven Fletcher | 2445 | 1 | 0.04 | -0.16 | 0.20 | -1.3 | -0.05 | -0.28 | 0.23 |
| Cameron Dawson | 2340 | -10 | -0.38 | 0.40 | -0.78 | -9.3 | -0.36 | 0.14 | -0.49 |
| Keiren Westwood | 1890 | 8 | 0.38 | -0.40 | 0.78 | 2.7 | 0.13 | -0.37 | 0.50 |
| Morgan Fox | 1881 | -9 | -0.43 | 0.28 | -0.71 | -1.5 | -0.07 | -0.20 | 0.13 |
| Marco Matias | 1799 | -3 | -0.15 | 0.04 | -0.19 | -3.4 | -0.17 | -0.12 | -0.05 |
| Sam Hutchinson | 1770 | 3 | 0.15 | -0.19 | 0.34 | 0.4 | 0.02 | -0.27 | 0.29 |
| Lucas Jov£o | 1606 | -1 | -0.06 | -0.04 | -0.02 | -2.3 | -0.13 | -0.15 | 0.02 |
| Atdhe Nuhiu | 1530 | -3 | -0.18 | 0.03 | -0.21 | -3.3 | -0.19 | -0.11 | -0.08 |
| Jordan Thorniley | 1518 | -3 | -0.18 | 0.03 | -0.21 | -5.0 | -0.30 | -0.05 | -0.24 |
| Fernando Forestieri | 1296 | -1 | -0.07 | -0.03 | -0.04 | -2.2 | -0.15 | -0.14 | -0.01 |
| George Boyd | 1284 | -1 | -0.07 | -0.03 | -0.04 | 0.3 | 0.02 | -0.22 | 0.24 |
| Matt Penney | 1079 | -3 | -0.25 | 0.03 | -0.28 | -4.6 | -0.38 | -0.06 | -0.32 |
Stoke City (Actual 16th, xG 13th)
Performance by Match
Performance by Formation
| Starting Formation | Matches | Pts p90 | xPts p90 |
| 4-5-1 | 1 | 3.0 | 1.0 |
| 4-1-4-1 | 7 | 1.7 | 1.3 |
| 4-4-1-1 | 4 | 1.5 | 0.9 |
| 3-5-2 | 2 | 1.5 | 1.4 |
| 4-3-3 | 17 | 1.3 | 1.5 |
| 4-4-2 (Classic) | 1 | 1.0 | 2.1 |
| 3-5-1-1 | 1 | 1.0 | 1.3 |
| Unknown | 6 | 0.8 | 1.3 |
| 5-3-2 | 2 | 0.5 | 1.5 |
| 4-1-2-1-2 (Diamond Formation) | 4 | 0.3 | 1.2 |
| 4-2-3-1 | 1 | 0.0 | 0.4 |
Performance by Manager
Gary Rowett underperformed pre season expectations but Nathan Jones hasn’t had the expected improvement. Big summer window ahead of next season.
| Managerial Record | Matches | Pts p90 | Rank | xPts p90 | Rank |
| Gary Rowett | 26 | 1.3 | 14th | 1.4 | 14th |
| Nathan Jones | 20 | 1.0 | 21st | 1.2 | 20th |
Attacking Performance by Player
| Player | Apps | Mins | GI | G | A | xG | xA | xGp90 | xAp90 |
| Tom Ince | 38 | 3101 | 13 | 6 | 7 | 8.6 | 4.9 | 0.25 | 0.14 |
| Benik Afobe | 45 | 2823 | 10 | 8 | 2 | 9.4 | 1.4 | 0.30 | 0.05 |
| Joe Allen | 46 | 4132 | 10 | 6 | 4 | 6.2 | 6.0 | 0.13 | 0.13 |
| James McClean | 42 | 2948 | 9 | 3 | 6 | 4.7 | 4.1 | 0.14 | 0.13 |
| Sam Clucas | 26 | 2088 | 7 | 3 | 4 | 2.2 | 2.7 | 0.10 | 0.12 |
| Erik Pieters | 21 | 1847 | 4 | 2 | 2 | 0.4 | 0.7 | 0.02 | 0.03 |
| Saido Berahino | 22 | 1293 | 4 | 3 | 1 | 4.0 | 0.8 | 0.28 | 0.05 |
| Sam Vokes | 12 | 836 | 4 | 3 | 1 | 2.2 | 0.7 | 0.24 | 0.07 |
| Oghenekaro Etebo | 34 | 2609 | 3 | 2 | 1 | 2.2 | 2.4 | 0.08 | 0.08 |
| Ashley Williams | 33 | 2604 | 2 | 1 | 1 | 1.5 | 0.8 | 0.05 | 0.03 |
Overall Performance by Player (P=Playing, NP=Not Playing)
The quick of a small sample show how much better Stoke were in the 8 minutes Joe Allen didn’t play. On a serious note Tom Ince was positive for the Potters in his minutes this season. Nathan Jones will be hopeful he will have another strong season as they look to build on what was ultimately a hugely disappointing season.
| Player | Mins | GD P | GDp90 P | GDp90 NP | Diff | xGD P | xGDp90 P | xGDp90 NP | Diff |
| Team Average | 4140 | -7 | -0.15 | -6.5 | -0.14 | ||||
| Joe Allen | 4132 | -8 | -0.17 | 11.25 | -11.42 | -6.5 | -0.14 | 0.00 | -0.14 |
| Jack Butland | 4050 | -6 | -0.13 | -1.00 | 0.87 | -6.9 | -0.15 | 0.41 | -0.56 |
| Bruno Martins Indi | 3126 | -4 | -0.12 | -0.27 | 0.15 | -2.5 | -0.07 | -0.35 | 0.28 |
| Tom Ince | 3101 | 0 | 0.00 | -0.61 | 0.61 | -0.6 | -0.02 | -0.51 | 0.50 |
| James McClean | 2948 | -9 | -0.27 | 0.15 | -0.43 | -8.4 | -0.26 | 0.14 | -0.40 |
| Ryan Shawcross | 2937 | -5 | -0.15 | -0.15 | 0.00 | -2.1 | -0.06 | -0.33 | 0.26 |
| Benik Afobe | 2823 | -5 | -0.16 | -0.14 | -0.02 | -11.4 | -0.36 | 0.34 | -0.70 |
| Oghenekaro Etebo | 2609 | -10 | -0.34 | 0.18 | -0.52 | -0.8 | -0.03 | -0.34 | 0.31 |
| Ashley Williams | 2604 | -9 | -0.31 | 0.12 | -0.43 | -12.9 | -0.45 | 0.38 | -0.82 |
| Ryan Woods | 2271 | 3 | 0.12 | -0.48 | 0.60 | 0.2 | 0.01 | -0.32 | 0.33 |
| Sam Clucas | 2088 | -4 | -0.17 | -0.13 | -0.04 | -5.7 | -0.25 | -0.03 | -0.21 |
| Thomas Edwards | 1965 | -7 | -0.32 | 0.00 | -0.32 | -7.7 | -0.35 | 0.05 | -0.40 |
| Erik Pieters | 1847 | 0 | 0.00 | -0.27 | 0.27 | -3.8 | -0.18 | -0.11 | -0.08 |
| Rhu-Endly Martina | 1599 | 1 | 0.06 | -0.28 | 0.34 | 0.5 | 0.03 | -0.25 | 0.27 |
| Danny Batth | 1530 | -3 | -0.18 | -0.14 | -0.04 | -3.8 | -0.23 | -0.09 | -0.13 |
| Saido Berahino | 1293 | 0 | 0.00 | -0.22 | 0.22 | -4.0 | -0.28 | -0.08 | -0.20 |
| Sam Vokes | 836 | -4 | -0.43 | -0.08 | -0.35 | -2.0 | -0.21 | -0.12 | -0.09 |
| Bojan Krkic | 736 | 5 | 0.61 | -0.32 | 0.93 | 3.7 | 0.45 | -0.27 | 0.72 |
Swansea City (Actual 10th, xG 8th)
Performance by Match

Performance by Formation
| Starting Formation | Matches | Pts p90 | xPts p90 |
| 3-5-2 | 2 | 2.0 | 1.2 |
| Unknown | 6 | 1.8 | 1.1 |
| 4-2-3-1 | 23 | 1.7 | 1.6 |
| 4-3-3 | 6 | 1.3 | 1.6 |
| 3-4-1-2 | 1 | 1.0 | 1.4 |
| 4-2-2-2 | 1 | 1.0 | 1.0 |
| 4-4-2 (Classic) | 3 | 0.3 | 1.2 |
| 4-1-4-1 | 1 | 0.0 | 2.3 |
| 3-4-3 | 2 | 0.0 | 1.5 |
| 3-4-2-1 | 1 | 0.0 | 0.8 |
Attacking Performance by Player
| Player | Apps | Mins | GI | G | A | xG | xA | xGp90 | xAp90 |
| Oliver McBurnie | 42 | 3414 | 26 | 22 | 4 | 15.7 | 3.8 | 0.41 | 0.10 |
| Bersant Celina | 38 | 2963 | 11 | 5 | 6 | 7.9 | 7.6 | 0.24 | 0.23 |
| Daniel James | 33 | 2507 | 11 | 4 | 7 | 8.3 | 5.1 | 0.30 | 0.18 |
| Wayne Routledge | 24 | 1848 | 8 | 5 | 3 | 3.9 | 6.0 | 0.19 | 0.29 |
| Barrie McKay | 29 | 1397 | 7 | 2 | 5 | 1.1 | 2.9 | 0.07 | 0.19 |
| Connor Roberts | 45 | 3956 | 6 | 5 | 1 | 4.9 | 5.5 | 0.11 | 0.13 |
| Matt Grimes | 45 | 3730 | 5 | 1 | 4 | 3.2 | 5.7 | 0.08 | 0.14 |
| Courtney Baker-Richardson | 15 | 533 | 4 | 3 | 1 | 2.8 | 0.5 | 0.47 | 0.09 |
| Mike van der Hoorn | 46 | 4069 | 4 | 3 | 1 | 4.4 | 2.0 | 0.10 | 0.04 |
| George Byers | 21 | 1647 | 3 | 2 | 1 | 2.1 | 1.2 | 0.11 | 0.07 |
Overall Performance by Player (P=Playing, NP=Not Playing)
Daniel James is the Swans player on everyones lips but the team actually had a better GD without him. Swansea had a Goal Difference per 90 mins (GDp90 P) of -0.11 when he was on the pitch compared to 0.33 without him (GDp90 NP). This is reversed based on xG performance.
| Player | Mins | GD P | GDp90 P | GDp90 NP | Diff | xGD P | xGDp90 P | xGDp90 NP | Diff |
| Team Average | 4140 | 3 | 0.07 | 9.2 | 0.20 | ||||
| Mike van der Hoorn | 4069 | 3 | 0.07 | 0.00 | 0.07 | 9.5 | 0.21 | -0.42 | 0.63 |
| Connor Roberts | 3956 | -1 | -0.02 | 1.96 | -1.98 | 6.5 | 0.15 | 1.32 | -1.17 |
| Matt Grimes | 3730 | 4 | 0.10 | -0.22 | 0.32 | 12.9 | 0.31 | -0.80 | 1.11 |
| Oliver McBurnie | 3414 | 5 | 0.13 | -0.25 | 0.38 | 6.8 | 0.18 | 0.30 | -0.12 |
| Bersant Celina | 2963 | 1 | 0.03 | 0.15 | -0.12 | 5.2 | 0.16 | 0.31 | -0.15 |
| Kyle Naughton | 2757 | 6 | 0.20 | -0.20 | 0.39 | 13.4 | 0.44 | -0.28 | 0.71 |
| Daniel James | 2507 | -3 | -0.11 | 0.33 | -0.44 | 11.2 | 0.40 | -0.11 | 0.51 |
| Erwin Mulder | 2227 | 1 | 0.04 | 0.09 | -0.05 | -3.3 | -0.13 | 0.59 | -0.72 |
| Cameron Carter-Vickers | 2203 | -5 | -0.20 | 0.37 | -0.58 | 8.5 | 0.35 | 0.03 | 0.32 |
| Joe Rodon | 2052 | 2 | 0.09 | 0.04 | 0.04 | -1.7 | -0.08 | 0.47 | -0.55 |
| Kristoffer Nordfeldt | 1913 | 2 | 0.09 | 0.04 | 0.05 | 12.5 | 0.59 | -0.13 | 0.72 |
| Jay Fulton | 1910 | -1 | -0.05 | 0.16 | -0.21 | -1.2 | -0.06 | 0.42 | -0.48 |
| Wayne Routledge | 1848 | 8 | 0.39 | -0.20 | 0.59 | 7.9 | 0.38 | 0.05 | 0.33 |
| George Byers | 1647 | -1 | -0.05 | 0.14 | -0.20 | 9.1 | 0.50 | 0.00 | 0.49 |
| Barrie McKay | 1397 | 2 | 0.13 | 0.03 | 0.10 | -2.6 | -0.17 | 0.39 | -0.56 |
| Nathan Dyer | 1360 | 4 | 0.26 | -0.03 | 0.30 | 8.7 | 0.57 | 0.02 | 0.56 |
| Leroy Fer | 1351 | 8 | 0.53 | -0.16 | 0.69 | -0.4 | -0.02 | 0.31 | -0.33 |
| Martin Olsson | 1105 | -4 | -0.33 | 0.21 | -0.53 | -1.1 | -0.09 | 0.31 | -0.40 |
West Bromwich Albion (Actual 4th, xG 4th)
Performance by Match
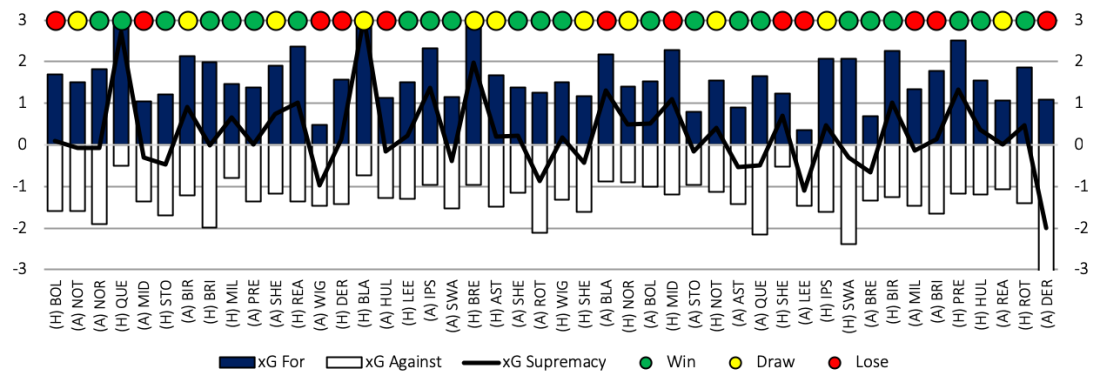
Performance by Formation
| Starting Formation | Matches | Pts p90 | xPts p90 |
| 4-2-2-2 | 1 | 3.0 | 1.4 |
| 3-5-2 | 3 | 3.0 | 1.8 |
| 4-4-2 (Classic) | 2 | 2.0 | 1.9 |
| 4-3-3 | 21 | 1.8 | 1.4 |
| Unknown | 6 | 1.7 | 1.4 |
| 3-4-1-2 | 10 | 1.5 | 1.6 |
| 3-4-3 | 2 | 0.5 | 1.0 |
| 4-4-1-1 | 1 | 0.0 | 2.1 |
Performance by Manager
Darren Moore was unlucky to lose his job with just 10 games to go having essentially secured a playoff spot. West Bromwich Albion have picked up more points under James Shan but xG performance indicate that is fortunate.
| Managerial Record | Matches | Pts p90 | Rank | xPts p90 | Rank |
| Darren Moore | 36 | 1.7 | 5th | 1.5 | 4th |
| James Shan | 10 | 1.9 | 3rd | 1.4 | 10th |
Attacking Performance by Player
| Player | Apps | Mins | GI | G | A | xG | xA | xGp90 | xAp90 |
| Jay Rodriguez | 45 | 3979 | 28 | 22 | 6 | 19.8 | 4.6 | 0.45 | 0.10 |
| Dwight Gayle | 39 | 2846 | 25 | 23 | 2 | 14.7 | 2.4 | 0.46 | 0.08 |
| Harvey Barnes | 26 | 2225 | 15 | 9 | 6 | 7.3 | 4.4 | 0.30 | 0.18 |
| Matt Phillips | 30 | 2092 | 12 | 5 | 7 | 2.8 | 7.6 | 0.12 | 0.33 |
| Chris Brunt | 31 | 2004 | 8 | 2 | 6 | 2.0 | 7.1 | 0.09 | 0.32 |
| Kieran Gibbs | 36 | 3037 | 8 | 4 | 4 | 1.6 | 3.7 | 0.05 | 0.11 |
| Hal Robson-Kanu | 34 | 1485 | 5 | 4 | 1 | 5.5 | 2.5 | 0.33 | 0.15 |
| Stefan Johansen | 12 | 883 | 5 | 2 | 3 | 0.7 | 2.3 | 0.08 | 0.24 |
| Craig Dawson | 41 | 3550 | 4 | 2 | 2 | 4.3 | 2.6 | 0.11 | 0.07 |
| Jake Livermore | 39 | 3182 | 4 | 2 | 2 | 1.7 | 1.9 | 0.05 | 0.05 |
Overall Performance by Player (P=Playing, NP=Not Playing)
The toughest one to draw conclusions from. The players at the top of the list with the most minutes played haven’t had a poisitve impact based on both actuals and xG performance. Looking further down the list Harvey Barnes (now back at Leicester City) and Matt Phillips are the first ones who fall into this category.
| Player | Mins | GD P | GDp90 P | GDp90 NP | Diff | xGD P | xGDp90 P | xGDp90 NP | Diff |
| Team Average | 4140 | 25 | 0.54 | 12.7 | 0.28 | ||||
| Sam Johnstone | 4140 | 25 | 0.54 | 12.7 | 0.28 | ||||
| Jay Rodriguez | 3979 | 22 | 0.50 | 1.68 | -1.18 | 10.5 | 0.24 | 1.18 | -0.94 |
| Craig Dawson | 3550 | 21 | 0.53 | 0.61 | -0.08 | 10.6 | 0.27 | 0.31 | -0.05 |
| Ahmed Hegazy | 3284 | 29 | 0.79 | -0.42 | 1.22 | 5.8 | 0.16 | 0.72 | -0.56 |
| Jake Livermore | 3182 | 24 | 0.68 | 0.09 | 0.58 | 9.1 | 0.26 | 0.34 | -0.08 |
| Kieran Gibbs | 3037 | 30 | 0.89 | -0.41 | 1.30 | 9.0 | 0.27 | 0.29 | -0.03 |
| Dwight Gayle | 2846 | 20 | 0.63 | 0.35 | 0.28 | 5.6 | 0.18 | 0.49 | -0.31 |
| Harvey Barnes | 2225 | 21 | 0.85 | 0.19 | 0.66 | 8.2 | 0.33 | 0.21 | 0.12 |
| Kyle Bartley | 2187 | 12 | 0.49 | 0.60 | -0.11 | 6.9 | 0.29 | 0.26 | 0.02 |
| Matt Phillips | 2092 | 17 | 0.73 | 0.35 | 0.38 | 11.3 | 0.49 | 0.06 | 0.43 |
| Tosin Adarabioyo | 2029 | 6 | 0.27 | 0.81 | -0.54 | 8.4 | 0.37 | 0.18 | 0.19 |
| Chris Brunt | 2004 | 15 | 0.67 | 0.42 | 0.25 | 7.4 | 0.33 | 0.22 | 0.11 |
| Mason Holgate | 1659 | 3 | 0.16 | 0.80 | -0.64 | 0.7 | 0.04 | 0.43 | -0.40 |
| Hal Robson-Kanu | 1485 | 9 | 0.55 | 0.54 | 0.00 | 13.2 | 0.80 | -0.02 | 0.82 |
| Gareth Barry | 1388 | 17 | 1.10 | 0.26 | 0.84 | 8.7 | 0.56 | 0.13 | 0.43 |
| Rekeem Harper | 1131 | 0 | 0.00 | 0.75 | -0.75 | -1.4 | -0.11 | 0.42 | -0.53 |
| James Morrison | 963 | 0 | 0.00 | 0.71 | -0.71 | 5.1 | 0.47 | 0.21 | 0.26 |
| Conor Townsend | 957 | 1 | 0.09 | 0.68 | -0.58 | 4.9 | 0.46 | 0.22 | 0.25 |
Wigan Athletic (Actual 18th, xG 14th)
Performance by Match
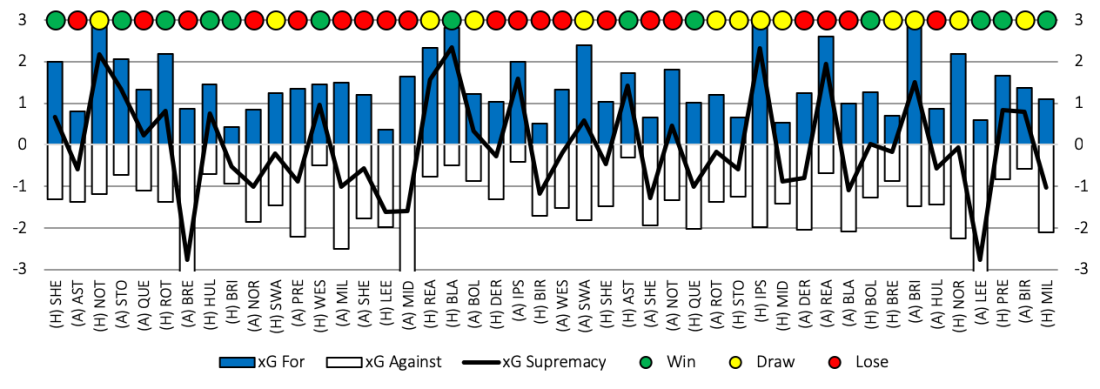
Performance by Formation
| Starting Formation | Matches | Pts p90 | xPts p90 |
| Unknown | 6 | 1.7 | 1.8 |
| 4-2-3-1 | 13 | 1.6 | 1.1 |
| 3-5-2 | 1 | 1.0 | 0.8 |
| 3-4-2-1 | 1 | 1.0 | 2.3 |
| 5-4-1 | 1 | 1.0 | 1.9 |
| 4-4-1-1 | 20 | 0.9 | 1.4 |
| 4-1-4-1 | 3 | 0.3 | 1.2 |
| 3-4-3 | 1 | 0.0 | 1.0 |
Attacking Performance by Player
| Player | Apps | Mins | GI | G | A | xG | xA | xGp90 | xAp90 |
| Nick Powell | 32 | 1996 | 14 | 8 | 6 | 8.5 | 3.3 | 0.38 | 0.15 |
| Joe Garner | 30 | 1507 | 9 | 8 | 1 | 7.1 | 1.0 | 0.42 | 0.06 |
| Michael Jacobs | 22 | 1689 | 8 | 4 | 4 | 3.5 | 2.6 | 0.19 | 0.14 |
| Josh Windass | 38 | 2675 | 7 | 5 | 2 | 7.1 | 4.1 | 0.24 | 0.14 |
| Gavin Massey | 19 | 1170 | 6 | 5 | 1 | 1.6 | 2.4 | 0.13 | 0.18 |
| Lee Evans | 34 | 2828 | 6 | 1 | 5 | 2.6 | 4.9 | 0.08 | 0.16 |
| Reece James | 45 | 3972 | 6 | 3 | 3 | 3.4 | 9.7 | 0.08 | 0.22 |
| Leon Clarke | 15 | 838 | 5 | 3 | 2 | 4.6 | 0.6 | 0.49 | 0.06 |
| William Grigg | 17 | 895 | 5 | 4 | 1 | 5.1 | 0.9 | 0.52 | 0.09 |
| Nathan Byrne | 30 | 2349 | 4 | 1 | 3 | 1.4 | 1.7 | 0.05 | 0.06 |
Overall Performance by Player (P=Playing, NP=Not Playing)
Reece James tops the list for minutes played and tops the list for greatest performance impact for the Latics. Wigan had a Goal Difference per 90 mins (GDp90 P) of -0.25 when he was on the pitch compared to -1.07 without him (GDp90 NP). He’s another Chelsea loanee who’s had a great Championship season and another who might benefit from the transfer ban.
| Player | Mins | GD P | GDp90 P | GDp90 NP | Diff | xGD P | xGDp90 P | xGDp90 NP | Diff |
| Team Average | 4140 | -13 | -0.28 | -0.5 | -0.01 | ||||
| Reece James | 3972 | -11 | -0.25 | -1.07 | 0.82 | 0.0 | 0.00 | -0.25 | 0.25 |
| Sam Morsy | 3598 | -13 | -0.33 | 0.00 | -0.33 | 2.7 | 0.07 | -0.52 | 0.59 |
| Cedric Kipre | 3342 | -9 | -0.24 | -0.45 | 0.21 | -3.8 | -0.10 | 0.37 | -0.47 |
| Cheyenne Dunkley | 3312 | -9 | -0.24 | -0.43 | 0.19 | -2.7 | -0.07 | 0.24 | -0.31 |
| Christian Walton | 3060 | -9 | -0.26 | -0.33 | 0.07 | -1.6 | -0.05 | 0.10 | -0.14 |
| Lee Evans | 2828 | -4 | -0.13 | -0.62 | 0.49 | -0.5 | -0.02 | 0.00 | -0.02 |
| Josh Windass | 2675 | -18 | -0.61 | 0.31 | -0.91 | -4.0 | -0.14 | 0.22 | -0.35 |
| Nathan Byrne | 2349 | -6 | -0.23 | -0.35 | 0.12 | -0.8 | -0.03 | 0.02 | -0.05 |
| Antonee Robinson | 2340 | -5 | -0.19 | -0.40 | 0.21 | -4.3 | -0.17 | 0.19 | -0.36 |
| Kal Naismith | 2077 | -9 | -0.39 | -0.17 | -0.22 | -2.8 | -0.12 | 0.10 | -0.22 |
| Nick Powell | 1996 | 1 | 0.05 | -0.59 | 0.63 | 3.2 | 0.15 | -0.16 | 0.30 |
| Michael Jacobs | 1689 | 1 | 0.05 | -0.51 | 0.57 | 3.3 | 0.18 | -0.14 | 0.32 |
| Joe Garner | 1507 | -5 | -0.30 | -0.27 | -0.03 | 0.4 | 0.02 | -0.03 | 0.05 |
| Dan Burn | 1215 | -13 | -0.96 | 0.00 | -0.96 | 0.0 | 0.00 | -0.01 | 0.01 |
| Gavin Massey | 1170 | 5 | 0.38 | -0.55 | 0.93 | 2.4 | 0.19 | -0.09 | 0.28 |
| Jamie Jones | 1080 | -4 | -0.33 | -0.26 | -0.07 | 1.2 | 0.10 | -0.05 | 0.14 |
| Darron Gibson | 1054 | -9 | -0.77 | -0.12 | -0.65 | -2.9 | -0.25 | 0.07 | -0.32 |
| Gary Roberts | 898 | -7 | -0.70 | -0.17 | -0.53 | 4.4 | 0.44 | -0.14 | 0.58 |
