Here’s my review of the season utilising everybody’s favourite football analytical metric – Expected Goals (or xG).
NOTE: For those not familiar with xG this is a metric to monitor the quality of goalscoring chances. A value between 0 and 1 is assigned based on the probability the chance will result in a goal. A 1 in 20 long range shot with have a probability of 5% (an xG of 0.05) whereas a penalty has a 3 in 4 expectancy and therefore an xG of 0.75.
League Table
Lincoln City ran out relatively comfortable league winners securing the trophy by the end of April but were rated as the 5th best team by my xG model. The honour of the best rated team goes to Bury who finished runners up on goal difference ahead of MK Dons (6th on xG ranking).
Mansfield Town (xG ranked 2nd) can be considered unlucky not to achieve automatic promotion and now have another season in the fourth tier after failing in the playoffs. The playoff final will be contested between 6th place finishers Tranmere Rovers (xG ranked 10th) and 7th place finishers Newport County (xG ranked 7th).
At the other end of the table both Notts County (xG ranked 19th) and Yeovil Town (xG ranked 18th) were unfortunate to fall through the EFL trap door. Grimsby Town and Macclesfield Town were ranked as the worst two teams in the league.
One team to highlight are Northampton Town. My xG model ranks them as a team of automatic promotion quality and so they should be massively disappointed with a bottom half finish. If they can get results that match their expected xG performance they should have a strong season ahead of them.
| Team | GF | GA | GD | Pts | xGF | xGA | xGD | xPts | Rank | |
| 1 | Lincoln City | 73 | 43 | 30 | 85 | 58 | 45 | 13 | 70.2 | 5 |
| 2 | Bury | 83 | 56 | 27 | 79 | 72 | 49 | 23 | 74.5 | 1 |
| 3 | MK Dons | 71 | 49 | 22 | 79 | 69 | 56 | 13 | 70.1 | 6 |
| 4 | Mansfield Town | 69 | 41 | 28 | 76 | 62 | 45 | 17 | 71.4 | 2 |
| 5 | Forest Green Rovers | 68 | 47 | 21 | 74 | 52 | 52 | 0 | 62.6 | 14 |
| 6 | Tranmere Rovers | 63 | 50 | 13 | 73 | 56 | 53 | 3 | 64.6 | 10 |
| 7 | Newport County | 59 | 59 | 0 | 71 | 59 | 51 | 8 | 67.3 | 7 |
| 8 | Colchester United | 65 | 53 | 12 | 70 | 58 | 45 | 13 | 70.5 | 4 |
| 9 | Exeter City | 60 | 49 | 11 | 70 | 62 | 54 | 8 | 66.1 | 9 |
| 10 | Stevenage | 59 | 55 | 4 | 70 | 47 | 58 | -11 | 56.3 | 20 |
| 11 | Carlisle United | 67 | 62 | 5 | 68 | 55 | 56 | -2 | 63.3 | 12 |
| 12 | Crewe Alexandra | 60 | 59 | 1 | 65 | 55 | 55 | -1 | 62.8 | 13 |
| 13 | Swindon Town | 59 | 56 | 3 | 64 | 57 | 51 | 6 | 66.7 | 8 |
| 14 | Oldham Athletic | 67 | 60 | 7 | 62 | 50 | 57 | -7 | 59.1 | 16 |
| 15 | Northampton Town | 64 | 63 | 1 | 61 | 70 | 57 | 12 | 70.9 | 3 |
| 16 | Cheltenham Town | 57 | 68 | -11 | 57 | 50 | 61 | -12 | 56.2 | 21 |
| 17 | Grimsby Town | 45 | 57 | -12 | 56 | 45 | 67 | -22 | 51.1 | 24 |
| 18 | Morecambe | 54 | 70 | -16 | 54 | 46 | 61 | -15 | 54.2 | 22 |
| 19 | Crawley Town | 51 | 68 | -17 | 53 | 49 | 56 | -7 | 58.6 | 17 |
| 20 | Port Vale | 39 | 55 | -16 | 49 | 53 | 53 | 1 | 63.7 | 11 |
| 21 | Cambridge United | 40 | 66 | -26 | 47 | 51 | 55 | -4 | 60.9 | 15 |
| 22 | Macclesfield Town | 48 | 74 | -26 | 44 | 48 | 65 | -17 | 52.6 | 23 |
| 23 | Notts County | 48 | 84 | -36 | 41 | 47 | 58 | -11 | 56.7 | 19 |
| 24 | Yeovil Town | 41 | 66 | -25 | 40 | 48 | 55 | -7 | 57.7 | 18 |
The remainder of the article is a club-by-club review focusing on five areas:
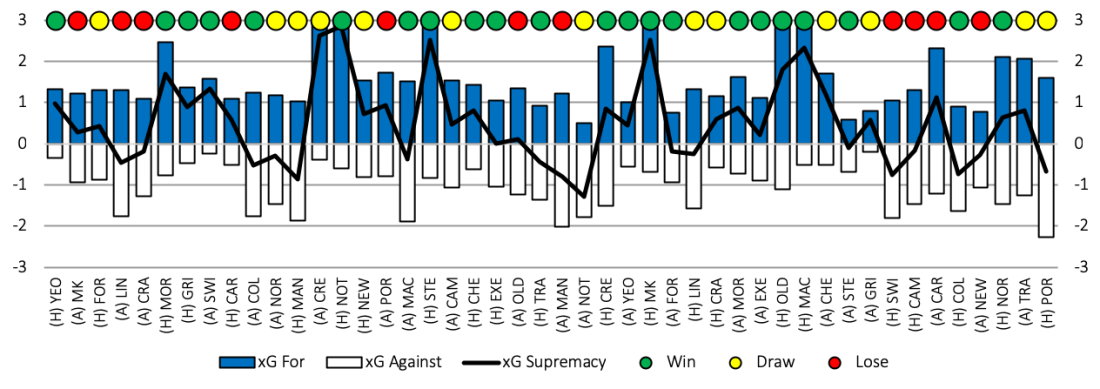
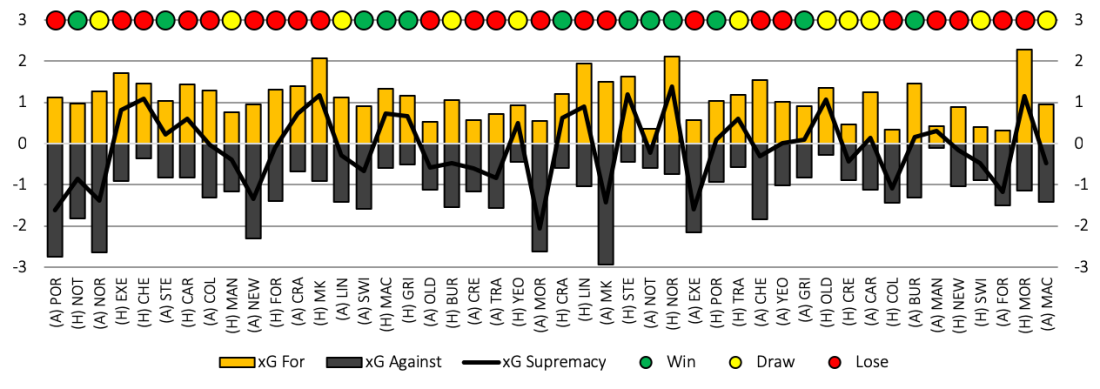
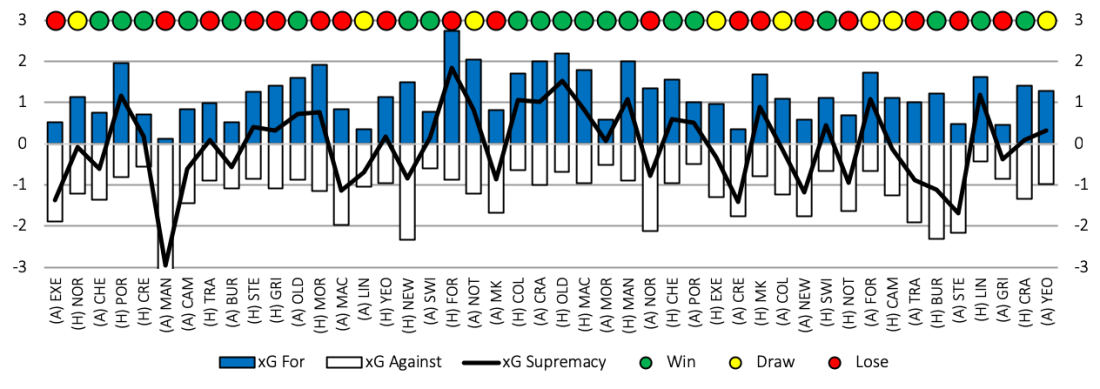
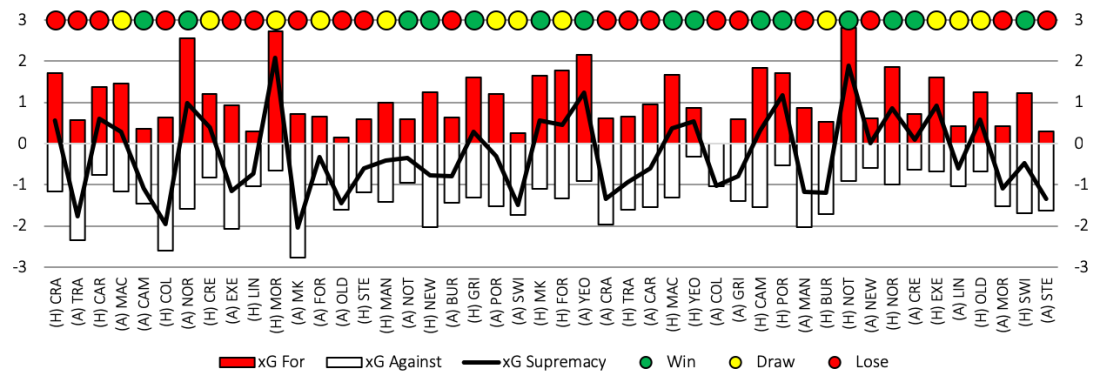
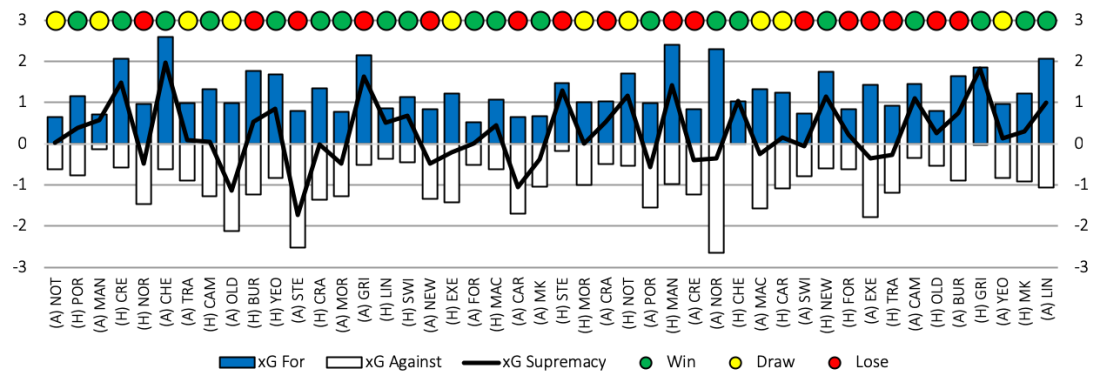
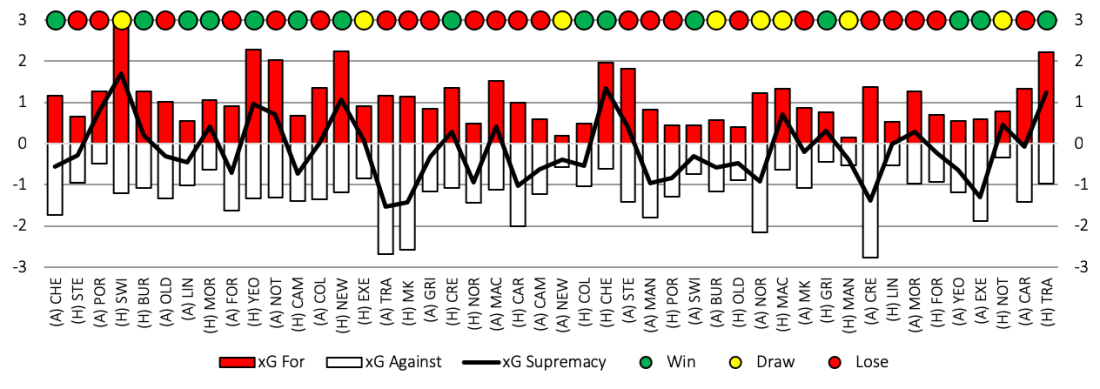
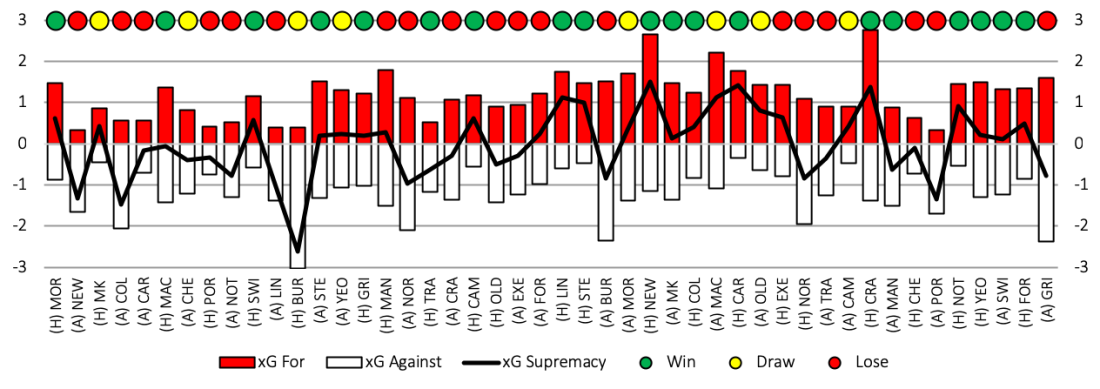
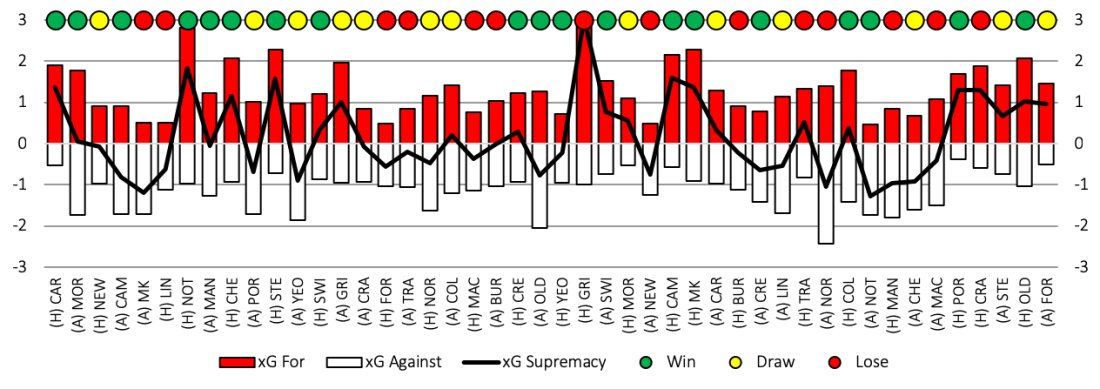
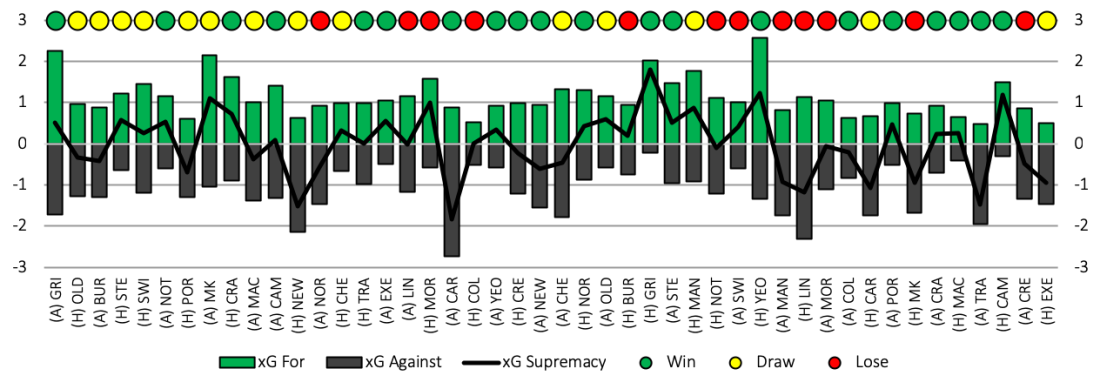
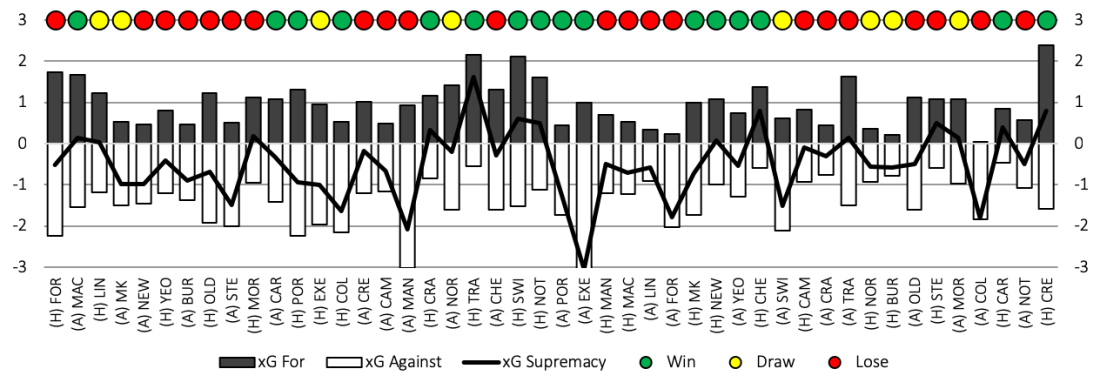
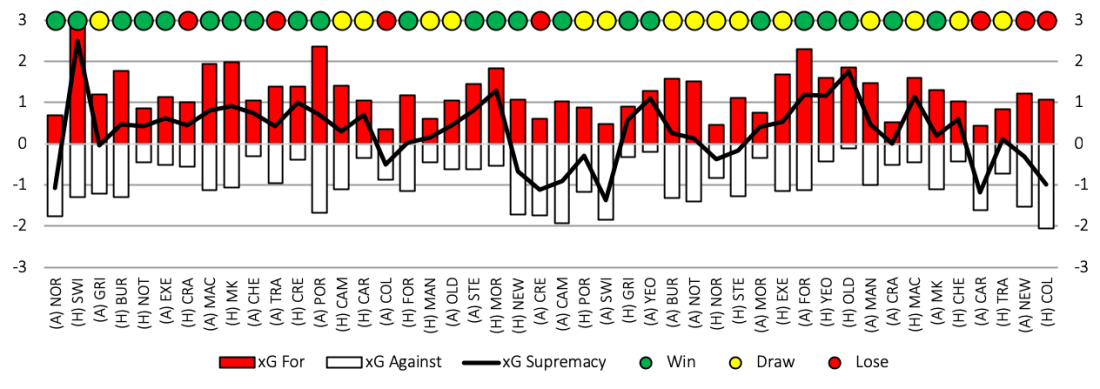
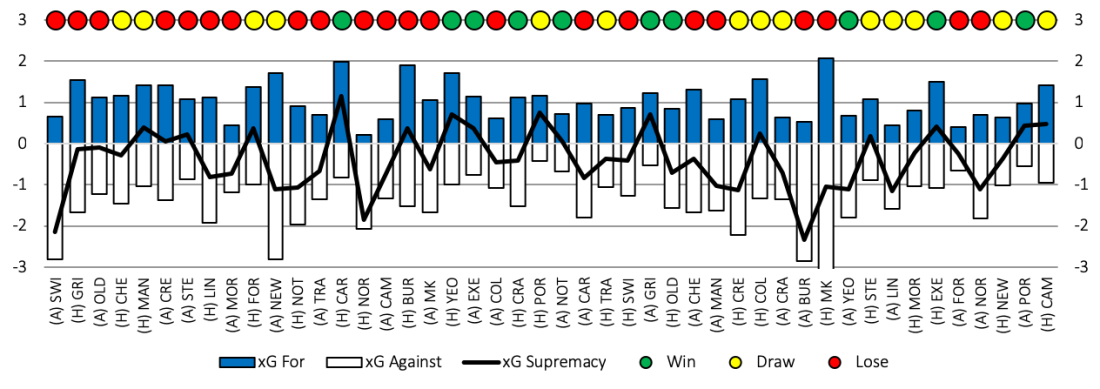
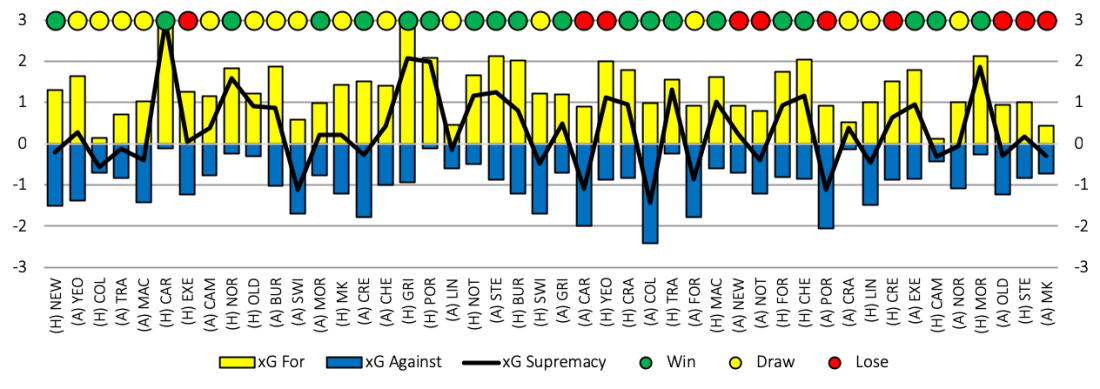
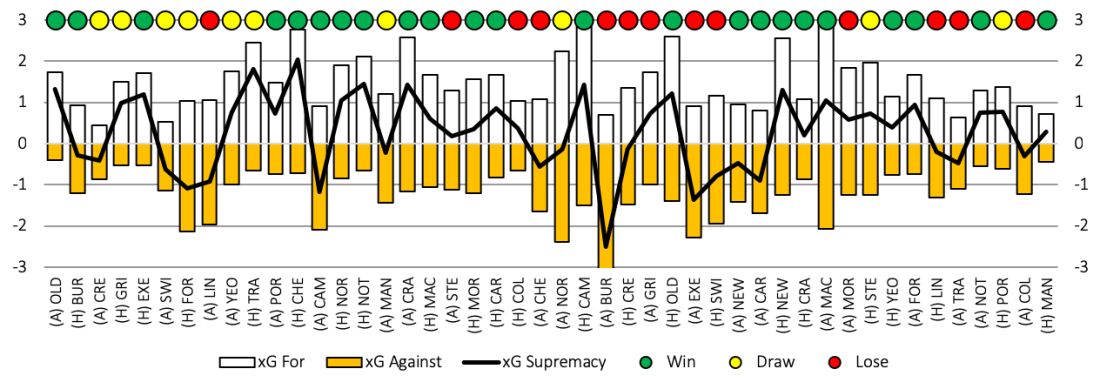
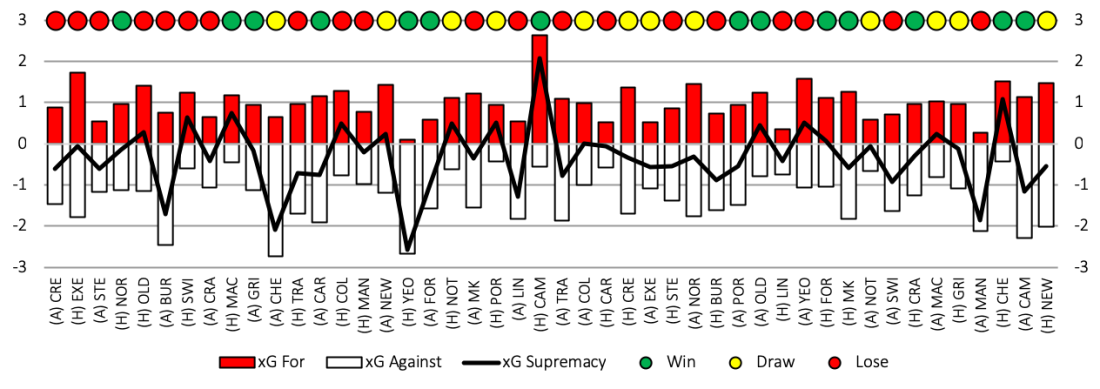
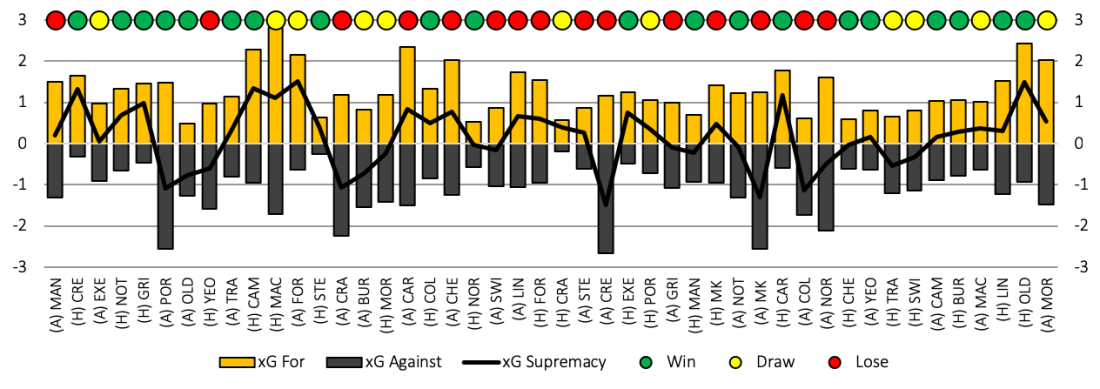
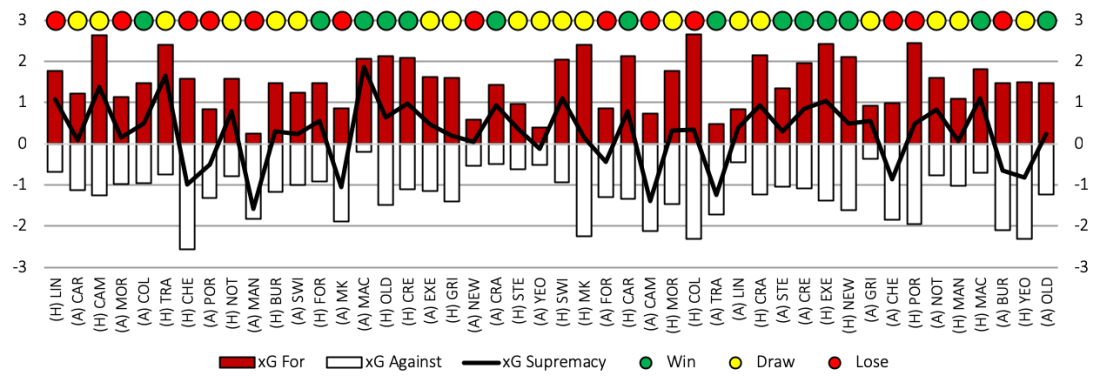
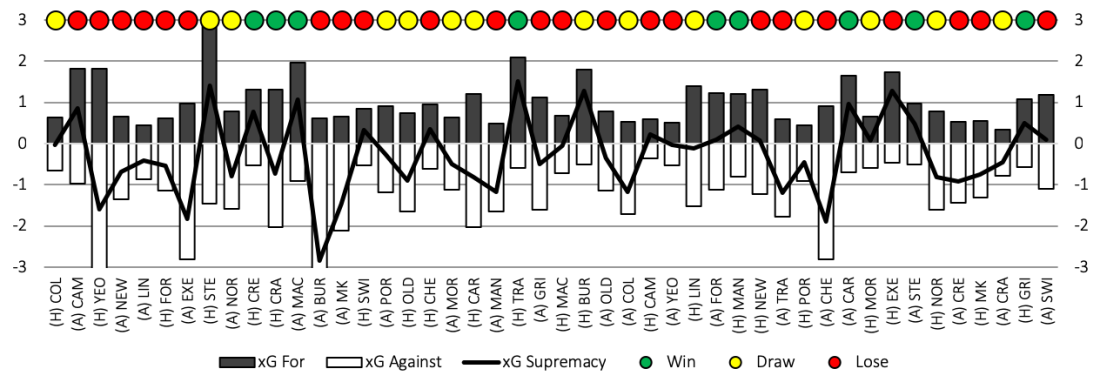
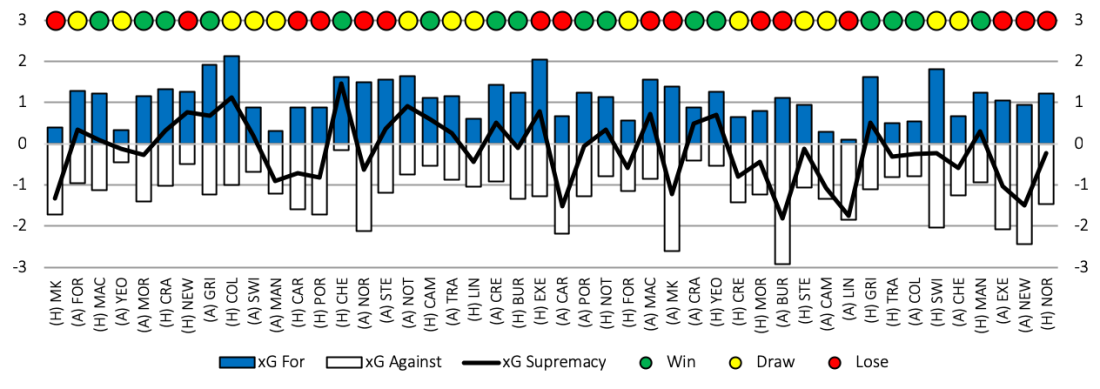
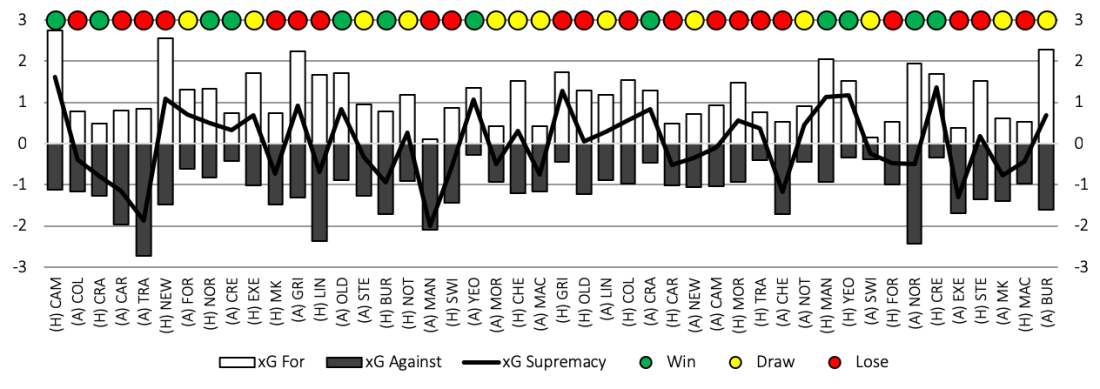
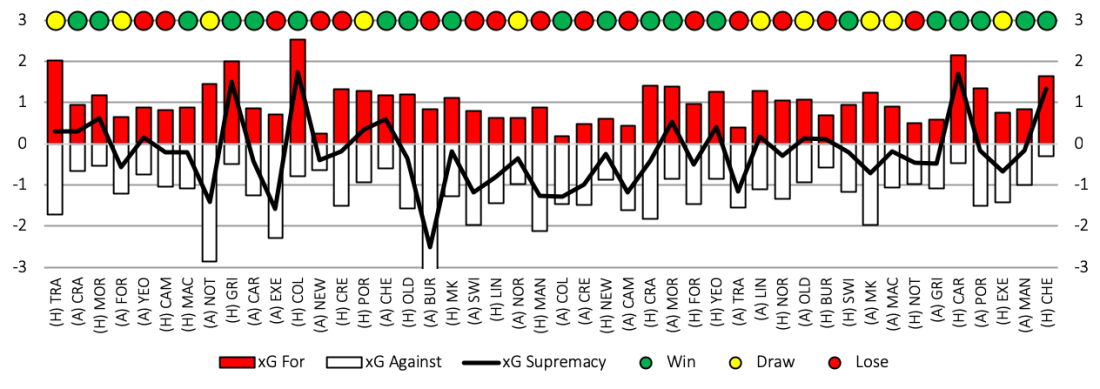
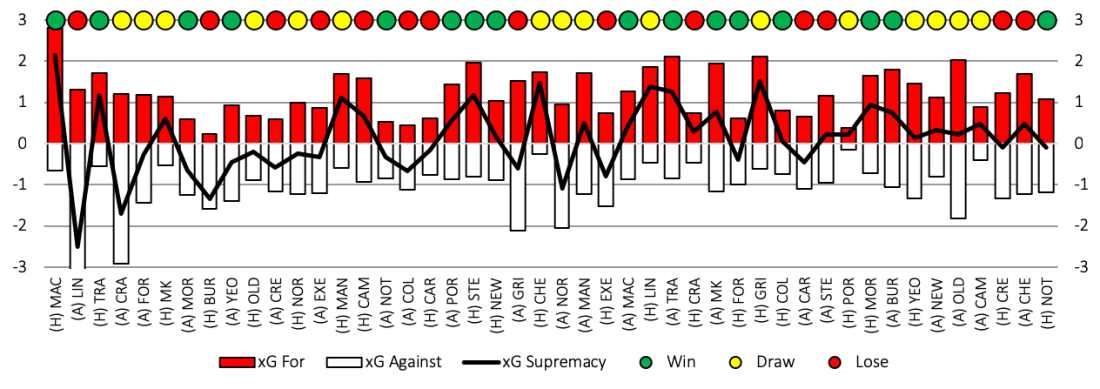
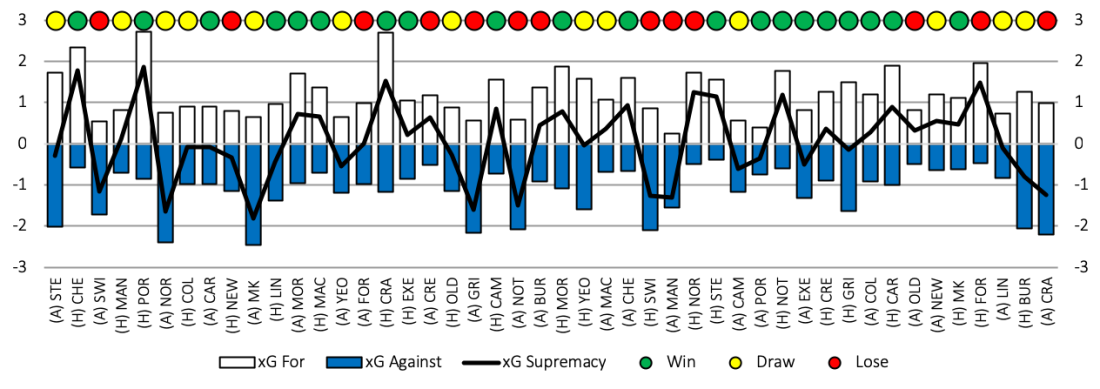
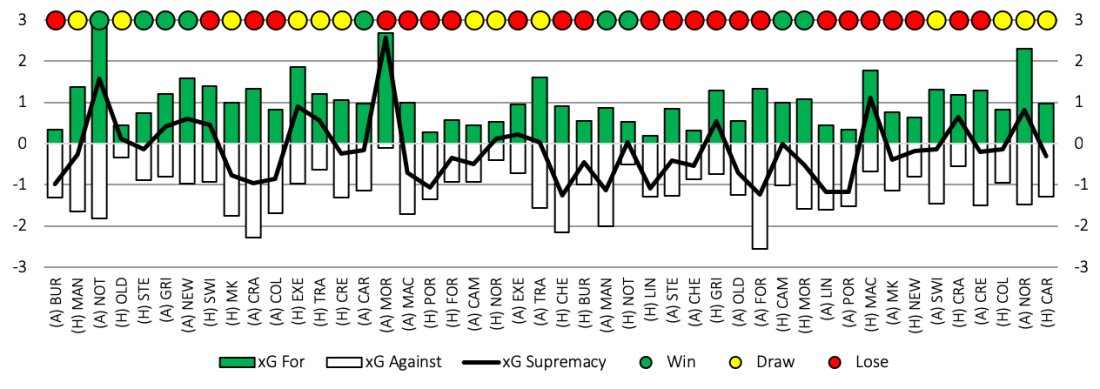
- Performance by Match – A graphical representation of the xG created and conceded by match day. Useful to highlight sections of the season the team performed particularly well/poor. The colour coding at the top indicating the actual match result.
- Performance by Formation – A table to show actual and expected points based on the starting formation used. Useful context to see teams which have a distinct set up and which teams tinkered regularly during the season.
- Performance by Manager – A table to show actual and expected points by manager for those teams who made a change during the season.
- Attacking Performance by Player – A table to show actual and expected goal involvement by player.
- Overall Performance by Player – A new concept to me which attempts to demonstrate the influence a player has to the team by assessing the actual and expected performance when the player featured and when the player was absent.
Bury (Actual 2nd, xG 1st)
Performance by Match
Performance by Formation
| Starting Formation | Matches | Pts p90 | xPts p90 |
| 3-4-1-2 | 9 | 1.9 | 1.6 |
| 3-5-2 | 33 | 1.8 | 1.6 |
| 5-3-2 | 3 | 1.0 | 1.8 |
| 4-4-2 (Classic) | 1 | 0.0 | 1.4 |
Attacking Performance by Player
| Player | Apps | Mins | GI | G | A | xG | xGp90 |
| Nicky Maynard | 37 | 2952 | 26 | 21 | 5 | 17.1 | 0.52 |
| Jay O Shea | 44 | 3704 | 20 | 15 | 5 | 10.9 | 0.27 |
| Danny Mayor | 39 | 3380 | 17 | 8 | 9 | 5.9 | 0.16 |
| Nicholas Adams | 46 | 3822 | 17 | 2 | 15 | 3.8 | 0.09 |
| Dominic Telford | 37 | 1637 | 9 | 6 | 3 | 6.4 | 0.35 |
| Byron Moore | 36 | 2035 | 8 | 5 | 3 | 3.2 | 0.14 |
| Callum McFadzean | 40 | 3239 | 7 | 0 | 7 | 1.1 | 0.03 |
| Will Aimson | 37 | 3160 | 6 | 4 | 2 | 2.1 | 0.06 |
| Caolan Lavery | 23 | 903 | 5 | 5 | 3.5 | 0.35 | |
| Chris Dagnall | 16 | 900 | 4 | 3 | 1 | 2.9 | 0.29 |
Overall Performance by Player (P=Playing, NP=Not Playing)
| Player | Mins | GD P | GDp90 P | GDp90 NP | Diff | xGD P | xGDp90 P | xGDp90 NP | Diff |
| Team Average | 4140 | 27 | 0.59 | 22.7 | 0.49 | ||||
| Joe Murphy | 4140 | 27 | 0.59 | 22.7 | 0.49 | ||||
| Adam Thompson | 3954 | 28 | 0.64 | -0.48 | 1.12 | 24.1 | 0.55 | -0.67 | 1.22 |
| Nicholas Adams | 3822 | 28 | 0.66 | -0.28 | 0.94 | 23.3 | 0.55 | -0.17 | 0.72 |
| Jay O Shea | 3704 | 23 | 0.56 | 0.83 | -0.27 | 17.5 | 0.43 | 1.08 | -0.66 |
| Danny Mayor | 3380 | 30 | 0.80 | -0.36 | 1.15 | 23.9 | 0.64 | -0.14 | 0.78 |
| Callum McFadzean | 3239 | 24 | 0.67 | 0.30 | 0.37 | 20.6 | 0.57 | 0.22 | 0.35 |
| Will Aimson | 3160 | 28 | 0.80 | -0.09 | 0.89 | 19.1 | 0.54 | 0.34 | 0.20 |
| Chris Stokes | 3048 | 14 | 0.41 | 1.07 | -0.66 | 12.6 | 0.37 | 0.84 | -0.46 |
| Nicky Maynard | 2952 | 19 | 0.58 | 0.61 | -0.03 | 16.2 | 0.49 | 0.50 | 0.00 |
| Neil Danns | 2365 | 5 | 0.19 | 1.12 | -0.93 | 9.1 | 0.35 | 0.69 | -0.35 |
| Byron Moore | 2035 | 23 | 1.02 | 0.17 | 0.85 | 11.9 | 0.53 | 0.46 | 0.06 |
| Eoghan O Connell | 1712 | 7 | 0.37 | 0.74 | -0.37 | 6.6 | 0.35 | 0.60 | -0.25 |
| Dominic Telford | 1637 | 10 | 0.55 | 0.61 | -0.06 | 8.1 | 0.45 | 0.53 | -0.08 |
| Jordan Rossiter | 1384 | 4 | 0.26 | 0.75 | -0.49 | 7.8 | 0.51 | 0.49 | 0.02 |
| Scott Wharton | 1169 | 2 | 0.15 | 0.76 | -0.60 | 5.8 | 0.44 | 0.51 | -0.07 |
| Caolan Lavery | 903 | 8 | 0.80 | 0.53 | 0.27 | 5.1 | 0.50 | 0.49 | 0.01 |
| Chris Dagnall | 900 | 8 | 0.80 | 0.53 | 0.27 | 6.6 | 0.66 | 0.45 | 0.21 |
| Callum Styles | 860 | 10 | 1.05 | 0.47 | 0.58 | 5.5 | 0.57 | 0.47 | 0.10 |
Cambridge United (Actual 21st, xG 15th)
Performance by Match
Performance by Formation
| Starting Formation | Matches | Pts p90 | xPts p90 |
| 4-3-3 | 5 | 1.4 | 1.2 |
| 4-4-2 (Classic) | 10 | 1.2 | 1.2 |
| 4-1-2-1-2 (Diamond Formation) | 15 | 1.1 | 1.4 |
| 4-2-3-1 | 9 | 1.1 | 1.6 |
| 4-2-2-2 | 1 | 1.0 | 2.1 |
| 5-4-1 | 1 | 0.0 | 0.7 |
| 4-4-1-1 | 5 | 0.0 | 0.8 |
Performance by Manager
| Managerial Record | Matches | Pts p90 | Rank | xPts p90 | Rank |
| Joe Dunne | 20 | 1.0 | 22nd | 1.3 | 15th |
| Mark Bonner | 2 | 0.5 | 1.3 | ||
| Colin Calderwood | 24 | 1.1 | 20th | 1.3 | 15th |
Attacking Performance by Player
| Player | Apps | Mins | GI | G | A | xG | xGp90 |
| Jeavani Brown | 43 | 3519 | 16 | 7 | 9 | 7.2 | 0.18 |
| George Maris | 39 | 3315 | 10 | 5 | 5 | 7.3 | 0.20 |
| David Amoo | 43 | 2419 | 8 | 5 | 3 | 3.3 | 0.12 |
| Jabo Ibehre | 35 | 2654 | 7 | 4 | 3 | 6.8 | 0.23 |
| Paul Lewis | 22 | 1169 | 4 | 4 | 3.3 | 0.25 | |
| Adebayo Azeez | 26 | 1170 | 3 | 2 | 1 | 4.2 | 0.32 |
| George Taft | 36 | 3104 | 3 | 2 | 1 | 1.4 | 0.04 |
| Reggie Lambe | 32 | 2304 | 3 | 3 | 2.8 | 0.11 | |
| Rushian Hepburn-Murphy | 16 | 851 | 3 | 2 | 1 | 2.4 | 0.25 |
| Brad Halliday | 38 | 3288 | 2 | 0 | 2 | 0.8 | 0.02 |
Overall Performance by Player (P=Playing, NP=Not Playing)
| Player | Mins | GD P | GDp90 P | GDp90 NP | Diff | xGD P | xGDp90 P | xGDp90 NP | Diff |
| Team Average | 4140 | -26 | -0.57 | -4.3 | -0.09 | ||||
| Gary Deegan | 3614 | -18 | -0.45 | -1.37 | 0.92 | -0.8 | -0.02 | -0.60 | 0.58 |
| Jeavani Brown | 3519 | -14 | -0.36 | -1.74 | 1.38 | 2.9 | 0.07 | -1.04 | 1.11 |
| Greg Taylor | 3506 | -23 | -0.59 | -0.43 | -0.16 | -6.0 | -0.15 | 0.24 | -0.39 |
| George Maris | 3315 | -21 | -0.57 | -0.55 | -0.02 | -4.4 | -0.12 | 0.01 | -0.13 |
| Brad Halliday | 3288 | -17 | -0.47 | -0.95 | 0.49 | 0.2 | 0.00 | -0.47 | 0.48 |
| George Taft | 3104 | -13 | -0.38 | -1.13 | 0.75 | -1.7 | -0.05 | -0.22 | 0.17 |
| Jake Carroll | 2748 | -21 | -0.69 | -0.32 | -0.36 | -8.0 | -0.26 | 0.24 | -0.50 |
| Jabo Ibehre | 2654 | -12 | -0.41 | -0.85 | 0.44 | 0.5 | 0.02 | -0.29 | 0.31 |
| David Amoo | 2419 | -8 | -0.30 | -0.94 | 0.64 | 2.2 | 0.08 | -0.34 | 0.42 |
| Reggie Lambe | 2304 | -14 | -0.55 | -0.59 | 0.04 | -1.4 | -0.06 | -0.14 | 0.09 |
| David Forde | 2250 | -21 | -0.84 | -0.24 | -0.60 | -2.2 | -0.09 | -0.10 | 0.01 |
| Dimitar Mitov | 1890 | -5 | -0.24 | -0.84 | 0.60 | -2.1 | -0.10 | -0.09 | -0.01 |
| Louis John | 1555 | -14 | -0.81 | -0.42 | -0.39 | 1.3 | 0.08 | -0.20 | 0.27 |
| Harrison Dunk | 1492 | -10 | -0.60 | -0.54 | -0.06 | -3.5 | -0.21 | -0.03 | -0.18 |
| Liam O Neil | 1182 | -11 | -0.84 | -0.46 | -0.38 | -0.7 | -0.05 | -0.11 | 0.06 |
| Adebayo Azeez | 1170 | -14 | -1.08 | -0.36 | -0.71 | -4.7 | -0.36 | 0.01 | -0.37 |
| Paul Lewis | 1169 | -10 | -0.77 | -0.48 | -0.29 | -2.9 | -0.22 | -0.04 | -0.18 |
| Harry Darling | 1072 | -13 | -1.09 | -0.38 | -0.71 | -4.7 | -0.39 | 0.01 | -0.40 |
Carlisle United (Actual 11th, xG 12th)
Performance by Match
Performance by Formation
| Starting Formation | Matches | Pts p90 | xPts p90 |
| 5-3-2 | 4 | 3.0 | 2.0 |
| 4-4-2 (Classic) | 9 | 1.8 | 1.4 |
| 3-5-2 | 5 | 1.4 | 1.7 |
| 4-5-1 | 16 | 1.4 | 1.2 |
| 4-3-3 | 10 | 1.1 | 1.3 |
| 4-4-1-1 | 1 | 0.0 | 1.4 |
| 3-5-1-1 | 1 | 0.0 | 0.8 |
Performance by Manager
| Managerial Record | Matches | Pts p90 | Rank | xPts p90 | Rank |
| John Sheridan | 26 | 1.6 | 5th | 1.4 | 10th |
| Tommy Wright | 2 | 1.5 | 1.5 | ||
| Steven Pressley | 18 | 1.3 | 15th | 1.3 | 15th |
Attacking Performance by Player
| Player | Apps | Mins | GI | G | A | xG | xGp90 |
| Hallam Hope | 40 | 3504 | 21 | 14 | 7 | 11.3 | 0.29 |
| Jamie Devitt | 35 | 2740 | 18 | 11 | 7 | 5.1 | 0.17 |
| Ashley Nadesan | 25 | 1921 | 14 | 8 | 6 | 5.7 | 0.27 |
| Danny Grainger | 23 | 1982 | 8 | 5 | 3 | 2.9 | 0.13 |
| Jerry Yates | 23 | 1926 | 7 | 6 | 1 | 4.6 | 0.22 |
| Callum O Hare | 16 | 1333 | 6 | 3 | 3 | 2.3 | 0.16 |
| Jack Sowerby | 24 | 1934 | 6 | 4 | 2 | 1.9 | 0.09 |
| Nathan Thomas | 16 | 1024 | 5 | 4 | 1 | 3.8 | 0.33 |
| Richard Bennett | 20 | 1195 | 5 | 4 | 1 | 2.7 | 0.21 |
| Regan Slater | 32 | 2055 | 4 | 2 | 2 | 1.7 | 0.07 |
Overall Performance by Player (P=Playing, NP=Not Playing)
| Player | Mins | GD P | GDp90 P | GDp90 NP | Diff | xGD P | xGDp90 P | xGDp90 NP | Diff |
| Team Average | 4140 | 5 | 0.11 | -1.6 | -0.03 | ||||
| Adam Collin | 3723 | 5 | 0.12 | 0.00 | 0.12 | -0.5 | -0.01 | -0.22 | 0.20 |
| Anthony Gerrard | 3681 | 11 | 0.27 | -1.18 | 1.45 | 2.2 | 0.05 | -0.73 | 0.79 |
| Hallam Hope | 3504 | 9 | 0.23 | -0.57 | 0.80 | 0.1 | 0.00 | -0.23 | 0.23 |
| Gary Liddle | 3490 | 4 | 0.10 | 0.14 | -0.04 | -0.7 | -0.02 | -0.12 | 0.10 |
| Tom Parkes | 3391 | 3 | 0.08 | 0.24 | -0.16 | -2.6 | -0.07 | 0.13 | -0.20 |
| Kelvin Etuhu | 3061 | 5 | 0.15 | 0.00 | 0.15 | 1.3 | 0.04 | -0.24 | 0.28 |
| Jamie Devitt | 2740 | 11 | 0.36 | -0.39 | 0.75 | 0.1 | 0.00 | -0.10 | 0.10 |
| Regan Slater | 2055 | -4 | -0.18 | 0.39 | -0.56 | -3.2 | -0.14 | 0.07 | -0.21 |
| Danny Grainger | 1982 | 11 | 0.50 | -0.25 | 0.75 | 0.8 | 0.04 | -0.10 | 0.14 |
| Jack Sowerby | 1934 | 12 | 0.56 | -0.29 | 0.84 | 5.4 | 0.25 | -0.28 | 0.54 |
| Jerry Yates | 1926 | 18 | 0.84 | -0.53 | 1.37 | 1.5 | 0.07 | -0.12 | 0.19 |
| Ashley Nadesan | 1921 | 15 | 0.70 | -0.41 | 1.11 | 5.4 | 0.25 | -0.28 | 0.53 |
| Macaulay Gillesphey | 1812 | 1 | 0.05 | 0.15 | -0.10 | -0.6 | -0.03 | -0.04 | 0.01 |
| Michael Jones | 1652 | -2 | -0.11 | 0.25 | -0.36 | 0.3 | 0.02 | -0.07 | 0.09 |
| Gary Miller | 1442 | -4 | -0.25 | 0.30 | -0.55 | -3.1 | -0.19 | 0.05 | -0.24 |
| Callum O Hare | 1333 | -5 | -0.34 | 0.32 | -0.66 | -2.8 | -0.19 | 0.04 | -0.23 |
| Richard Bennett | 1195 | -4 | -0.30 | 0.28 | -0.58 | -3.8 | -0.29 | 0.07 | -0.35 |
| Nathan Thomas | 1024 | -8 | -0.70 | 0.38 | -1.08 | -3.6 | -0.32 | 0.06 | -0.38 |
Cheltenham Town (Actual 16th, xG 21st)
Performance by Match
Performance by Formation
| Starting Formation | Matches | Pts p90 | xPts p90 |
| 3-4-2-1 | 1 | 3.0 | 1.0 |
| 4-1-4-1 | 2 | 2.0 | 1.8 |
| 3-4-1-2 | 2 | 2.0 | 1.8 |
| 3-5-2 | 21 | 1.7 | 1.4 |
| 4-4-2 (Classic) | 14 | 0.6 | 1.1 |
| 5-3-2 | 2 | 0.5 | 1.0 |
| 3-4-3 | 2 | 0.5 | 0.7 |
| 4-5-1 | 1 | 0.0 | 0.5 |
| 5-4-1 | 1 | 0.0 | 0.7 |
Performance by Manager
| Managerial Record | Matches | Pts p90 | Rank | xPts p90 | Rank |
| Gary Johnson | 4 | 0.3 | 1.4 | ||
| Russell Milton | 3 | 2.0 | 1.0 | ||
| Michael Duff | 39 | 1.3 | 1.2 |
Attacking Performance by Player
| Player | Apps | Mins | GI | G | A | xG | xGp90 |
| Luke Varney | 35 | 2599 | 15 | 14 | 1 | 8.9 | 0.31 |
| Tyrone Barnett | 30 | 1767 | 9 | 6 | 3 | 4.8 | 0.25 |
| Chris Hussey | 34 | 2858 | 8 | 1 | 7 | 2.6 | 0.08 |
| Conor Thomas | 31 | 2330 | 7 | 6 | 1 | 5.1 | 0.20 |
| Alex Addai | 21 | 974 | 6 | 0 | 6 | 2.6 | 0.24 |
| Kevin Dawson | 32 | 1997 | 6 | 4 | 2 | 3.7 | 0.17 |
| Ryan Broom | 39 | 3024 | 6 | 2 | 4 | 2.3 | 0.07 |
| Ben Tozer | 36 | 3043 | 4 | 1 | 3 | 1.1 | 0.03 |
| Billy Waters | 18 | 1040 | 4 | 4 | 2.1 | 0.18 | |
| Charlie Raglan | 19 | 1710 | 4 | 2 | 2 | 0.7 | 0.04 |
Overall Performance by Player (P=Playing, NP=Not Playing)
| Player | Mins | GD P | GDp90 P | GDp90 NP | Diff | xGD P | xGDp90 P | xGDp90 NP | Diff |
| Team Average | 4140 | -11 | -0.24 | -11.5 | -0.25 | ||||
| Scott Flinders | 4140 | -11 | -0.24 | -11.5 | -0.25 | ||||
| William Boyle | 3264 | -3 | -0.08 | -0.82 | 0.74 | -8.2 | -0.23 | -0.34 | 0.11 |
| Ben Tozer | 3043 | -3 | -0.09 | -0.66 | 0.57 | -7.5 | -0.22 | -0.33 | 0.11 |
| Ryan Broom | 3024 | -12 | -0.36 | 0.08 | -0.44 | -9.1 | -0.27 | -0.19 | -0.08 |
| Chris Hussey | 2858 | 4 | 0.13 | -1.05 | 1.18 | -4.5 | -0.14 | -0.49 | 0.35 |
| Jacob Maddox | 2611 | -3 | -0.10 | -0.47 | 0.37 | -6.1 | -0.21 | -0.32 | 0.11 |
| Luke Varney | 2599 | -9 | -0.31 | -0.12 | -0.19 | -7.4 | -0.26 | -0.24 | -0.02 |
| Conor Thomas | 2330 | -3 | -0.12 | -0.40 | 0.28 | -5.6 | -0.22 | -0.30 | 0.08 |
| Chris Clements | 2277 | -7 | -0.28 | -0.19 | -0.08 | -5.4 | -0.21 | -0.30 | 0.08 |
| Nigel Atangana | 2162 | -9 | -0.37 | -0.09 | -0.28 | -9.1 | -0.38 | -0.11 | -0.27 |
| Kevin Dawson | 1997 | 1 | 0.05 | -0.50 | 0.55 | -2.2 | -0.10 | -0.39 | 0.29 |
| Jordan Forster | 1940 | -6 | -0.28 | -0.20 | -0.07 | -6.5 | -0.30 | -0.21 | -0.10 |
| Tyrone Barnett | 1767 | -5 | -0.25 | -0.23 | -0.03 | -5.3 | -0.27 | -0.24 | -0.03 |
| Charlie Raglan | 1710 | -2 | -0.11 | -0.33 | 0.23 | -1.5 | -0.08 | -0.37 | 0.29 |
| John Mullins | 1539 | -12 | -0.70 | 0.03 | -0.74 | -5.5 | -0.32 | -0.21 | -0.11 |
| Jordan Tillson | 1057 | -4 | -0.34 | -0.20 | -0.14 | -2.4 | -0.21 | -0.27 | 0.06 |
| Billy Waters | 1040 | 6 | 0.52 | -0.49 | 1.01 | 1.0 | 0.09 | -0.36 | 0.45 |
| Alex Addai | 974 | -4 | -0.37 | -0.20 | -0.17 | -0.3 | -0.02 | -0.32 | 0.30 |
Colchester United (Actual 8th, xG 4th)
Performance by Match
Performance by Formation
| Starting Formation | Matches | Pts p90 | xPts p90 |
| 4-4-2 (Classic) | 1 | 3.0 | 2.1 |
| 4-3-3 | 1 | 3.0 | 2.3 |
| 4-4-1-1 | 8 | 2.0 | 1.6 |
| 3-4-3 | 2 | 1.5 | 1.6 |
| 4-2-3-1 | 30 | 1.5 | 1.5 |
| 3-4-2-1 | 2 | 0.5 | 1.3 |
| 3-4-1-2 | 2 | 0.0 | 1.9 |
Attacking Performance by Player
| Player | Apps | Mins | GI | G | A | xG | xGp90 |
| Sammie Szmodics | 43 | 3832 | 21 | 14 | 7 | 11.5 | 0.27 |
| Frank Nouble | 43 | 3717 | 11 | 9 | 2 | 6.4 | 0.15 |
| Luke Norris | 33 | 1918 | 11 | 7 | 4 | 8.0 | 0.38 |
| Harry Pell | 31 | 2628 | 9 | 6 | 3 | 4.6 | 0.16 |
| Courtney Senior | 42 | 3150 | 8 | 6 | 2 | 5.2 | 0.15 |
| Brennan Dickenson | 41 | 1977 | 7 | 3 | 4 | 2.2 | 0.10 |
| Ryan Jackson | 46 | 4084 | 7 | 2 | 5 | 1.9 | 0.04 |
| Mikael Mandron | 41 | 1660 | 5 | 2 | 3 | 4.0 | 0.21 |
| Frankie Kent | 40 | 3382 | 4 | 4 | 4.8 | 0.13 | |
| Kane Vincent-Young | 40 | 3352 | 4 | 3 | 1 | 1.2 | 0.03 |
Overall Performance by Player (P=Playing, NP=Not Playing)
| Player | Mins | GD P | GDp90 P | GDp90 NP | Diff | xGD P | xGDp90 P | xGDp90 NP | Diff |
| Team Average | 4140 | 12 | 0.26 | 13.2 | 0.29 | ||||
| Ryan Jackson | 4084 | 11 | 0.24 | 1.61 | -1.36 | 11.3 | 0.25 | 3.05 | -2.80 |
| Sammie Szmodics | 3832 | 15 | 0.35 | -0.88 | 1.23 | 12.3 | 0.29 | 0.25 | 0.04 |
| Frank Nouble | 3717 | 15 | 0.36 | -0.64 | 1.00 | 12.5 | 0.30 | 0.15 | 0.16 |
| Frankie Kent | 3382 | 11 | 0.29 | 0.12 | 0.17 | 11.2 | 0.30 | 0.24 | 0.06 |
| Kane Vincent-Young | 3352 | 6 | 0.16 | 0.69 | -0.52 | 10.5 | 0.28 | 0.30 | -0.02 |
| Luke Prosser | 3319 | 10 | 0.27 | 0.22 | 0.05 | 8.0 | 0.22 | 0.57 | -0.35 |
| Courtney Senior | 3150 | 8 | 0.23 | 0.36 | -0.14 | 12.6 | 0.36 | 0.05 | 0.31 |
| Tom Lapslie | 2939 | 10 | 0.31 | 0.15 | 0.16 | 7.8 | 0.24 | 0.40 | -0.17 |
| Harry Pell | 2628 | 15 | 0.51 | -0.18 | 0.69 | 6.7 | 0.23 | 0.39 | -0.16 |
| Tom Eastman | 2174 | 4 | 0.17 | 0.37 | -0.20 | 11.4 | 0.47 | 0.08 | 0.39 |
| Dillon Barnes | 1980 | 5 | 0.23 | 0.29 | -0.06 | 4.3 | 0.19 | 0.37 | -0.18 |
| Rene Gilmartin | 1980 | 2 | 0.09 | 0.42 | -0.33 | 7.6 | 0.35 | 0.23 | 0.11 |
| Brennan Dickenson | 1977 | 14 | 0.64 | -0.08 | 0.72 | 7.5 | 0.34 | 0.24 | 0.10 |
| Luke Norris | 1918 | 3 | 0.14 | 0.36 | -0.22 | 5.2 | 0.24 | 0.32 | -0.08 |
| Mikael Mandron | 1660 | -3 | -0.16 | 0.54 | -0.71 | 7.9 | 0.43 | 0.19 | 0.24 |
| Ben Stevenson | 994 | -1 | -0.09 | 0.37 | -0.46 | 2.7 | 0.24 | 0.30 | -0.06 |
| Abobaker Eisa | 633 | -1 | -0.14 | 0.33 | -0.48 | 0.0 | 0.00 | 0.34 | -0.34 |
| Brandon Comley | 482 | 1 | 0.19 | 0.27 | -0.08 | -0.4 | -0.07 | 0.33 | -0.41 |
Crawley Town (Actual 19th, xG 17th)
Performance by Match
Performance by Formation
| Starting Formation | Matches | Pts p90 | xPts p90 |
| 4-4-2 (Classic) | 25 | 1.4 | 1.3 |
| 3-5-1-1 | 4 | 1.3 | 1.1 |
| 3-5-2 | 10 | 1.1 | 1.2 |
| 4-3-3 | 3 | 1.0 | 1.6 |
| 4-1-4-1 | 1 | 0.0 | 1.1 |
| 5-3-2 | 1 | 0.0 | 0.8 |
| 3-3-3-1 | 1 | 0.0 | 1.0 |
| 3-4-2-1 | 1 | 0.0 | 1.4 |
Performance by Manager
| Managerial Record | Matches | Pts p90 | Rank | xPts p90 | Rank |
| Harry Kewell | 5 | 1.4 | 13th | 1.6 | 2nd |
| Filipe Morais | 1 | 0.0 | 1.1 | ||
| Gabriele Cioffi | 40 | 1.2 | 19th | 1.2 | 18th |
Attacking Performance by Player
| Player | Apps | Mins | GI | G | A | xG | xGp90 |
| Ollie Palmer | 40 | 3474 | 18 | 14 | 4 | 14.5 | 0.38 |
| Filipe Morais | 34 | 2711 | 12 | 8 | 4 | 6.9 | 0.23 |
| Lewis Young | 37 | 3036 | 9 | 1 | 8 | 0.9 | 0.03 |
| Ashley Nathaniel-George | 29 | 1572 | 8 | 6 | 2 | 2.6 | 0.15 |
| Dominic Poleon | 30 | 1795 | 5 | 5 | 5.7 | 0.28 | |
| Luke Gambin | 26 | 1800 | 5 | 3 | 2 | 2.5 | 0.12 |
| Panutche Camara | 44 | 3167 | 5 | 3 | 2 | 3.7 | 0.11 |
| Dannie Bulman | 36 | 2583 | 4 | 3 | 1 | 1.3 | 0.04 |
| George Francomb | 41 | 3444 | 3 | 0 | 3 | 0.9 | 0.02 |
| Joe Maguire | 27 | 2173 | 3 | 1 | 2 | 0.4 | 0.02 |
Overall Performance by Player (P=Playing, NP=Not Playing)
| Player | Mins | GD P | GDp90 P | GDp90 NP | Diff | xGD P | xGDp90 P | xGDp90 NP | Diff |
| Team Average | 4140 | -17 | -0.37 | -6.7 | -0.15 | ||||
| Glenn Morris | 4140 | -17 | -0.37 | -6.7 | -0.15 | ||||
| Ollie Palmer | 3474 | -19 | -0.49 | 0.27 | -0.76 | -5.8 | -0.15 | -0.12 | -0.03 |
| George Francomb | 3444 | -15 | -0.39 | -0.26 | -0.13 | -9.0 | -0.24 | 0.30 | -0.53 |
| Panutche Camara | 3167 | -5 | -0.14 | -1.11 | 0.97 | -2.6 | -0.07 | -0.38 | 0.31 |
| Lewis Young | 3036 | -12 | -0.36 | -0.41 | 0.05 | -5.4 | -0.16 | -0.11 | -0.05 |
| Filipe Morais | 2711 | -16 | -0.53 | -0.06 | -0.47 | -5.8 | -0.19 | -0.06 | -0.14 |
| Dannie Bulman | 2583 | -13 | -0.45 | -0.23 | -0.22 | -7.9 | -0.28 | 0.07 | -0.34 |
| Joe McNerney | 2421 | -14 | -0.52 | -0.16 | -0.36 | -7.2 | -0.27 | 0.03 | -0.30 |
| Joe Maguire | 2173 | -9 | -0.37 | -0.37 | -0.01 | -3.8 | -0.16 | -0.13 | -0.02 |
| Josh Payne | 2028 | -3 | -0.13 | -0.60 | 0.46 | -2.4 | -0.11 | -0.18 | 0.07 |
| Mark Connolly | 1994 | -6 | -0.27 | -0.46 | 0.19 | -2.5 | -0.11 | -0.18 | 0.06 |
| Luke Gambin | 1800 | -3 | -0.15 | -0.54 | 0.39 | -4.5 | -0.23 | -0.08 | -0.14 |
| Dominic Poleon | 1795 | -9 | -0.45 | -0.31 | -0.14 | -3.2 | -0.16 | -0.14 | -0.02 |
| Tom Dallison | 1710 | -11 | -0.58 | -0.22 | -0.36 | -5.3 | -0.28 | -0.05 | -0.23 |
| Ashley Nathaniel-George | 1572 | -2 | -0.11 | -0.53 | 0.41 | 1.9 | 0.11 | -0.30 | 0.41 |
| Reece Grego-Cox | 1424 | -6 | -0.38 | -0.36 | -0.01 | 0.8 | 0.05 | -0.25 | 0.30 |
| David Sesay | 1408 | -5 | -0.32 | -0.40 | 0.08 | -3.3 | -0.21 | -0.11 | -0.10 |
| Josh Doherty | 1164 | -1 | -0.08 | -0.48 | 0.41 | 1.9 | 0.15 | -0.26 | 0.41 |
Crewe Alexandra (Actual 12th, xG 13th)
Performance by Match
Performance by Formation
| Starting Formation | Matches | Pts p90 | xPts p90 |
| 4-1-3-2 | 1 | 3.0 | 2.1 |
| 4-3-3 | 18 | 1.8 | 1.5 |
| 4-1-2-1-2 (Diamond Formation) | 3 | 1.3 | 1.3 |
| 4-4-2 (Classic) | 23 | 1.1 | 1.2 |
| 4-5-1 | 1 | 0.0 | 1.3 |
Attacking Performance by Player
| Player | Apps | Mins | GI | G | A | xG | xGp90 |
| Charlie Kirk | 42 | 3354 | 18 | 11 | 7 | 6.3 | 0.17 |
| Chris Porter | 40 | 2591 | 15 | 13 | 2 | 10.9 | 0.38 |
| Jordan Bowery | 43 | 3203 | 12 | 8 | 4 | 7.6 | 0.21 |
| Callum Ainley | 43 | 2935 | 9 | 6 | 3 | 5.0 | 0.15 |
| James Jones | 38 | 2898 | 8 | 5 | 3 | 3.8 | 0.12 |
| Harry Pickering | 33 | 2780 | 5 | 0 | 5 | 1.3 | 0.04 |
| Paul Green | 26 | 2114 | 5 | 1 | 4 | 3.3 | 0.14 |
| Perry Ng | 44 | 3960 | 5 | 0 | 5 | 2.7 | 0.06 |
| Tom Lowery | 14 | 720 | 5 | 1 | 4 | 1.5 | 0.19 |
| Ryan Wintle | 46 | 4109 | 4 | 1 | 3 | 1.8 | 0.04 |
Overall Performance by Player (P=Playing, NP=Not Playing)
| Player | Mins | GD P | GDp90 P | GDp90 NP | Diff | xGD P | xGDp90 P | xGDp90 NP | Diff |
| Team Average | 4140 | 1 | 0.02 | -0.5 | -0.01 | ||||
| Ryan Wintle | 4109 | -1 | -0.02 | 5.81 | -5.83 | -1.8 | -0.04 | 3.85 | -3.89 |
| Perry Ng | 3960 | -2 | -0.05 | 1.50 | -1.55 | -1.3 | -0.03 | 0.38 | -0.41 |
| Ben Garratt | 3420 | 0 | 0.00 | 0.13 | -0.13 | 1.3 | 0.03 | -0.22 | 0.26 |
| Charlie Kirk | 3354 | 7 | 0.19 | -0.69 | 0.87 | -1.1 | -0.03 | 0.07 | -0.10 |
| Jordan Bowery | 3203 | -3 | -0.08 | 0.38 | -0.47 | 0.4 | 0.01 | -0.08 | 0.09 |
| Callum Ainley | 2935 | -1 | -0.03 | 0.15 | -0.18 | -0.9 | -0.03 | 0.03 | -0.05 |
| James Jones | 2898 | -1 | -0.03 | 0.14 | -0.18 | -1.9 | -0.06 | 0.10 | -0.16 |
| Eddie Nolan | 2830 | 3 | 0.10 | -0.14 | 0.23 | 3.5 | 0.11 | -0.27 | 0.38 |
| Harry Pickering | 2780 | 2 | 0.06 | -0.07 | 0.13 | 1.3 | 0.04 | -0.12 | 0.17 |
| George Ray | 2708 | -6 | -0.20 | 0.44 | -0.64 | 0.6 | 0.02 | -0.07 | 0.09 |
| Chris Porter | 2591 | 2 | 0.07 | -0.06 | 0.13 | 3.7 | 0.13 | -0.24 | 0.37 |
| Paul Green | 2114 | 5 | 0.21 | -0.18 | 0.39 | 3.8 | 0.16 | -0.19 | 0.35 |
| Nicky Hunt | 1714 | 13 | 0.68 | -0.45 | 1.13 | -2.8 | -0.15 | 0.08 | -0.23 |
| Corey Whelan | 1369 | -8 | -0.53 | 0.29 | -0.82 | -3.6 | -0.24 | 0.10 | -0.34 |
| Shaun Miller | 1303 | -3 | -0.21 | 0.13 | -0.33 | -0.1 | -0.01 | -0.01 | 0.01 |
| Tom Lowery | 720 | 2 | 0.25 | -0.03 | 0.28 | -2.2 | -0.28 | 0.04 | -0.32 |
| Alex Nicholls | 662 | -9 | -1.22 | 0.26 | -1.48 | -5.7 | -0.77 | 0.13 | -0.91 |
| Kevin O Connor | 450 | 2 | 0.40 | -0.02 | 0.42 | -1.1 | -0.23 | 0.02 | -0.25 |
Exeter City (Actual 9th, xG 9th)
Performance by Match
Performance by Formation
| Starting Formation | Matches | Pts p90 | xPts p90 |
| 4-4-1-1 | 7 | 2.6 | 1.4 |
| 4-5-1 | 4 | 1.8 | 2.1 |
| 4-4-2 (Classic) | 24 | 1.4 | 1.4 |
| 4-2-3-1 | 5 | 1.4 | 1.5 |
| 4-2-2-2 | 1 | 1.0 | 1.4 |
| 3-5-2 | 3 | 0.7 | 0.8 |
| 4-3-3 | 2 | 0.5 | 1.0 |
Attacking Performance by Player
| Player | Apps | Mins | GI | G | A | xG | xGp90 |
| Jayden Stockley | 25 | 2194 | 17 | 16 | 1 | 12.3 | 0.51 |
| Nicky Law | 43 | 3375 | 15 | 10 | 5 | 6.5 | 0.17 |
| Lee Holmes | 34 | 2294 | 9 | 3 | 6 | 3.6 | 0.14 |
| Pierce Sweeney | 43 | 3839 | 8 | 4 | 4 | 4.9 | 0.11 |
| Hiram Boateng | 28 | 1953 | 7 | 1 | 6 | 3.1 | 0.14 |
| Jonathan Forte | 27 | 1479 | 7 | 5 | 2 | 6.2 | 0.38 |
| Craig Woodman | 32 | 2443 | 6 | 0 | 6 | 0.3 | 0.01 |
| Matt Jay | 17 | 943 | 5 | 4 | 1 | 2.2 | 0.21 |
| Ryan Bowman | 18 | 1239 | 5 | 5 | 4.4 | 0.32 | |
| Dean Moxey | 38 | 3361 | 4 | 3 | 1 | 1.8 | 0.05 |
Overall Performance by Player (P=Playing, NP=Not Playing)
| Player | Mins | GD P | GDp90 P | GDp90 NP | Diff | xGD P | xGDp90 P | xGDp90 NP | Diff |
| Team Average | 4140 | 11 | 0.24 | 7.9 | 0.17 | ||||
| Jake Taylor | 4140 | 11 | 0.24 | 7.9 | 0.17 | ||||
| Christy Pym | 3870 | 15 | 0.35 | -1.33 | 1.68 | 9.0 | 0.21 | -0.39 | 0.60 |
| Pierce Sweeney | 3839 | 12 | 0.28 | -0.30 | 0.58 | 9.9 | 0.23 | -0.60 | 0.83 |
| Nicky Law | 3375 | 5 | 0.13 | 0.71 | -0.57 | 4.7 | 0.13 | 0.37 | -0.24 |
| Dean Moxey | 3361 | 14 | 0.37 | -0.35 | 0.72 | 6.8 | 0.18 | 0.12 | 0.07 |
| Craig Woodman | 2443 | 8 | 0.29 | 0.16 | 0.14 | -0.3 | -0.01 | 0.44 | -0.45 |
| Dara O Shea | 2340 | 2 | 0.08 | 0.45 | -0.37 | 8.3 | 0.32 | -0.02 | 0.34 |
| Lee Holmes | 2294 | 11 | 0.43 | 0.00 | 0.43 | 7.6 | 0.30 | 0.01 | 0.29 |
| Jayden Stockley | 2194 | 8 | 0.33 | 0.14 | 0.19 | 4.2 | 0.17 | 0.17 | 0.00 |
| Aaron Martin | 1991 | 6 | 0.27 | 0.21 | 0.06 | 0.3 | 0.01 | 0.32 | -0.30 |
| Hiram Boateng | 1953 | 13 | 0.60 | -0.08 | 0.68 | 4.8 | 0.22 | 0.12 | 0.10 |
| Archie Collins | 1941 | 1 | 0.05 | 0.41 | -0.36 | 6.5 | 0.30 | 0.05 | 0.25 |
| Lee Martin | 1921 | 2 | 0.09 | 0.37 | -0.27 | 3.5 | 0.17 | 0.18 | -0.01 |
| Jonathan Forte | 1479 | 11 | 0.67 | 0.00 | 0.67 | 6.9 | 0.42 | 0.03 | 0.39 |
| Ryan Bowman | 1239 | 3 | 0.22 | 0.25 | -0.03 | 1.1 | 0.08 | 0.21 | -0.13 |
| Kane Wilson | 1146 | 0 | 0.00 | 0.33 | -0.33 | -2.6 | -0.21 | 0.31 | -0.52 |
| Jordan Tillson | 1059 | 6 | 0.51 | 0.15 | 0.36 | 1.4 | 0.12 | 0.19 | -0.07 |
| Luke Croll | 1039 | 4 | 0.35 | 0.20 | 0.14 | 1.6 | 0.14 | 0.18 | -0.05 |
Forest Green Rovers (Actual 5th, xG 14th)
Performance by Match
Performance by Formation
| Starting Formation | Matches | Pts p90 | xPts p90 |
| 3-4-1-2 | 2 | 2.0 | 1.8 |
| 3-5-2 | 14 | 1.7 | 1.5 |
| 4-3-3 | 11 | 1.6 | 1.3 |
| 4-2-3-1 | 10 | 1.6 | 1.3 |
| 4-4-2 (Classic) | 2 | 1.5 | 1.3 |
| 3-5-1-1 | 6 | 1.3 | 1.1 |
| 5-3-2 | 1 | 1.0 | 1.0 |
Attacking Performance by Player
| Player | Apps | Mins | GI | G | A | xG | xGp90 |
| Reece Brown | 45 | 3670 | 22 | 11 | 11 | 6.4 | 0.16 |
| Christian Doidge | 24 | 2090 | 16 | 14 | 2 | 8.9 | 0.38 |
| Joseph Mills | 44 | 3880 | 11 | 4 | 7 | 2.6 | 0.06 |
| George C Williams | 37 | 2034 | 10 | 7 | 3 | 6.8 | 0.30 |
| Liam Shephard | 39 | 3348 | 10 | 5 | 5 | 2.3 | 0.06 |
| Reuben Reid | 28 | 1798 | 9 | 7 | 2 | 4.3 | 0.22 |
| Carl Winchester | 45 | 3860 | 6 | 3 | 3 | 5.0 | 0.12 |
| Junior Mondal | 17 | 777 | 6 | 3 | 3 | 1.3 | 0.15 |
| Dayle Grubb | 29 | 1496 | 5 | 3 | 2 | 3.5 | 0.21 |
| Tahvon Campbell | 18 | 900 | 5 | 3 | 2 | 3.1 | 0.31 |
Overall Performance by Player (P=Playing, NP=Not Playing)
| Player | Mins | GD P | GDp90 P | GDp90 NP | Diff | xGD P | xGDp90 P | xGDp90 NP | Diff |
| Team Average | 4140 | 21 | 0.46 | -0.4 | -0.01 | ||||
| Joseph Mills | 3880 | 17 | 0.39 | 1.38 | -0.99 | -0.4 | -0.01 | 0.01 | -0.01 |
| Carl Winchester | 3860 | 20 | 0.47 | 0.32 | 0.14 | 1.5 | 0.03 | -0.59 | 0.62 |
| Reece Brown | 3670 | 23 | 0.56 | -0.38 | 0.95 | 3.1 | 0.08 | -0.67 | 0.75 |
| Gavin Gunning | 3437 | 18 | 0.47 | 0.38 | 0.09 | -1.9 | -0.05 | 0.19 | -0.24 |
| Farrend Rawson | 3410 | 24 | 0.63 | -0.37 | 1.00 | -2.2 | -0.06 | 0.23 | -0.28 |
| Liam Shephard | 3348 | 24 | 0.65 | -0.34 | 0.99 | 2.3 | 0.06 | -0.30 | 0.36 |
| Nathan McGinley | 2907 | 15 | 0.46 | 0.44 | 0.03 | -1.0 | -0.03 | 0.05 | -0.08 |
| Paul Digby | 2752 | 6 | 0.20 | 0.97 | -0.78 | -0.3 | -0.01 | 0.00 | -0.01 |
| Lloyd James | 2589 | 11 | 0.38 | 0.58 | -0.20 | -0.8 | -0.03 | 0.02 | -0.05 |
| Christian Doidge | 2090 | 11 | 0.47 | 0.44 | 0.03 | 0.4 | 0.02 | -0.03 | 0.05 |
| George C Williams | 2034 | 12 | 0.53 | 0.38 | 0.15 | 4.5 | 0.20 | -0.21 | 0.41 |
| Reuben Reid | 1798 | 10 | 0.50 | 0.42 | 0.08 | 0.5 | 0.03 | -0.03 | 0.06 |
| Robert Sanchez | 1620 | 8 | 0.44 | 0.46 | -0.02 | 1.9 | 0.11 | -0.08 | 0.19 |
| James Montgomery | 1591 | 9 | 0.51 | 0.42 | 0.09 | -1.1 | -0.06 | 0.03 | -0.09 |
| Dayle Grubb | 1496 | 0 | 0.00 | 0.71 | -0.71 | -3.8 | -0.23 | 0.12 | -0.35 |
| Lewis Ward | 1019 | 4 | 0.35 | 0.49 | -0.14 | -0.3 | -0.03 | 0.00 | -0.03 |
| Tahvon Campbell | 900 | 8 | 0.80 | 0.36 | 0.44 | 0.4 | 0.04 | -0.02 | 0.06 |
| Junior Mondal | 777 | 7 | 0.81 | 0.37 | 0.44 | 0.0 | 0.00 | -0.01 | 0.01 |
Grimsby Town (Actual 17th, xG 24th)
Performance by Match
Performance by Formation
| Starting Formation | Matches | Pts p90 | xPts p90 |
| 4-4-2 (Classic) | 11 | 2.1 | 1.4 |
| 3-4-1-2 | 2 | 2.0 | 1.4 |
| 4-2-3-1 | 2 | 1.5 | 1.3 |
| 3-5-2 | 14 | 1.1 | 1.0 |
| 4-4-1-1 | 4 | 0.8 | 0.8 |
| 4-3-3 | 10 | 0.7 | 0.9 |
| 4-5-1 | 2 | 0.5 | 1.0 |
| 4-1-4-1 | 1 | 0.0 | 1.3 |
Attacking Performance by Player
| Player | Apps | Mins | GI | G | A | xG | xGp90 |
| Wes Thomas | 36 | 2902 | 11 | 11 | 9.5 | 0.29 | |
| Charles Vernam | 35 | 1878 | 6 | 3 | 3 | 3.9 | 0.19 |
| Elliot Embleton | 27 | 2241 | 5 | 3 | 2 | 3.9 | 0.16 |
| Jordan Cook | 24 | 1543 | 5 | 4 | 1 | 2.3 | 0.14 |
| Harry Davis | 35 | 2908 | 4 | 4 | 2.0 | 0.06 | |
| Luke Hendrie | 41 | 3583 | 4 | 2 | 2 | 1.6 | 0.04 |
| Mitch Rose | 24 | 1552 | 4 | 3 | 1 | 3.0 | 0.18 |
| Harry Clifton | 39 | 2668 | 3 | 2 | 1 | 1.8 | 0.06 |
| Martyn Woolford | 35 | 2158 | 3 | 3 | 2.1 | 0.09 | |
| Alex Whitmore | 31 | 2334 | 2 | 1 | 1 | 1.0 | 0.04 |
Overall Performance by Player (P=Playing, NP=Not Playing)
| Player | Mins | GD P | GDp90 P | GDp90 NP | Diff | xGD P | xGDp90 P | xGDp90 NP | Diff |
| Team Average | 4140 | -12 | -0.26 | -22.1 | -0.48 | ||||
| James McKeown | 3870 | -13 | -0.30 | 0.33 | -0.64 | -19.7 | -0.46 | -0.81 | 0.36 |
| Jake Hessenthaler | 3613 | -14 | -0.35 | 0.34 | -0.69 | -18.5 | -0.46 | -0.61 | 0.15 |
| Luke Hendrie | 3583 | -9 | -0.23 | -0.48 | 0.26 | -19.1 | -0.48 | -0.48 | 0.00 |
| Harry Davis | 2908 | -13 | -0.40 | 0.07 | -0.48 | -11.2 | -0.35 | -0.80 | 0.45 |
| Wes Thomas | 2902 | -6 | -0.19 | -0.44 | 0.25 | -18.3 | -0.57 | -0.28 | -0.29 |
| Harry Clifton | 2668 | -5 | -0.17 | -0.43 | 0.26 | -11.8 | -0.40 | -0.63 | 0.23 |
| Danny Collins | 2454 | -12 | -0.44 | 0.00 | -0.44 | -12.0 | -0.44 | -0.54 | 0.10 |
| Alex Whitmore | 2334 | 0 | 0.00 | -0.60 | 0.60 | -11.7 | -0.45 | -0.52 | 0.07 |
| Elliot Embleton | 2241 | 7 | 0.28 | -0.90 | 1.18 | -11.3 | -0.45 | -0.51 | 0.06 |
| Martyn Woolford | 2158 | -8 | -0.33 | -0.18 | -0.15 | -15.1 | -0.63 | -0.32 | -0.32 |
| Reece Hall-Johnson | 2083 | -6 | -0.26 | -0.26 | 0.00 | -13.7 | -0.59 | -0.37 | -0.23 |
| Charles Vernam | 1878 | -14 | -0.67 | 0.08 | -0.75 | -9.2 | -0.44 | -0.51 | 0.07 |
| Mitch Rose | 1552 | -12 | -0.70 | 0.00 | -0.70 | -13.8 | -0.80 | -0.29 | -0.51 |
| Jordan Cook | 1543 | -10 | -0.58 | -0.07 | -0.51 | -7.3 | -0.42 | -0.51 | 0.09 |
| Sebastian Ring | 1239 | -6 | -0.44 | -0.19 | -0.25 | -6.5 | -0.47 | -0.48 | 0.01 |
| Ludvig Ohman | 1073 | -2 | -0.17 | -0.29 | 0.13 | -5.8 | -0.49 | -0.48 | -0.01 |
| JJ Hooper | 960 | -1 | -0.09 | -0.31 | 0.22 | -4.3 | -0.40 | -0.50 | 0.10 |
| Harry Cardwell | 949 | 1 | 0.09 | -0.37 | 0.46 | -5.0 | -0.48 | -0.48 | 0.00 |
Lincoln City (Actual 1st, xG 5th)
Performance by Match
Performance by Formation
| Starting Formation | Matches | Pts p90 | xPts p90 |
| 4-2-2-2 | 1 | 3.0 | 1.8 |
| 3-4-1-2 | 1 | 3.0 | 0.7 |
| 4-5-1 | 1 | 3.0 | 1.9 |
| 4-3-3 | 6 | 2.5 | 1.8 |
| 4-2-3-1 | 10 | 1.8 | 1.6 |
| 4-4-2 (Classic) | 22 | 1.7 | 1.5 |
| 4-4-1-1 | 5 | 1.2 | 1.4 |
Attacking Performance by Player
| Player | Apps | Mins | GI | G | A | xG | xGp90 |
| John Akinde | 45 | 3582 | 21 | 15 | 6 | 15.6 | 0.39 |
| Bruno Andrade | 42 | 3315 | 14 | 10 | 4 | 6.2 | 0.17 |
| Harry Anderson | 43 | 3405 | 9 | 5 | 4 | 5.7 | 0.15 |
| Harry Toffolo | 46 | 4105 | 9 | 3 | 6 | 1.5 | 0.03 |
| Shay McCartan | 38 | 2068 | 9 | 7 | 2 | 5.1 | 0.22 |
| Lee Frecklington | 27 | 1968 | 6 | 3 | 3 | 2.6 | 0.12 |
| Neal Eardley | 43 | 3771 | 5 | 2 | 3 | 1.1 | 0.03 |
| Jason Shackell | 35 | 3029 | 4 | 4 | 2.4 | 0.07 | |
| Mark O Hara | 17 | 1196 | 4 | 1 | 3 | 0.9 | 0.07 |
| Matt Green | 19 | 359 | 4 | 2 | 2 | 1.9 | 0.47 |
Overall Performance by Player (P=Playing, NP=Not Playing)
| Player | Mins | GD P | GDp90 P | GDp90 NP | Diff | xGD P | xGDp90 P | xGDp90 NP | Diff |
| Team Average | 4140 | 30 | 0.65 | 13.3 | 0.29 | ||||
| Harry Toffolo | 4105 | 30 | 0.66 | 0.00 | 0.66 | 14.7 | 0.32 | -3.58 | 3.90 |
| Michael Bostwick | 4010 | 30 | 0.67 | 0.00 | 0.67 | 12.7 | 0.28 | 0.40 | -0.12 |
| Neal Eardley | 3771 | 29 | 0.69 | 0.24 | 0.45 | 12.1 | 0.29 | 0.28 | 0.01 |
| John Akinde | 3582 | 26 | 0.65 | 0.65 | 0.01 | 12.1 | 0.30 | 0.19 | 0.12 |
| Harry Anderson | 3405 | 24 | 0.63 | 0.73 | -0.10 | 14.1 | 0.37 | -0.10 | 0.48 |
| Bruno Andrade | 3315 | 26 | 0.71 | 0.44 | 0.27 | 12.4 | 0.34 | 0.09 | 0.24 |
| Thomas Pett | 3115 | 27 | 0.78 | 0.26 | 0.52 | 11.2 | 0.32 | 0.18 | 0.15 |
| Jason Shackell | 3029 | 25 | 0.74 | 0.41 | 0.34 | 8.0 | 0.24 | 0.42 | -0.19 |
| Michael O Connor | 2706 | 18 | 0.60 | 0.75 | -0.15 | 10.3 | 0.34 | 0.19 | 0.16 |
| Shay McCartan | 2068 | 20 | 0.87 | 0.43 | 0.44 | 8.5 | 0.37 | 0.21 | 0.16 |
| Lee Frecklington | 1968 | 20 | 0.91 | 0.41 | 0.50 | 4.3 | 0.20 | 0.37 | -0.17 |
| Josh Vickers | 1620 | 6 | 0.33 | 0.86 | -0.52 | 2.4 | 0.13 | 0.39 | -0.26 |
| Grant Smith | 1440 | 14 | 0.88 | 0.53 | 0.34 | 4.5 | 0.28 | 0.29 | -0.01 |
| Mark O Hara | 1196 | 2 | 0.15 | 0.86 | -0.71 | 2.9 | 0.22 | 0.32 | -0.10 |
| Cian Bolger | 1153 | 5 | 0.39 | 0.75 | -0.36 | 4.0 | 0.31 | 0.28 | 0.03 |
| Danny M. Rowe | 1132 | 5 | 0.40 | 0.75 | -0.35 | 3.6 | 0.29 | 0.29 | 0.00 |
| Matthew Gilks | 1080 | 10 | 0.83 | 0.59 | 0.25 | 6.4 | 0.53 | 0.20 | 0.33 |
| Matt Rhead | 888 | 2 | 0.20 | 0.77 | -0.57 | 1.4 | 0.14 | 0.33 | -0.19 |
Macclesfield Town (Actual 22nd, xG 23rd)
Performance by Match
Performance by Formation
| Starting Formation | Matches | Pts p90 | xPts p90 |
| 3-5-1-1 | 1 | 3.0 | 0.7 |
| 4-5-1 | 1 | 3.0 | 1.6 |
| 4-3-1-2 | 2 | 2.0 | 1.6 |
| 5-3-2 | 3 | 1.3 | 1.3 |
| 3-5-2 | 5 | 1.2 | 1.2 |
| 3-4-3 | 1 | 1.0 | 1.6 |
| 4-4-2 (Classic) | 13 | 1.0 | 1.1 |
| 4-2-3-1 | 7 | 0.7 | 1.2 |
| 4-3-3 | 10 | 0.5 | 1.0 |
| 4-4-1-1 | 2 | 0.0 | 1.2 |
| 3-4-1-2 | 1 | 0.0 | 0.7 |
Performance by Manager
| Managerial Record | Matches | Pts p90 | Rank | xPts p90 | Rank |
| Mark Yates | 12 | 0.3 | 24th | 1.1 | 24th |
| Danny Whitaker | 8 | 1.1 | 20th | 1.3 | 16th |
| Sol Campbell | 26 | 1.2 | 18th | 1.1 | 24th |
Attacking Performance by Player
| Player | Apps | Mins | GI | G | A | xG | xGp90 |
| Scott Wilson | 32 | 1875 | 11 | 10 | 1 | 5.9 | 0.28 |
| Harry Smith | 39 | 2867 | 10 | 8 | 2 | 7.5 | 0.24 |
| Michael Rose | 40 | 3427 | 10 | 5 | 5 | 4.5 | 0.12 |
| Elliott Durrell | 17 | 1427 | 6 | 4 | 2 | 3.8 | 0.24 |
| Ben Stephens | 22 | 1520 | 5 | 1 | 4 | 2.6 | 0.16 |
| David Fitzpatrick | 40 | 3581 | 5 | 3 | 2 | 1.9 | 0.05 |
| Koby Arthur | 20 | 1344 | 5 | 3 | 2 | 1.6 | 0.10 |
| Callum Maycock | 27 | 1917 | 3 | 0 | 3 | 0.5 | 0.02 |
| Danny Whitaker | 21 | 1500 | 3 | 3 | 3.1 | 0.18 | |
| Nathan Cameron | 25 | 2250 | 3 | 2 | 1 | 1.1 | 0.04 |
Overall Performance by Player (P=Playing, NP=Not Playing)
| Player | Mins | GD P | GDp90 P | GDp90 NP | Diff | xGD P | xGDp90 P | xGDp90 NP | Diff |
| Team Average | 4140 | -26 | -0.57 | -17.3 | -0.38 | ||||
| Fiacre Kelleher | 3701 | -18 | -0.44 | -1.64 | 1.20 | -14.8 | -0.36 | -0.52 | 0.16 |
| David Fitzpatrick | 3581 | -25 | -0.63 | -0.16 | -0.47 | -14.0 | -0.35 | -0.53 | 0.18 |
| Michael Rose | 3427 | -18 | -0.47 | -1.01 | 0.54 | -12.5 | -0.33 | -0.61 | 0.29 |
| Kieran O Hara | 3330 | -11 | -0.30 | -1.67 | 1.37 | -13.4 | -0.36 | -0.43 | 0.07 |
| Harry Smith | 2867 | -8 | -0.25 | -1.27 | 1.02 | -8.1 | -0.26 | -0.65 | 0.39 |
| Nathan Cameron | 2250 | -5 | -0.20 | -1.00 | 0.80 | -9.1 | -0.36 | -0.39 | 0.03 |
| Callum Maycock | 1917 | -18 | -0.85 | -0.32 | -0.52 | -12.4 | -0.58 | -0.20 | -0.38 |
| Scott Wilson | 1875 | -11 | -0.53 | -0.60 | 0.07 | -8.9 | -0.43 | -0.33 | -0.09 |
| James Pearson | 1753 | -7 | -0.36 | -0.72 | 0.36 | -5.9 | -0.30 | -0.43 | 0.12 |
| Tyrone Marsh | 1652 | -9 | -0.49 | -0.61 | 0.12 | -8.8 | -0.48 | -0.31 | -0.17 |
| Ben Stephens | 1520 | -6 | -0.36 | -0.69 | 0.33 | -3.1 | -0.18 | -0.49 | 0.30 |
| Danny Whitaker | 1500 | -11 | -0.66 | -0.51 | -0.15 | -5.2 | -0.31 | -0.41 | 0.10 |
| Elliott Durrell | 1427 | -2 | -0.13 | -0.80 | 0.67 | -4.3 | -0.27 | -0.43 | 0.16 |
| Jared Hodgkiss | 1423 | -14 | -0.89 | -0.40 | -0.49 | -9.4 | -0.59 | -0.26 | -0.33 |
| Koby Arthur | 1344 | -5 | -0.33 | -0.68 | 0.34 | -8.7 | -0.59 | -0.28 | -0.31 |
| Miles Welch-Hayes | 1314 | -9 | -0.62 | -0.54 | -0.08 | -7.5 | -0.51 | -0.31 | -0.20 |
| Jamie Grimes | 1170 | -16 | -1.23 | -0.30 | -0.93 | -5.3 | -0.41 | -0.37 | -0.04 |
| Zak Jules | 1151 | -1 | -0.08 | -0.75 | 0.67 | -3.8 | -0.30 | -0.41 | 0.11 |
Mansfield Town (Actual 4th, xG 2nd)
Performance by Match
Performance by Formation
| Starting Formation | Matches | Pts p90 | xPts p90 |
| 5-3-2 | 1 | 3.0 | 2.3 |
| 3-4-2-1 | 2 | 2.0 | 1.5 |
| 3-4-3 | 4 | 2.0 | 1.4 |
| 3-5-2 | 30 | 1.6 | 1.6 |
| 3-5-1-1 | 2 | 1.5 | 1.3 |
| 3-4-1-2 | 7 | 1.4 | 1.6 |
Attacking Performance by Player
| Player | Apps | Mins | GI | G | A | xG | xGp90 |
| Tyler Walker | 44 | 3753 | 25 | 22 | 3 | 18.8 | 0.45 |
| Christopher Hamilton | 45 | 4042 | 15 | 11 | 4 | 7.3 | 0.16 |
| Jacob Mellis | 40 | 3033 | 10 | 3 | 7 | 3.5 | 0.10 |
| Danny Rose | 34 | 1601 | 7 | 4 | 3 | 6.5 | 0.37 |
| Malvind Benning | 45 | 3817 | 7 | 3 | 4 | 2.7 | 0.06 |
| Jorge Grant | 17 | 1260 | 6 | 4 | 2 | 2.5 | 0.18 |
| Otis Khan | 22 | 1238 | 6 | 2 | 4 | 2.3 | 0.16 |
| Krystian Pearce | 46 | 4140 | 4 | 4 | 3.8 | 0.08 | |
| Matt Preston | 39 | 3312 | 4 | 3 | 1 | 1.9 | 0.05 |
| Neal Bishop | 44 | 3784 | 4 | 3 | 1 | 2.2 | 0.05 |
Overall Performance by Player (P=Playing, NP=Not Playing)
| Player | Mins | GD P | GDp90 P | GDp90 NP | Diff | xGD P | xGDp90 P | xGDp90 NP | Diff |
| Team Average | 4140 | 28 | 0.61 | 16.8 | 0.37 | ||||
| Krystian Pearce | 4140 | 28 | 0.61 | 16.8 | 0.37 | ||||
| Christopher Hamilton | 4042 | 27 | 0.60 | 0.92 | -0.32 | 16.8 | 0.38 | -0.04 | 0.41 |
| Malvind Benning | 3817 | 25 | 0.59 | 0.84 | -0.25 | 12.1 | 0.28 | 1.32 | -1.04 |
| Neal Bishop | 3784 | 24 | 0.57 | 1.01 | -0.44 | 15.2 | 0.36 | 0.40 | -0.04 |
| Tyler Walker | 3753 | 26 | 0.62 | 0.47 | 0.16 | 16.5 | 0.39 | 0.08 | 0.31 |
| Matt Preston | 3312 | 23 | 0.63 | 0.54 | 0.08 | 16.7 | 0.45 | 0.02 | 0.44 |
| Ryan Sweeney | 3226 | 17 | 0.47 | 1.08 | -0.61 | 15.4 | 0.43 | 0.14 | 0.29 |
| Jacob Mellis | 3033 | 19 | 0.56 | 0.73 | -0.17 | 12.4 | 0.37 | 0.36 | 0.01 |
| Hayden White | 1795 | 14 | 0.70 | 0.54 | 0.16 | 6.2 | 0.31 | 0.41 | -0.10 |
| Danny Rose | 1601 | 16 | 0.90 | 0.43 | 0.47 | 8.4 | 0.47 | 0.30 | 0.18 |
| Conrad Logan | 1530 | 11 | 0.65 | 0.59 | 0.06 | 2.4 | 0.14 | 0.50 | -0.36 |
| Robert Olejnik | 1530 | 12 | 0.71 | 0.55 | 0.15 | 10.8 | 0.64 | 0.21 | 0.43 |
| Alexander MacDonald | 1301 | 6 | 0.42 | 0.70 | -0.28 | 2.5 | 0.17 | 0.45 | -0.28 |
| Jorge Grant | 1260 | 8 | 0.57 | 0.63 | -0.05 | 4.8 | 0.35 | 0.37 | -0.03 |
| Otis Khan | 1238 | 9 | 0.65 | 0.59 | 0.07 | 8.7 | 0.63 | 0.25 | 0.38 |
| Jordan Smith | 1080 | 5 | 0.42 | 0.68 | -0.26 | 3.6 | 0.30 | 0.39 | -0.09 |
| Gethin Jones | 1005 | 8 | 0.72 | 0.57 | 0.14 | 2.1 | 0.19 | 0.42 | -0.23 |
| Timi Max Elsnik | 1004 | 9 | 0.81 | 0.55 | 0.26 | 8.2 | 0.73 | 0.25 | 0.48 |
MK Dons (Actual 3rd, xG 6th)
Performance by Match
Performance by Formation
| Starting Formation | Matches | Pts p90 | xPts p90 |
| 3-4-2-1 | 1 | 3.0 | 0.8 |
| 5-3-2 | 4 | 2.5 | 1.4 |
| 3-4-3 | 14 | 2.1 | 1.7 |
| 3-4-1-2 | 2 | 2.0 | 1.4 |
| 4-3-3 | 12 | 1.7 | 1.6 |
| 4-2-3-1 | 2 | 1.5 | 1.1 |
| 3-5-2 | 10 | 0.9 | 1.4 |
| 3-5-1-1 | 1 | 0.0 | 0.8 |
Attacking Performance by Player
| Player | Apps | Mins | GI | G | A | xG | xGp90 |
| Kieran Agard | 42 | 3288 | 23 | 20 | 3 | 15.3 | 0.42 |
| Chuks Aneke | 38 | 2556 | 19 | 17 | 2 | 15.0 | 0.53 |
| Rhys Healey | 19 | 1435 | 11 | 8 | 3 | 6.4 | 0.40 |
| Dean Lewington | 46 | 4115 | 10 | 1 | 9 | 1.0 | 0.02 |
| Alex Gilbey | 39 | 3236 | 9 | 3 | 6 | 5.4 | 0.15 |
| David Wheeler | 18 | 987 | 5 | 4 | 1 | 4.3 | 0.39 |
| George B Williams | 31 | 2489 | 5 | 0 | 5 | 1.4 | 0.05 |
| Jake Hesketh | 16 | 1125 | 5 | 2 | 3 | 2.8 | 0.22 |
| Jordan Houghton | 44 | 3541 | 5 | 2 | 3 | 0.7 | 0.02 |
| Ryan Watson | 20 | 1191 | 4 | 0 | 4 | 1.6 | 0.12 |
Overall Performance by Player (P=Playing, NP=Not Playing)
| Player | Mins | GD P | GDp90 P | GDp90 NP | Diff | xGD P | xGDp90 P | xGDp90 NP | Diff |
| Team Average | 4140 | 22 | 0.48 | 13.0 | 0.28 | ||||
| Dean Lewington | 4115 | 23 | 0.50 | -3.60 | 4.10 | 13.0 | 0.28 | 0.18 | 0.10 |
| Lee Nicholls | 3600 | 17 | 0.43 | 0.83 | -0.41 | 11.2 | 0.28 | 0.30 | -0.02 |
| Jordan Houghton | 3541 | 18 | 0.46 | 0.60 | -0.14 | 11.0 | 0.28 | 0.30 | -0.02 |
| Kieran Agard | 3288 | 22 | 0.60 | 0.00 | 0.60 | 11.8 | 0.32 | 0.13 | 0.20 |
| Alex Gilbey | 3236 | 22 | 0.61 | 0.00 | 0.61 | 9.6 | 0.27 | 0.34 | -0.08 |
| Joe Walsh | 2596 | 18 | 0.62 | 0.23 | 0.39 | 4.3 | 0.15 | 0.51 | -0.36 |
| Chuks Aneke | 2556 | 17 | 0.60 | 0.28 | 0.31 | 7.1 | 0.25 | 0.34 | -0.09 |
| Callum Brittain | 2509 | 13 | 0.47 | 0.50 | -0.03 | 9.8 | 0.35 | 0.18 | 0.17 |
| George B Williams | 2489 | 24 | 0.87 | -0.11 | 0.98 | 11.5 | 0.41 | 0.09 | 0.33 |
| Baily Cargill | 2446 | 19 | 0.70 | 0.16 | 0.54 | 7.9 | 0.29 | 0.27 | 0.02 |
| Conor McGrandles | 2182 | 13 | 0.54 | 0.41 | 0.12 | 7.1 | 0.29 | 0.27 | 0.02 |
| Jordan Moore-Taylor | 1828 | 7 | 0.34 | 0.58 | -0.24 | 4.1 | 0.20 | 0.35 | -0.15 |
| Russell Martin | 1605 | -1 | -0.06 | 0.82 | -0.87 | 3.1 | 0.17 | 0.35 | -0.18 |
| Ousseynou Cissv© | 1569 | 2 | 0.11 | 0.70 | -0.59 | 3.1 | 0.18 | 0.35 | -0.17 |
| Rhys Healey | 1435 | 20 | 1.25 | 0.07 | 1.19 | 9.9 | 0.62 | 0.10 | 0.52 |
| Ryan Watson | 1191 | -4 | -0.30 | 0.79 | -1.10 | 1.2 | 0.09 | 0.36 | -0.27 |
| Jake Hesketh | 1125 | -2 | -0.16 | 0.72 | -0.88 | 2.4 | 0.19 | 0.32 | -0.12 |
| David Wheeler | 987 | -4 | -0.36 | 0.74 | -1.11 | 1.3 | 0.12 | 0.33 | -0.22 |
Morecambe (Actual 18th, xG 22nd)
Performance by Match
Performance by Formation
| Starting Formation | Matches | Pts p90 | xPts p90 |
| 4-4-2 (Classic) | 11 | 1.8 | 1.2 |
| 4-4-1-1 | 4 | 1.8 | 1.1 |
| 4-2-3-1 | 25 | 1.0 | 1.3 |
| 4-3-3 | 3 | 0.7 | 1.1 |
| 3-5-2 | 2 | 0.5 | 0.7 |
| 3-4-1-2 | 1 | 0.0 | 1.0 |
Attacking Performance by Player
| Player | Apps | Mins | GI | G | A | xG | xGp90 |
| Aaron Collins | 15 | 1064 | 11 | 8 | 3 | 3.9 | 0.33 |
| Liam Mandeville | 42 | 2560 | 11 | 3 | 8 | 3.0 | 0.11 |
| Kevin Ellison | 43 | 2437 | 9 | 7 | 2 | 5.7 | 0.21 |
| Rhys Oates | 31 | 1860 | 9 | 6 | 3 | 5.3 | 0.25 |
| A-Jay Leitch-Smith | 25 | 1898 | 7 | 6 | 1 | 5.1 | 0.24 |
| Jordan Cranston | 35 | 2679 | 7 | 4 | 3 | 3.5 | 0.12 |
| Richard Bennett | 16 | 1139 | 7 | 5 | 2 | 3.2 | 0.25 |
| Andrew Tutte | 18 | 1025 | 6 | 2 | 4 | 1.3 | 0.12 |
| Steven Old | 38 | 3321 | 5 | 2 | 3 | 2.0 | 0.05 |
| Vadaine Oliver | 30 | 1990 | 5 | 4 | 1 | 4.1 | 0.19 |
Overall Performance by Player (P=Playing, NP=Not Playing)
| Player | Mins | GD P | GDp90 P | GDp90 NP | Diff | xGD P | xGDp90 P | xGDp90 NP | Diff |
| Team Average | 4140 | -16 | -0.35 | -14.9 | -0.32 | ||||
| Luke Conlan | 3553 | -6 | -0.15 | -1.53 | 1.38 | -13.5 | -0.34 | -0.21 | -0.13 |
| Zak Mills | 3420 | -16 | -0.42 | 0.00 | -0.42 | -14.7 | -0.39 | -0.04 | -0.35 |
| Steven Old | 3321 | -15 | -0.41 | -0.11 | -0.30 | -10.1 | -0.27 | -0.54 | 0.26 |
| Sam Lavelle | 2724 | -5 | -0.17 | -0.70 | 0.53 | -10.7 | -0.35 | -0.27 | -0.08 |
| Jordan Cranston | 2679 | -20 | -0.67 | 0.25 | -0.92 | -11.6 | -0.39 | -0.20 | -0.19 |
| Liam Mandeville | 2560 | -15 | -0.53 | -0.06 | -0.47 | -10.1 | -0.35 | -0.28 | -0.08 |
| Kevin Ellison | 2437 | -17 | -0.63 | 0.05 | -0.68 | -5.2 | -0.19 | -0.51 | 0.32 |
| Mark Halstead | 2340 | -6 | -0.23 | -0.50 | 0.27 | -8.6 | -0.33 | -0.32 | -0.01 |
| Aaron Wildig | 2101 | 0 | 0.00 | -0.71 | 0.71 | -5.1 | -0.22 | -0.44 | 0.22 |
| Alex Kenyon | 2043 | -11 | -0.48 | -0.21 | -0.27 | -5.2 | -0.23 | -0.42 | 0.19 |
| Vadaine Oliver | 1990 | -8 | -0.36 | -0.33 | -0.03 | -5.6 | -0.25 | -0.39 | 0.14 |
| A-Jay Leitch-Smith | 1898 | -8 | -0.38 | -0.32 | -0.06 | -9.0 | -0.43 | -0.24 | -0.19 |
| Rhys Oates | 1860 | -4 | -0.19 | -0.47 | 0.28 | -6.0 | -0.29 | -0.35 | 0.06 |
| Josef Yarney | 1816 | -9 | -0.45 | -0.27 | -0.17 | -5.8 | -0.29 | -0.35 | 0.07 |
| Barry Roche | 1800 | -10 | -0.50 | -0.23 | -0.27 | -6.4 | -0.32 | -0.33 | 0.01 |
| Andrew Fleming | 1431 | -13 | -0.82 | -0.10 | -0.72 | -5.2 | -0.33 | -0.32 | 0.00 |
| Piero Mingoia | 1281 | -1 | -0.07 | -0.47 | 0.40 | -4.2 | -0.29 | -0.34 | 0.05 |
| Ritchie Sutton | 1215 | 2 | 0.15 | -0.55 | 0.70 | -5.9 | -0.43 | -0.28 | -0.15 |
Newport County (Actual 7th, xG 7th)
Performance by Match
Performance by Formation
| Starting Formation | Matches | Pts p90 | xPts p90 |
| 3-4-1-2 | 12 | 2.3 | 1.5 |
| 4-4-2 (Classic) | 2 | 2.0 | 1.2 |
| 5-3-2 | 2 | 1.5 | 0.7 |
| 3-4-3 | 2 | 1.5 | 1.4 |
| 3-5-2 | 18 | 1.3 | 1.5 |
| 4-3-3 | 8 | 1.1 | 1.8 |
| 4-1-3-2 | 1 | 0.0 | 1.4 |
| 4-2-3-1 | 1 | 0.0 | 0.7 |
Attacking Performance by Player
| Player | Apps | Mins | GI | G | A | xG | xGp90 |
| Padraig Amond | 45 | 3843 | 22 | 14 | 8 | 15.3 | 0.36 |
| Jamille Matt | 41 | 3062 | 18 | 14 | 4 | 8.8 | 0.26 |
| Dan Butler | 45 | 4050 | 9 | 3 | 6 | 2.7 | 0.06 |
| Robbie Willmott | 31 | 2627 | 8 | 2 | 6 | 2.9 | 0.10 |
| Tyreeq Bakinson | 29 | 2303 | 7 | 1 | 6 | 3.3 | 0.13 |
| Antoine Semenyo | 21 | 1303 | 5 | 3 | 2 | 3.5 | 0.24 |
| Matthew Dolan | 31 | 2052 | 5 | 2 | 3 | 2.0 | 0.09 |
| Mickey Demetriou | 45 | 4050 | 5 | 4 | 1 | 5.5 | 0.12 |
| Ben Kennedy | 10 | 622 | 3 | 1 | 2 | 0.9 | 0.12 |
| Fraser Franks | 25 | 2235 | 3 | 3 | 1.7 | 0.07 |
Overall Performance by Player (P=Playing, NP=Not Playing)
| Player | Mins | GD P | GDp90 P | GDp90 NP | Diff | xGD P | xGDp90 P | xGDp90 NP | Diff |
| Team Average | 4140 | 0 | 0.00 | 7.7 | 0.17 | ||||
| Dan Butler | 4050 | 3 | 0.07 | -3.00 | 3.07 | 7.8 | 0.17 | -0.08 | 0.26 |
| Mickey Demetriou | 4050 | 1 | 0.02 | -1.00 | 1.02 | 7.0 | 0.16 | 0.66 | -0.51 |
| Joe Day | 3870 | 1 | 0.02 | -0.33 | 0.36 | 6.1 | 0.14 | 0.54 | -0.39 |
| Padraig Amond | 3843 | 2 | 0.05 | -0.61 | 0.65 | 9.0 | 0.21 | -0.38 | 0.59 |
| Scot Bennett | 3223 | -1 | -0.03 | 0.10 | -0.13 | 6.5 | 0.18 | 0.12 | 0.06 |
| Jamille Matt | 3062 | 0 | 0.00 | 0.00 | 0.00 | 3.6 | 0.11 | 0.34 | -0.24 |
| Robbie Willmott | 2627 | 1 | 0.03 | -0.06 | 0.09 | 3.5 | 0.12 | 0.25 | -0.13 |
| Tyreeq Bakinson | 2303 | -5 | -0.20 | 0.24 | -0.44 | 4.8 | 0.19 | 0.14 | 0.05 |
| Mark O Brien | 2277 | 14 | 0.55 | -0.68 | 1.23 | 2.6 | 0.10 | 0.25 | -0.15 |
| Fraser Franks | 2235 | -4 | -0.16 | 0.19 | -0.35 | 6.5 | 0.26 | 0.06 | 0.20 |
| Matthew Dolan | 2052 | -5 | -0.22 | 0.22 | -0.43 | 5.1 | 0.22 | 0.11 | 0.11 |
| Josh Sheehan | 1888 | 5 | 0.24 | -0.20 | 0.44 | 2.3 | 0.11 | 0.21 | -0.10 |
| Regan Poole | 1784 | 7 | 0.35 | -0.27 | 0.62 | 1.8 | 0.09 | 0.23 | -0.13 |
| David Pipe | 1343 | -8 | -0.54 | 0.26 | -0.79 | 0.1 | 0.01 | 0.24 | -0.23 |
| Antoine Semenyo | 1303 | 3 | 0.21 | -0.10 | 0.30 | 6.2 | 0.43 | 0.05 | 0.38 |
| Tyler Hornby-Forbes | 1174 | 0 | 0.00 | 0.00 | 0.00 | 4.9 | 0.38 | 0.08 | 0.29 |
| Joss Labadie | 788 | -2 | -0.23 | 0.05 | -0.28 | -1.7 | -0.19 | 0.25 | -0.44 |
| Ben Kennedy | 622 | 2 | 0.29 | -0.05 | 0.34 | 0.0 | 0.00 | 0.20 | -0.20 |
Northampton Town (Actual 15th, xG 3rd)
Performance by Match
Performance by Formation
| Starting Formation | Matches | Pts p90 | xPts p90 |
| 4-5-1 | 2 | 2.0 | 1.9 |
| 3-5-2 | 15 | 1.8 | 1.6 |
| 5-3-2 | 2 | 1.5 | 0.8 |
| 3-4-3 | 3 | 1.3 | 1.5 |
| 4-4-2 (Classic) | 14 | 1.2 | 1.6 |
| 3-4-2-1 | 1 | 1.0 | 1.6 |
| 4-2-3-1 | 3 | 0.7 | 1.5 |
| 3-4-1-2 | 2 | 0.5 | 1.0 |
| 4-3-3 | 4 | 0.5 | 1.4 |
Performance by Manager
| Managerial Record | Matches | Pts p90 | Rank | xPts p90 | Rank |
| Dean Austin | 10 | 0.7 | 24th | 1.5 | 3rd |
| Keith Curle | 36 | 1.5 | 11th | 1.5 | 3rd |
Attacking Performance by Player
| Player | Apps | Mins | GI | G | A | xG | xGp90 |
| Andy Williams | 38 | 2387 | 15 | 12 | 3 | 10.0 | 0.38 |
| Daniel Powell | 34 | 1702 | 11 | 6 | 5 | 4.7 | 0.25 |
| Kevin van Veen | 25 | 1801 | 11 | 7 | 4 | 8.5 | 0.43 |
| Sam Hoskins | 42 | 3570 | 11 | 5 | 6 | 9.3 | 0.23 |
| Aaron Pierre | 41 | 3690 | 7 | 6 | 1 | 3.7 | 0.09 |
| Jack Bridge | 27 | 1610 | 7 | 2 | 5 | 2.1 | 0.12 |
| Junior Morias | 18 | 644 | 6 | 6 | 3.6 | 0.51 | |
| Sam Foley | 36 | 2910 | 6 | 2 | 4 | 2.5 | 0.08 |
| Matt Crooks | 21 | 1629 | 5 | 5 | 4.7 | 0.26 | |
| Dean Bowditch | 19 | 900 | 4 | 3 | 1 | 2.0 | 0.20 |
Overall Performance by Player (P=Playing, NP=Not Playing)
| Player | Mins | GD P | GDp90 P | GDp90 NP | Diff | xGD P | xGDp90 P | xGDp90 NP | Diff |
| Team Average | 4140 | 1 | 0.02 | 12.5 | 0.27 | ||||
| David Cornell | 4140 | 1 | 0.02 | 12.5 | 0.27 | ||||
| Aaron Pierre | 3690 | 9 | 0.22 | -1.60 | 1.82 | 14.4 | 0.35 | -0.39 | 0.74 |
| Sam Hoskins | 3570 | -1 | -0.03 | 0.32 | -0.34 | 9.9 | 0.25 | 0.41 | -0.16 |
| David Buchanan | 3323 | -3 | -0.08 | 0.44 | -0.52 | 10.8 | 0.29 | 0.19 | 0.11 |
| Sam Foley | 2910 | 4 | 0.12 | -0.22 | 0.34 | 10.2 | 0.31 | 0.17 | 0.15 |
| Ash Taylor | 2880 | -10 | -0.31 | 0.79 | -1.10 | 9.6 | 0.30 | 0.21 | 0.09 |
| Jordan Turnbull | 2604 | 17 | 0.59 | -0.94 | 1.53 | 7.6 | 0.26 | 0.29 | -0.02 |
| Andy Williams | 2387 | -3 | -0.11 | 0.21 | -0.32 | 6.8 | 0.26 | 0.29 | -0.04 |
| John-Joe O Toole | 2097 | -2 | -0.09 | 0.13 | -0.22 | 8.7 | 0.37 | 0.17 | 0.21 |
| Shay Facey | 1882 | -4 | -0.19 | 0.20 | -0.39 | 1.1 | 0.05 | 0.45 | -0.40 |
| Kevin van Veen | 1801 | -4 | -0.20 | 0.19 | -0.39 | 6.5 | 0.32 | 0.23 | 0.09 |
| Shaun McWilliams | 1742 | 7 | 0.36 | -0.23 | 0.59 | 5.9 | 0.31 | 0.25 | 0.06 |
| Daniel Powell | 1702 | 13 | 0.69 | -0.44 | 1.13 | 9.0 | 0.48 | 0.13 | 0.35 |
| Matt Crooks | 1629 | -2 | -0.11 | 0.11 | -0.22 | 8.3 | 0.46 | 0.15 | 0.31 |
| Jack Bridge | 1610 | 2 | 0.11 | -0.04 | 0.15 | 2.6 | 0.14 | 0.35 | -0.21 |
| Charlie Goode | 1530 | 2 | 0.12 | -0.03 | 0.15 | 4.0 | 0.24 | 0.29 | -0.06 |
| Dean Bowditch | 900 | -5 | -0.50 | 0.17 | -0.67 | 2.3 | 0.23 | 0.28 | -0.05 |
| Hakeem Odoffin | 898 | -9 | -0.90 | 0.28 | -1.18 | 2.2 | 0.22 | 0.29 | -0.07 |
Notts County (Actual 23rd, xG 19th)
Performance by Match
Performance by Formation
| Starting Formation | Matches | Pts p90 | xPts p90 |
| 4-5-1 | 1 | 3.0 | 1.9 |
| 5-3-2 | 1 | 3.0 | 1.8 |
| 4-2-3-1 | 5 | 1.6 | 1.5 |
| 4-4-2 (Classic) | 16 | 0.9 | 1.1 |
| 4-3-3 | 11 | 0.8 | 1.2 |
| 3-5-1-1 | 3 | 0.7 | 1.3 |
| 4-4-1-1 | 2 | 0.5 | 0.5 |
| 3-5-2 | 6 | 0.2 | 1.3 |
| 4-3-2-1 | 1 | 0.0 | 2.1 |
Performance by Manager
| Managerial Record | Matches | Pts p90 | Rank | xPts p90 | Rank |
| Kevin Nolan | 5 | 0.2 | 24th | 1.2 | 22nd |
| Harry Kewell | 12 | 1.1 | 20th | 1.2 | 22nd |
| Stephen Chettle | 1 | 0.0 | 1.6 | ||
| Neal Ardley | 28 | 1.0 | 22nd | 1.3 | 18th |
Attacking Performance by Player
| Player | Apps | Mins | GI | G | A | xG | xGp90 |
| Kane Hemmings | 36 | 2703 | 16 | 14 | 2 | 11.4 | 0.38 |
| Jon Stead | 38 | 2701 | 11 | 8 | 3 | 8.7 | 0.29 |
| Enzio Boldewijn | 36 | 2827 | 7 | 5 | 2 | 4.6 | 0.15 |
| Lewis Alessandra | 25 | 1495 | 5 | 2 | 3 | 1.7 | 0.10 |
| Elliott Hewitt | 25 | 2016 | 4 | 2 | 2 | 1.6 | 0.07 |
| Craig Mackail-Smith | 16 | 1018 | 3 | 3 | 1.2 | 0.11 | |
| Jim O Brien | 18 | 1612 | 3 | 2 | 1 | 1.6 | 0.09 |
| Kristian Dennis | 22 | 1118 | 3 | 3 | 2.3 | 0.19 | |
| Andy Kellett | 10 | 457 | 2 | 1 | 1 | 0.3 | 0.06 |
| Cedric Evina | 17 | 1349 | 2 | 0 | 2 | 0.3 | 0.02 |
Overall Performance by Player (P=Playing, NP=Not Playing)
| Player | Mins | GD P | GDp90 P | GDp90 NP | Diff | xGD P | xGDp90 P | xGDp90 NP | Diff |
| Team Average | 4140 | -36 | -0.78 | -11.4 | -0.25 | ||||
| Robert Milsom | 3382 | -23 | -0.61 | -1.54 | 0.93 | -6.3 | -0.17 | -0.61 | 0.45 |
| Enzio Boldewijn | 2827 | -26 | -0.83 | -0.69 | -0.14 | -9.3 | -0.30 | -0.14 | -0.15 |
| Kane Hemmings | 2703 | -21 | -0.70 | -0.94 | 0.24 | -5.0 | -0.17 | -0.40 | 0.23 |
| Jon Stead | 2701 | -24 | -0.80 | -0.75 | -0.05 | -5.9 | -0.20 | -0.35 | 0.15 |
| Ross Fitzsimons | 2561 | -29 | -1.02 | -0.40 | -0.62 | -9.7 | -0.34 | -0.10 | -0.24 |
| Elliott Hewitt | 2016 | -22 | -0.98 | -0.59 | -0.39 | -9.0 | -0.40 | -0.10 | -0.30 |
| Matt Tootle | 1886 | -6 | -0.29 | -1.20 | 0.91 | -2.9 | -0.14 | -0.34 | 0.20 |
| Jim O Brien | 1612 | -8 | -0.45 | -1.00 | 0.55 | -2.0 | -0.11 | -0.34 | 0.23 |
| David Vaughan | 1537 | -23 | -1.35 | -0.45 | -0.90 | -5.8 | -0.34 | -0.20 | -0.14 |
| Michael Doyle | 1530 | -6 | -0.35 | -1.03 | 0.68 | -2.6 | -0.15 | -0.30 | 0.15 |
| Ryan Schofield | 1530 | -4 | -0.24 | -1.10 | 0.87 | -1.5 | -0.09 | -0.34 | 0.26 |
| Sam Stubbs | 1530 | -6 | -0.35 | -1.03 | 0.68 | -2.6 | -0.15 | -0.30 | 0.15 |
| Jamie Turley | 1516 | -12 | -0.71 | -0.82 | 0.11 | -5.4 | -0.32 | -0.21 | -0.12 |
| Lewis Alessandra | 1495 | -11 | -0.66 | -0.85 | 0.19 | -2.7 | -0.16 | -0.30 | 0.13 |
| Richard Duffy | 1477 | -11 | -0.67 | -0.84 | 0.17 | 0.1 | 0.00 | -0.39 | 0.39 |
| Elliott Ward | 1474 | -11 | -0.67 | -0.84 | 0.17 | -7.3 | -0.44 | -0.14 | -0.30 |
| Mitch Rose | 1474 | -5 | -0.31 | -1.05 | 0.74 | -3.2 | -0.20 | -0.28 | 0.08 |
| Shaun Brisley | 1430 | -20 | -1.26 | -0.53 | -0.73 | -2.4 | -0.15 | -0.30 | 0.15 |
Oldham Athletic (Actual 14th, xG 16th)
Performance by Match
Performance by Formation
| Starting Formation | Matches | Pts p90 | xPts p90 |
| 4-3-3 | 2 | 3.0 | 1.4 |
| 4-4-2 (Classic) | 25 | 1.8 | 1.4 |
| 4-3-1-2 | 4 | 1.0 | 1.7 |
| 4-4-1-1 | 9 | 0.7 | 1.0 |
| 4-5-1 | 2 | 0.5 | 1.1 |
| 4-2-3-1 | 3 | 0.3 | 1.1 |
| 5-3-2 | 1 | 0.0 | 1.0 |
Performance by Manager
| Managerial Record | Matches | Pts p90 | Rank | xPts p90 | Rank |
| Frankie Bunn | 24 | 1.3 | 14th | 1.4 | 10th |
| Pete Wild (1) | 6 | 1.7 | 4th | 1.3 | 15th |
| Paul Scholes | 7 | 0.9 | 24th | 0.9 | 24th |
| Pete Wild (2) | 9 | 1.6 | 7th | 1.2 | 22nd |
Attacking Performance by Player
| Player | Apps | Mins | GI | G | A | xG | xGp90 |
| Callum Lang | 41 | 3264 | 15 | 13 | 2 | 7.9 | 0.22 |
| Gevaro Nepomuceno | 41 | 3344 | 15 | 6 | 9 | 4.0 | 0.11 |
| Johan Branger | 34 | 2457 | 12 | 5 | 7 | 3.1 | 0.11 |
| Sam Surridge | 15 | 1030 | 10 | 8 | 2 | 4.9 | 0.43 |
| Chris O Grady | 38 | 2341 | 9 | 7 | 2 | 3.0 | 0.12 |
| Dan Gardner | 20 | 1663 | 6 | 2 | 4 | 2.5 | 0.14 |
| Mohammed Maouche | 35 | 2526 | 6 | 4 | 2 | 2.4 | 0.08 |
| Jose Baxter | 29 | 1386 | 5 | 4 | 1 | 3.4 | 0.22 |
| George Edmundson | 45 | 4015 | 4 | 2 | 2 | 2.0 | 0.05 |
| Ishmael Miller | 16 | 880 | 4 | 3 | 1 | 2.7 | 0.27 |
Overall Performance by Player (P=Playing, NP=Not Playing)
| Player | Mins | GD P | GDp90 P | GDp90 NP | Diff | xGD P | xGDp90 P | xGDp90 NP | Diff |
| Team Average | 4140 | 7 | 0.15 | -7.5 | -0.16 | ||||
| George Edmundson | 4015 | 11 | 0.25 | -2.88 | 3.13 | -6.3 | -0.14 | -0.86 | 0.71 |
| Daniel Iversen | 3780 | 9 | 0.21 | -0.50 | 0.71 | -6.3 | -0.15 | -0.30 | 0.15 |
| Peter Clarke | 3732 | 14 | 0.34 | -1.54 | 1.88 | -3.8 | -0.09 | -0.82 | 0.73 |
| Christopher Missilou | 3434 | 0 | 0.00 | 0.89 | -0.89 | -8.5 | -0.22 | 0.13 | -0.36 |
| Gevaro Nepomuceno | 3344 | 9 | 0.24 | -0.23 | 0.47 | -5.0 | -0.13 | -0.28 | 0.15 |
| Callum Lang | 3264 | 4 | 0.11 | 0.31 | -0.20 | -5.1 | -0.14 | -0.25 | 0.11 |
| Rob Hunt | 3090 | -2 | -0.06 | 0.77 | -0.83 | -5.0 | -0.15 | -0.21 | 0.07 |
| Mohammed Maouche | 2526 | 5 | 0.18 | 0.11 | 0.07 | -10.5 | -0.37 | 0.17 | -0.54 |
| Johan Branger | 2457 | 12 | 0.44 | -0.27 | 0.71 | -5.2 | -0.19 | -0.12 | -0.07 |
| Thomas Haymer | 2348 | 5 | 0.19 | 0.10 | 0.09 | -6.6 | -0.25 | -0.05 | -0.20 |
| Chris O Grady | 2341 | 9 | 0.35 | -0.10 | 0.45 | -6.7 | -0.26 | -0.04 | -0.22 |
| Dan Gardner | 1663 | 3 | 0.16 | 0.15 | 0.02 | 1.9 | 0.10 | -0.34 | 0.44 |
| Jose Baxter | 1386 | 5 | 0.32 | 0.07 | 0.26 | -3.0 | -0.19 | -0.15 | -0.05 |
| Andy Taylor | 1274 | 0 | 0.00 | 0.22 | -0.22 | 0.9 | 0.06 | -0.26 | 0.32 |
| Sam Surridge | 1030 | -2 | -0.17 | 0.26 | -0.44 | -0.6 | -0.06 | -0.20 | 0.14 |
| Ishmael Miller | 880 | 3 | 0.31 | 0.11 | 0.20 | 1.9 | 0.19 | -0.26 | 0.45 |
| Alex Iacovitti | 810 | 1 | 0.11 | 0.16 | -0.05 | -3.4 | -0.37 | -0.11 | -0.26 |
| Mohamad Sylla | 680 | -2 | -0.26 | 0.23 | -0.50 | -2.2 | -0.29 | -0.14 | -0.15 |
Port Vale (Actual 20th, xG 11th)
Performance by Match
Performance by Formation
| Starting Formation | Matches | Pts p90 | xPts p90 |
| 5-4-1 | 2 | 2.0 | 1.1 |
| 4-5-1 | 3 | 1.7 | 1.6 |
| 4-3-3 | 9 | 1.6 | 1.4 |
| 3-4-2-1 | 2 | 1.5 | 1.4 |
| 4-4-2 (Classic) | 13 | 1.2 | 1.4 |
| 4-1-4-1 | 2 | 1.0 | 1.3 |
| 4-1-3-2 | 1 | 1.0 | 1.4 |
| 3-4-3 | 4 | 1.0 | 1.2 |
| 4-2-3-1 | 3 | 0.3 | 0.9 |
| 3-5-2 | 2 | 0.0 | 1.4 |
| 5-3-2 | 1 | 0.0 | 1.6 |
| 4-4-1-1 | 3 | 0.0 | 1.5 |
| 4-1-2-1-2 (Diamond Formation) | 1 | 0.0 | 1.8 |
Performance by Manager
| Managerial Record | Matches | Pts p90 | Rank | xPts p90 | Rank |
| Neil Aspin | 30 | 1.1 | 20th | 1.4 | 11th |
| John Askey | 16 | 1.0 | 21st | 1.4 | 11th |
Attacking Performance by Player
| Player | Apps | Mins | GI | G | A | xG | xGp90 |
| Tom Pope | 38 | 3086 | 13 | 11 | 2 | 12.6 | 0.37 |
| Cristian Montav±o | 29 | 1659 | 7 | 5 | 2 | 3.5 | 0.19 |
| Luke Hannant | 45 | 3671 | 7 | 3 | 4 | 5.7 | 0.14 |
| Manny Oyeleke | 28 | 2254 | 6 | 3 | 3 | 2.4 | 0.10 |
| Tom Conlon | 34 | 2565 | 6 | 3 | 3 | 3.2 | 0.11 |
| Ben Whitfield | 29 | 1525 | 5 | 4 | 1 | 5.4 | 0.32 |
| Ricky Miller | 28 | 1681 | 5 | 4 | 1 | 6.7 | 0.36 |
| Antony Kay | 26 | 1938 | 4 | 2 | 2 | 1.7 | 0.08 |
| David Worrall | 25 | 1731 | 2 | 1 | 1 | 2.5 | 0.13 |
| Adam Crookes | 19 | 1710 | 1 | 0 | 1 | 0.3 | 0.02 |
Overall Performance by Player (P=Playing, NP=Not Playing)
| Player | Mins | GD P | GDp90 P | GDp90 NP | Diff | xGD P | xGDp90 P | xGDp90 NP | Diff |
| Team Average | 4140 | -16 | -0.35 | 0.7 | 0.02 | ||||
| Scott Brown | 4140 | -16 | -0.35 | 0.7 | 0.02 | ||||
| Nathan Smith | 3948 | -16 | -0.36 | 0.00 | -0.36 | 0.4 | 0.01 | 0.15 | -0.15 |
| Luke Hannant | 3671 | -14 | -0.34 | -0.38 | 0.04 | 0.2 | 0.00 | 0.10 | -0.10 |
| Mitchell Clark | 3356 | -17 | -0.46 | 0.11 | -0.57 | -0.8 | -0.02 | 0.17 | -0.20 |
| Leon Legge | 3086 | -13 | -0.38 | -0.26 | -0.12 | -1.5 | -0.04 | 0.19 | -0.24 |
| Tom Pope | 3086 | -13 | -0.38 | -0.26 | -0.12 | 3.0 | 0.09 | -0.20 | 0.29 |
| Luke Joyce | 2790 | -7 | -0.23 | -0.60 | 0.37 | -0.5 | -0.02 | 0.08 | -0.10 |
| Tom Conlon | 2565 | -7 | -0.25 | -0.51 | 0.27 | 3.2 | 0.11 | -0.14 | 0.26 |
| Connell Rawlinson | 2492 | -6 | -0.22 | -0.55 | 0.33 | -0.6 | -0.02 | 0.07 | -0.10 |
| Manny Oyeleke | 2254 | 0 | 0.00 | -0.76 | 0.76 | 4.1 | 0.16 | -0.16 | 0.32 |
| Antony Kay | 1938 | -12 | -0.56 | -0.16 | -0.39 | -1.8 | -0.08 | 0.10 | -0.19 |
| David Worrall | 1731 | -6 | -0.31 | -0.37 | 0.06 | 0.7 | 0.04 | 0.00 | 0.03 |
| Adam Crookes | 1710 | -6 | -0.32 | -0.37 | 0.05 | 0.9 | 0.05 | -0.01 | 0.05 |
| Ricky Miller | 1681 | 1 | 0.05 | -0.62 | 0.68 | 2.2 | 0.12 | -0.05 | 0.17 |
| Cristian Montav±o | 1659 | -7 | -0.38 | -0.33 | -0.05 | -3.3 | -0.18 | 0.15 | -0.33 |
| Ben Whitfield | 1525 | -16 | -0.94 | 0.00 | -0.94 | 2.8 | 0.16 | -0.07 | 0.24 |
| James Gibbons | 1156 | -5 | -0.39 | -0.33 | -0.06 | 0.9 | 0.07 | -0.01 | 0.08 |
| Theo Vassell | 1084 | 0 | 0.00 | -0.47 | 0.47 | 1.9 | 0.16 | -0.04 | 0.19 |
Stevenage (Actual 10th, xG 20th)
Performance by Match
Performance by Formation
| Starting Formation | Matches | Pts p90 | xPts p90 |
| 3-4-3 (Diamond Formation) | 1 | 3.0 | 1.3 |
| 3-4-3 | 3 | 3.0 | 1.8 |
| 4-1-3-2 | 1 | 3.0 | 1.8 |
| 4-3-2-1 | 1 | 3.0 | 1.3 |
| 3-4-1-2 | 1 | 3.0 | 1.3 |
| 4-4-2 (Classic) | 22 | 1.6 | 1.2 |
| 4-1-2-1-2 (Diamond Formation) | 2 | 1.0 | 1.0 |
| 4-5-1 | 1 | 1.0 | 1.4 |
| 4-2-3-1 | 1 | 1.0 | 1.3 |
| 4-3-3 | 10 | 0.9 | 1.2 |
| 5-3-2 | 2 | 0.5 | 1.1 |
| 3-5-2 | 1 | 0.0 | 0.7 |
Attacking Performance by Player
| Player | Apps | Mins | GI | G | A | xG | xGp90 |
| Kurtis Guthrie | 34 | 2425 | 15 | 11 | 4 | 7.6 | 0.28 |
| Alex Revell | 40 | 3077 | 12 | 7 | 5 | 5.8 | 0.17 |
| Ilias Chair | 16 | 1393 | 12 | 6 | 6 | 4.9 | 0.32 |
| Joel Byrom | 45 | 3628 | 9 | 2 | 7 | 1.0 | 0.03 |
| Danny Newton | 25 | 1575 | 8 | 6 | 2 | 5.4 | 0.31 |
| Ben Kennedy | 25 | 1852 | 7 | 6 | 1 | 4.2 | 0.21 |
| Steve Seddon | 23 | 1948 | 6 | 3 | 3 | 2.6 | 0.12 |
| Jimmy Ball | 16 | 819 | 4 | 3 | 1 | 2.2 | 0.24 |
| Luther Wildin | 39 | 3497 | 4 | 1 | 3 | 0.8 | 0.02 |
| Scott Cuthbert | 46 | 4068 | 4 | 2 | 2 | 3.2 | 0.07 |
Overall Performance by Player (P=Playing, NP=Not Playing)
| Player | Mins | GD P | GDp90 P | GDp90 NP | Diff | xGD P | xGDp90 P | xGDp90 NP | Diff |
| Team Average | 4140 | 4 | 0.09 | -11.0 | -0.24 | ||||
| Scott Cuthbert | 4068 | 4 | 0.09 | 0.00 | 0.09 | -10.1 | -0.22 | -1.09 | 0.86 |
| Joel Byrom | 3628 | -4 | -0.10 | 1.41 | -1.51 | -10.7 | -0.26 | -0.05 | -0.21 |
| Michael Timlin | 3537 | 10 | 0.25 | -0.90 | 1.15 | -7.5 | -0.19 | -0.53 | 0.34 |
| Luther Wildin | 3497 | 4 | 0.10 | 0.00 | 0.10 | -7.7 | -0.20 | -0.46 | 0.26 |
| Alex Revell | 3077 | -14 | -0.41 | 1.52 | -1.93 | -11.2 | -0.33 | 0.02 | -0.35 |
| Paul Farman | 2970 | 5 | 0.15 | -0.08 | 0.23 | -7.5 | -0.23 | -0.27 | 0.04 |
| Ben Nugent | 2956 | 14 | 0.43 | -0.76 | 1.19 | -5.5 | -0.17 | -0.42 | 0.25 |
| Kurtis Guthrie | 2425 | 12 | 0.45 | -0.42 | 0.87 | -3.8 | -0.14 | -0.38 | 0.24 |
| Johnny Hunt | 2283 | -10 | -0.39 | 0.68 | -1.07 | -7.6 | -0.30 | -0.16 | -0.14 |
| Steve Seddon | 1948 | -4 | -0.18 | 0.33 | -0.51 | -9.9 | -0.46 | -0.05 | -0.41 |
| Ben Kennedy | 1852 | -6 | -0.29 | 0.39 | -0.68 | -8.1 | -0.40 | -0.11 | -0.28 |
| Danny Newton | 1575 | 1 | 0.06 | 0.11 | -0.05 | -4.4 | -0.25 | -0.23 | -0.02 |
| Ilias Chair | 1393 | 8 | 0.52 | -0.13 | 0.65 | -0.5 | -0.03 | -0.34 | 0.31 |
| Emmanuel Sonupe | 1249 | 17 | 1.22 | -0.40 | 1.63 | 6.5 | 0.47 | -0.54 | 1.01 |
| Seny Timothy Dieng | 1170 | -1 | -0.08 | 0.15 | -0.23 | -3.5 | -0.27 | -0.23 | -0.04 |
| Arthur Iontton | 1052 | -1 | -0.09 | 0.15 | -0.23 | -4.8 | -0.41 | -0.18 | -0.23 |
| Ronnie Henry | 982 | -7 | -0.64 | 0.31 | -0.96 | -5.4 | -0.50 | -0.16 | -0.34 |
| Moses Makasi | 924 | -3 | -0.29 | 0.20 | -0.49 | -1.4 | -0.14 | -0.27 | 0.13 |
Swindon Town (Actual 13th, xG 8th)
Performance by Match
Performance by Formation
| Starting Formation | Matches | Pts p90 | xPts p90 |
| 3-4-3 | 1 | 3.0 | 2.4 |
| 4-2-3-1 | 4 | 2.0 | 1.6 |
| 4-3-3 | 24 | 1.6 | 1.5 |
| 4-5-1 | 5 | 1.4 | 1.2 |
| 4-4-2 (Classic) | 8 | 0.9 | 1.4 |
| 3-5-2 | 4 | 0.3 | 1.2 |
Performance by Manager
| Managerial Record | Matches | Pts p90 | Rank | xPts p90 | Rank |
| Phil Brown | 17 | 1.2 | 16th | 1.3 | 17th |
| Richie Wellens | 29 | 1.5 | 11th | 1.6 | 2nd |
Attacking Performance by Player
| Player | Apps | Mins | GI | G | A | xG | xGp90 |
| Michael Doughty | 30 | 2212 | 17 | 13 | 4 | 8.8 | 0.36 |
| Kaiyne Woolery | 28 | 2152 | 8 | 6 | 2 | 5.0 | 0.21 |
| Theo Robinson | 15 | 1278 | 8 | 7 | 1 | 5.0 | 0.35 |
| Elijah Adebayo | 24 | 1737 | 6 | 5 | 1 | 4.9 | 0.25 |
| Keshi Anderson | 43 | 3256 | 6 | 4 | 2 | 7.8 | 0.22 |
| Steven Alzate | 22 | 1451 | 6 | 2 | 4 | 1.1 | 0.07 |
| Marc Richards | 30 | 1535 | 5 | 4 | 1 | 4.2 | 0.24 |
| Kyle Bennett | 15 | 1261 | 4 | 4 | 2.3 | 0.17 | |
| Canice Carroll | 17 | 1373 | 3 | 1 | 2 | 0.3 | 0.02 |
| Matthew Taylor | 33 | 2519 | 3 | 3 | 4.8 | 0.17 |
Overall Performance by Player (P=Playing, NP=Not Playing)
| Player | Mins | GD P | GDp90 P | GDp90 NP | Diff | xGD P | xGDp90 P | xGDp90 NP | Diff |
| Team Average | 4140 | 3 | 0.07 | 6.1 | 0.13 | ||||
| Kyle Knoyle | 3392 | 2 | 0.05 | 0.12 | -0.07 | 5.6 | 0.15 | 0.06 | 0.08 |
| Keshi Anderson | 3256 | 7 | 0.19 | -0.41 | 0.60 | 10.9 | 0.30 | -0.49 | 0.79 |
| Luke Woolfenden | 2935 | 2 | 0.06 | 0.07 | -0.01 | 4.9 | 0.15 | 0.09 | 0.06 |
| Lawrence Vigouroux | 2610 | -3 | -0.10 | 0.35 | -0.46 | 5.3 | 0.18 | 0.05 | 0.13 |
| Matthew Taylor | 2519 | -7 | -0.25 | 0.56 | -0.81 | 1.0 | 0.04 | 0.28 | -0.25 |
| Dion Conroy | 2352 | -2 | -0.08 | 0.25 | -0.33 | 4.8 | 0.18 | 0.07 | 0.12 |
| Michael Doughty | 2212 | -4 | -0.16 | 0.33 | -0.49 | 0.5 | 0.02 | 0.26 | -0.24 |
| Kaiyne Woolery | 2152 | 6 | 0.25 | -0.14 | 0.39 | 7.3 | 0.31 | -0.05 | 0.36 |
| James Dunne | 1868 | -1 | -0.05 | 0.16 | -0.21 | 0.6 | 0.03 | 0.22 | -0.19 |
| Sid Nelson | 1755 | -1 | -0.05 | 0.15 | -0.20 | -3.3 | -0.17 | 0.36 | -0.52 |
| Elijah Adebayo | 1737 | -1 | -0.05 | 0.15 | -0.20 | -0.8 | -0.04 | 0.26 | -0.30 |
| Marc Richards | 1535 | -4 | -0.23 | 0.24 | -0.48 | 0.5 | 0.03 | 0.19 | -0.17 |
| Luke McCormick | 1530 | 6 | 0.35 | -0.10 | 0.46 | 0.9 | 0.05 | 0.18 | -0.13 |
| Jak McCourt | 1454 | 5 | 0.31 | -0.07 | 0.38 | 3.5 | 0.22 | 0.09 | 0.13 |
| Steven Alzate | 1451 | -3 | -0.19 | 0.20 | -0.39 | -0.7 | -0.04 | 0.23 | -0.27 |
| Oliver Lancashire | 1426 | -1 | -0.06 | 0.13 | -0.20 | -0.9 | -0.05 | 0.23 | -0.29 |
| Canice Carroll | 1373 | 9 | 0.59 | -0.20 | 0.79 | 6.6 | 0.43 | -0.01 | 0.44 |
| Theo Robinson | 1278 | 9 | 0.63 | -0.19 | 0.82 | 5.1 | 0.36 | 0.03 | 0.32 |
Tranmere Rovers (Actual 6th, xG 10th)
Performance by Match
Performance by Formation
| Starting Formation | Matches | Pts p90 | xPts p90 |
| 4-5-1 | 2 | 3.0 | 1.4 |
| 4-4-2 (Classic) | 27 | 1.7 | 1.4 |
| 4-2-3-1 | 6 | 1.7 | 1.4 |
| 4-3-3 | 6 | 1.2 | 1.5 |
| 5-3-2 | 5 | 0.8 | 1.2 |
Attacking Performance by Player
| Player | Apps | Mins | GI | G | A | xG | xGp90 |
| James Norwood | 45 | 4050 | 30 | 29 | 1 | 21.2 | 0.47 |
| Connor Jennings | 45 | 3900 | 18 | 8 | 10 | 9.1 | 0.21 |
| Oliver Banks | 33 | 2734 | 11 | 3 | 8 | 2.8 | 0.09 |
| Paul Mullin | 22 | 827 | 9 | 5 | 4 | 3.7 | 0.41 |
| Jon Smith | 35 | 1701 | 7 | 4 | 3 | 3.1 | 0.17 |
| Cole Stockton | 16 | 987 | 4 | 1 | 3 | 3.2 | 0.29 |
| David Perkins | 17 | 1455 | 4 | 2 | 2 | 0.4 | 0.02 |
| Harvey Gilmour | 22 | 874 | 4 | 3 | 1 | 0.7 | 0.07 |
| Emmanuel Monthe | 43 | 3825 | 3 | 2 | 1 | 2.3 | 0.05 |
| Liam Ridehalgh | 18 | 1548 | 3 | 0 | 3 | 0.2 | 0.01 |
Overall Performance by Player (P=Playing, NP=Not Playing)
| Player | Mins | GD P | GDp90 P | GDp90 NP | Diff | xGD P | xGDp90 P | xGDp90 NP | Diff |
| Team Average | 4140 | 13 | 0.28 | 2.6 | 0.06 | ||||
| Scott Davies | 4140 | 13 | 0.28 | 2.6 | 0.06 | ||||
| James Norwood | 4050 | 12 | 0.27 | 1.00 | -0.73 | 1.9 | 0.04 | 0.73 | -0.68 |
| Connor Jennings | 3900 | 13 | 0.30 | 0.00 | 0.30 | 2.5 | 0.06 | 0.04 | 0.02 |
| Emmanuel Monthe | 3825 | 13 | 0.31 | 0.00 | 0.31 | 3.1 | 0.07 | -0.14 | 0.22 |
| Jake Caprice | 3563 | 13 | 0.33 | 0.00 | 0.33 | 4.6 | 0.12 | -0.31 | 0.43 |
| Luke McCullough | 3119 | 13 | 0.38 | 0.00 | 0.38 | 0.8 | 0.02 | 0.16 | -0.14 |
| Oliver Banks | 2734 | 15 | 0.49 | -0.13 | 0.62 | 2.0 | 0.07 | 0.04 | 0.02 |
| Steve McNulty | 2312 | 5 | 0.19 | 0.39 | -0.20 | -1.3 | -0.05 | 0.19 | -0.24 |
| Mark Ellis | 2005 | 13 | 0.58 | 0.00 | 0.58 | 2.5 | 0.11 | 0.01 | 0.10 |
| Zoumana Bakayogo | 1744 | 1 | 0.05 | 0.45 | -0.40 | -3.0 | -0.16 | 0.21 | -0.37 |
| Jon Smith | 1701 | 1 | 0.05 | 0.44 | -0.39 | -1.2 | -0.06 | 0.14 | -0.20 |
| Liam Ridehalgh | 1548 | 6 | 0.35 | 0.24 | 0.11 | 4.0 | 0.23 | -0.05 | 0.28 |
| David Perkins | 1455 | 8 | 0.49 | 0.17 | 0.33 | 2.0 | 0.13 | 0.02 | 0.11 |
| Jay Harris | 1389 | 1 | 0.06 | 0.39 | -0.33 | 3.4 | 0.22 | -0.02 | 0.24 |
| Adam Buxton | 1119 | 6 | 0.48 | 0.21 | 0.27 | -0.9 | -0.07 | 0.10 | -0.17 |
| Kieron Morris | 1075 | 2 | 0.17 | 0.32 | -0.16 | 4.0 | 0.33 | -0.04 | 0.37 |
| Cole Stockton | 987 | 3 | 0.27 | 0.29 | -0.01 | -0.8 | -0.07 | 0.10 | -0.17 |
| Ben Pringle | 909 | 9 | 0.89 | 0.11 | 0.78 | 1.3 | 0.13 | 0.04 | 0.10 |
Yeovil Town (Actual 24th, xG 18th)
Performance by Match
Performance by Formation
| Starting Formation | Matches | Pts p90 | xPts p90 |
| 3-4-1-2 | 2 | 1.5 | 0.8 |
| 4-4-2 (Classic) | 30 | 1.0 | 1.4 |
| 4-3-3 | 10 | 0.7 | 1.1 |
| 4-5-1 | 3 | 0.0 | 0.7 |
| 3-4-3 | 1 | 0.0 | 1.0 |
Performance by Manager
| Managerial Record | Matches | Pts p90 | Rank | xPts p90 | Rank |
| Darren Way | 39 | 0.9 | 23rd | 1.2 | 19th |
| Neale Marmon | 7 | 0.6 | 24th | 1.4 | 10th |
Attacking Performance by Player
| Player | Apps | Mins | GI | G | A | xG | xGp90 |
| Alex Fisher | 40 | 2469 | 8 | 7 | 1 | 7.5 | 0.27 |
| Carl Dickinson | 33 | 2874 | 7 | 2 | 5 | 1.4 | 0.04 |
| Yoann Arquin | 32 | 1983 | 7 | 4 | 3 | 2.7 | 0.12 |
| Jordan Green | 19 | 1469 | 6 | 4 | 2 | 3.4 | 0.21 |
| Olufela Olomola | 17 | 983 | 6 | 3 | 3 | 2.8 | 0.25 |
| Tom James | 38 | 3254 | 6 | 6 | 6.9 | 0.19 | |
| Alex Pattison | 29 | 2128 | 4 | 0 | 4 | 1.2 | 0.05 |
| Tristan Abrahams | 15 | 970 | 4 | 3 | 1 | 1.4 | 0.13 |
| Courtney Duffus | 16 | 794 | 3 | 1 | 2 | 1.0 | 0.11 |
| Diallang Jaiyesimi | 9 | 603 | 3 | 2 | 1 | 2.2 | 0.33 |
Overall Performance by Player (P=Playing, NP=Not Playing)
| Player | Mins | GD P | GDp90 P | GDp90 NP | Diff | xGD P | xGDp90 P | xGDp90 NP | Diff |
| Team Average | 4140 | -25 | -0.54 | -7.2 | -0.16 | ||||
| Tom James | 3254 | -22 | -0.61 | -0.30 | -0.30 | -5.3 | -0.15 | -0.20 | 0.06 |
| Nathan Baxter | 3060 | -10 | -0.29 | -1.25 | 0.96 | -2.7 | -0.08 | -0.38 | 0.29 |
| Carl Dickinson | 2874 | -13 | -0.41 | -0.85 | 0.45 | -4.6 | -0.14 | -0.19 | 0.05 |
| Sessi D Almeida | 2798 | -10 | -0.32 | -1.01 | 0.68 | -2.9 | -0.09 | -0.29 | 0.20 |
| Bevis Mugabi | 2568 | -16 | -0.56 | -0.52 | -0.05 | -2.6 | -0.09 | -0.27 | 0.18 |
| Alex Fisher | 2469 | -10 | -0.36 | -0.81 | 0.44 | 0.1 | 0.00 | -0.39 | 0.40 |
| Gary Warren | 2155 | -5 | -0.21 | -0.91 | 0.70 | -3.9 | -0.16 | -0.15 | -0.01 |
| Alex Pattison | 2128 | -6 | -0.25 | -0.85 | 0.60 | 0.6 | 0.02 | -0.35 | 0.37 |
| Yoann Arquin | 1983 | 0 | 0.00 | -1.04 | 1.04 | -2.9 | -0.13 | -0.18 | 0.05 |
| Adel Gafaiti | 1933 | -21 | -0.98 | -0.16 | -0.81 | -7.4 | -0.34 | 0.01 | -0.35 |
| Jake Gray | 1752 | -19 | -0.98 | -0.23 | -0.75 | -5.1 | -0.26 | -0.08 | -0.18 |
| Mihai-Alexandru Dobre | 1744 | -18 | -0.93 | -0.26 | -0.67 | -6.2 | -0.32 | -0.04 | -0.28 |
| Rhys Browne | 1563 | -14 | -0.81 | -0.38 | -0.42 | -3.6 | -0.21 | -0.13 | -0.08 |
| Omar Sowunmi | 1470 | 3 | 0.18 | -0.94 | 1.13 | 0.1 | 0.01 | -0.25 | 0.26 |
| Jordan Green | 1469 | -5 | -0.31 | -0.67 | 0.37 | -4.6 | -0.28 | -0.09 | -0.20 |
| Bernard Francois Zoko | 1434 | -19 | -1.19 | -0.20 | -0.99 | -5.9 | -0.37 | -0.04 | -0.33 |
| Alefe Santos | 1234 | -11 | -0.80 | -0.43 | -0.37 | -6.5 | -0.47 | -0.02 | -0.45 |
| Matt Worthington | 1107 | -14 | -1.14 | -0.33 | -0.81 | -3.0 | -0.24 | -0.13 | -0.12 |
