Here’s my review of the season utilising everybody’s favourite football analytical metric – Expected Goals (or xG).
NOTE: For those not familiar with xG this is a metric to monitor the quality of goalscoring chances. A value between 0 and 1 is assigned based on the probability the chance will result in a goal. A 1 in 20 long range shot with have a probability of 5% (an xG of 0.05) whereas a penalty has a 3 in 4 expectancy and therefore an xG of 0.75.
League Table
Luton Town secured back to back promotion as League One champions securing the trophy on the last day of the season ahead of Barnsley. The table had a strong feel at the top this season with just 9 points separating 1st and 5th. According to my xG model the right two teams were promoted with Barnsley and Luton ranked 1st and 2nd respectively comfortably above the remainder of the league.
Charlton Athletic (xG ranked 6th), Portsmouth (xG ranked 3rd) and Sunderland (xG ranked 4th) were all deserving of their playoff spot. 6th placed Doncaster Rovers finished one place above the xG expectations with the model suggesting 9th place Burton Albion were deserving of a playoff spot.
The relegation battle will go down in folklore with 13 teams fighting for survival with little over a month to go. The four who ultimately failed to stay up: Plymouth Argyle (xG ranked 22nd), Walsall (xG ranked 19th), Scunthorpe United (xG ranked 20th) and Bradford City (xG ranked 23rd) were all rated poorly on my xG so significant overhaul will be required next season.
Gillingham were ranked as the weakest team according to xG and my initial prediction is that they will struggle to survive next season with Tom Eaves unlikely to replicate the 20+ goals he scored this term.
| Team | GF | GA | GD | Pts | xGF | xGA | xGD | xPts | Rank | |
| 1 | Luton Town | 90 | 42 | 48 | 94 | 70 | 42 | 29 | 78.8 | 2 |
| 2 | Barnsley | 80 | 39 | 41 | 91 | 70 | 40 | 30 | 79.4 | 1 |
| 3 | Charlton Athletic | 73 | 40 | 33 | 88 | 65 | 54 | 11 | 68.8 | 6 |
| 4 | Portsmouth | 83 | 51 | 32 | 88 | 64 | 51 | 14 | 69.5 | 3 |
| 5 | Sunderland | 80 | 47 | 33 | 85 | 59 | 49 | 11 | 69.1 | 4 |
| 6 | Doncaster Rovers | 76 | 58 | 18 | 73 | 63 | 55 | 8 | 67.7 | 7 |
| 7 | Peterborough United | 70 | 62 | 8 | 72 | 53 | 61 | -9 | 57.6 | 17 |
| 8 | Coventry City | 54 | 54 | 0 | 65 | 59 | 54 | 5 | 65.3 | 9 |
| 9 | Burton Albion | 66 | 57 | 9 | 63 | 64 | 55 | 10 | 68.8 | 5 |
| 10 | Blackpool | 50 | 52 | -2 | 62 | 53 | 55 | -2 | 61.4 | 13 |
| 11 | Fleetwood Town | 58 | 52 | 6 | 61 | 45 | 48 | -3 | 59.9 | 15 |
| 12 | Oxford United | 57 | 63 | -6 | 60 | 50 | 47 | 4 | 64.3 | 12 |
| 13 | Gillingham | 61 | 72 | -11 | 55 | 51 | 69 | -19 | 53.8 | 24 |
| 14 | Accrington Stanley | 51 | 67 | -16 | 55 | 56 | 65 | -10 | 59.0 | 16 |
| 15 | Bristol Rovers | 47 | 50 | -3 | 54 | 51 | 47 | 4 | 65.5 | 8 |
| 16 | Rochdale | 54 | 87 | -33 | 54 | 54 | 69 | -16 | 54.4 | 21 |
| 17 | Wycombe Wanderers | 55 | 66 | -11 | 53 | 51 | 56 | -5 | 60.4 | 14 |
| 18 | Shrewsbury Town | 51 | 59 | -8 | 52 | 56 | 51 | 5 | 65.0 | 10 |
| 19 | Southend United | 55 | 68 | -13 | 50 | 46 | 54 | -8 | 57.5 | 18 |
| 20 | AFC Wimbledon | 42 | 63 | -21 | 50 | 56 | 54 | 2 | 64.5 | 11 |
| 21 | Plymouth Argyle | 56 | 80 | -24 | 50 | 53 | 68 | -15 | 54.2 | 22 |
| 22 | Walsall | 49 | 71 | -22 | 47 | 50 | 63 | -13 | 55.7 | 19 |
| 23 | Scunthorpe United | 52 | 82 | -30 | 46 | 49 | 63 | -14 | 54.6 | 20 |
| 24 | Bradford City | 49 | 77 | -28 | 41 | 52 | 71 | -19 | 53.9 | 23 |
The remainder of the article is a club-by-club review focusing on five areas:
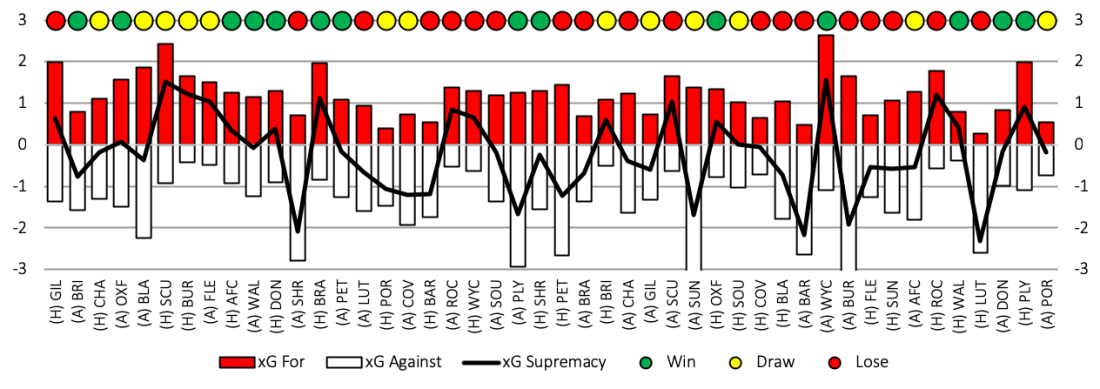
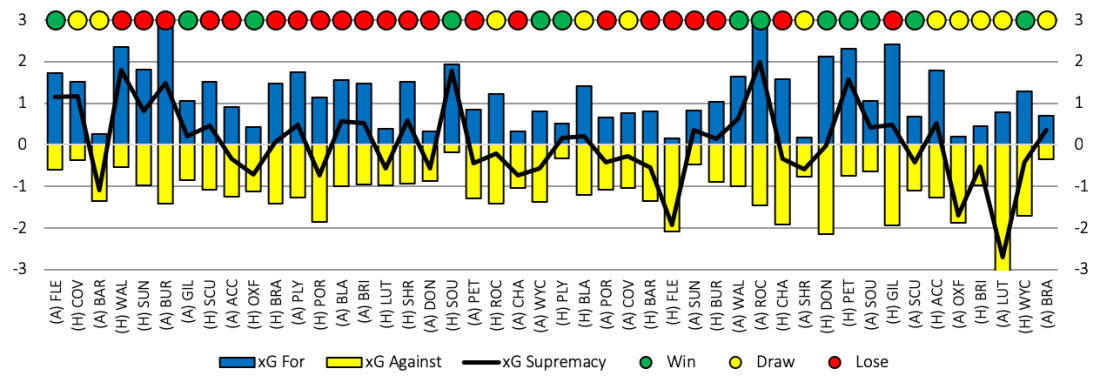
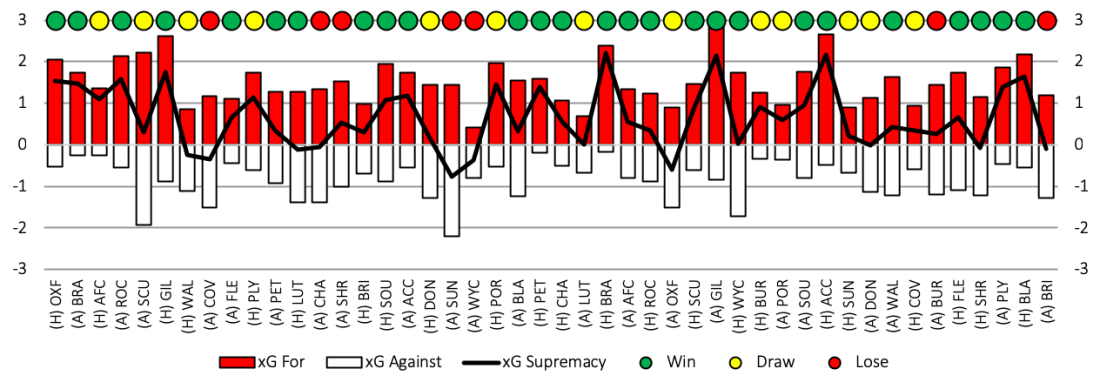
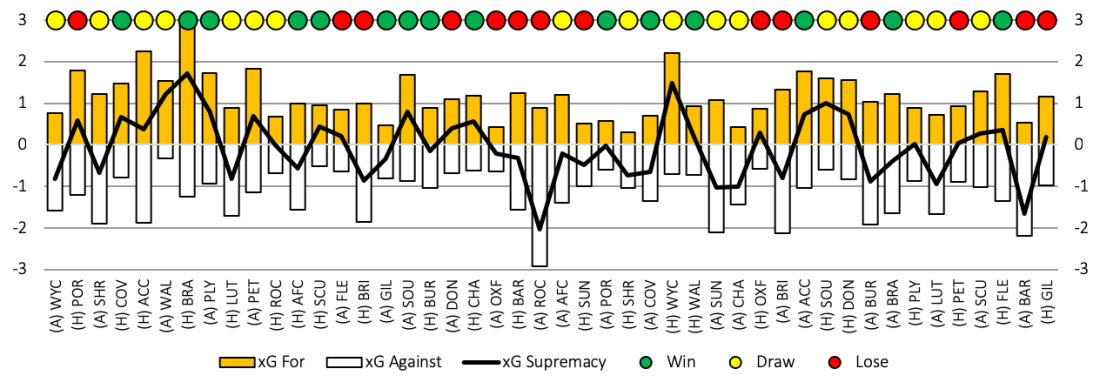
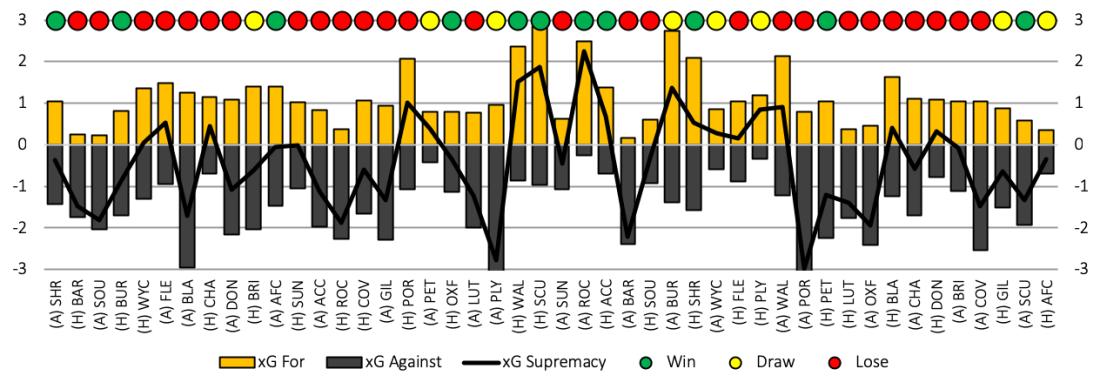
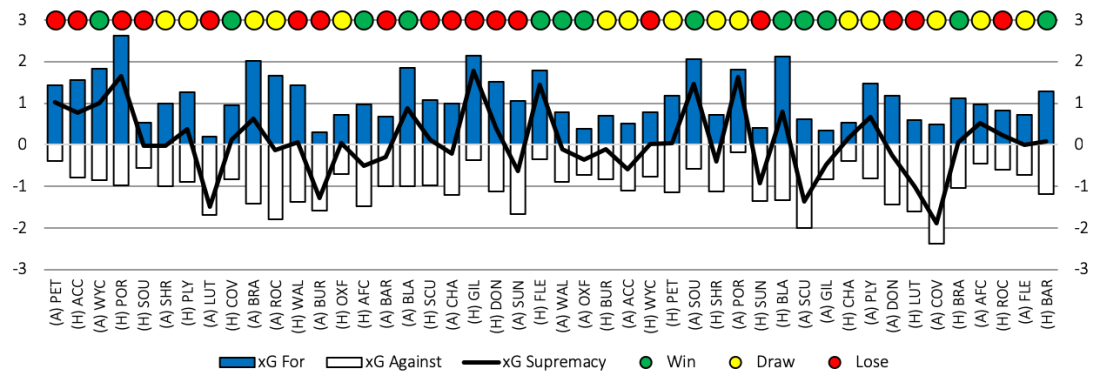
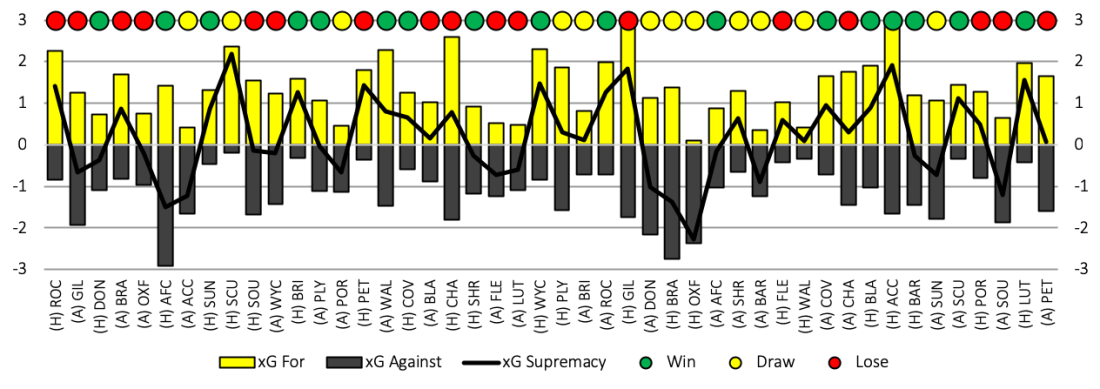
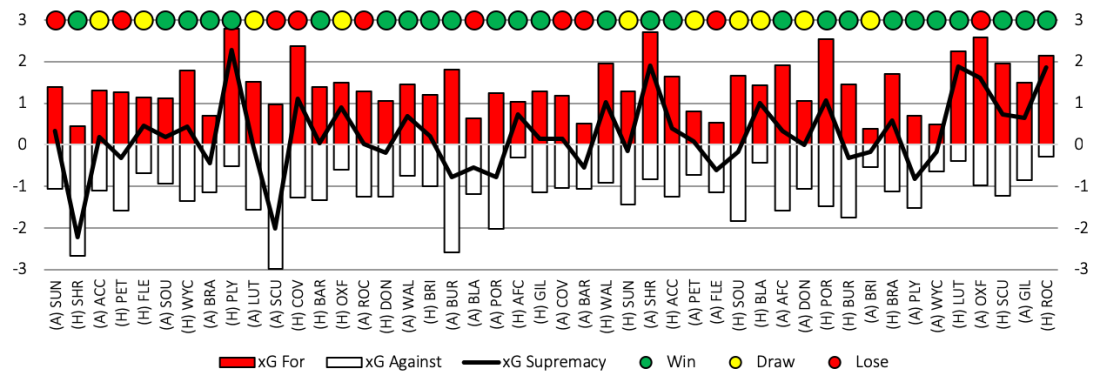
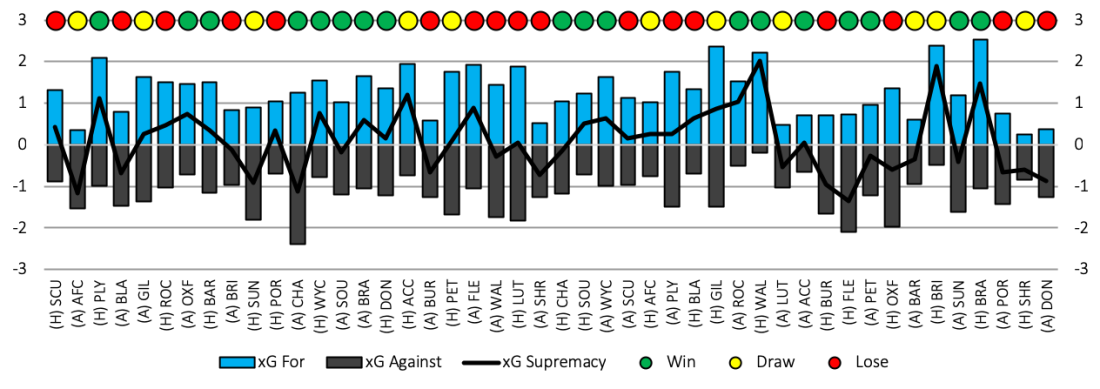
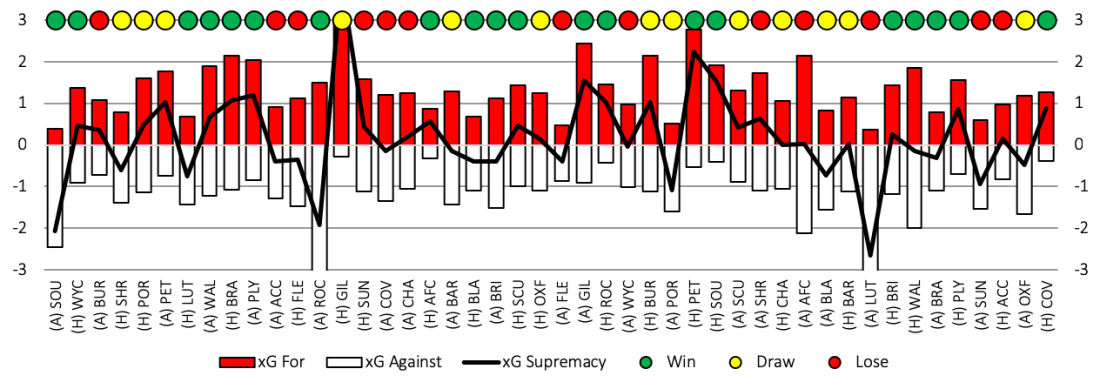
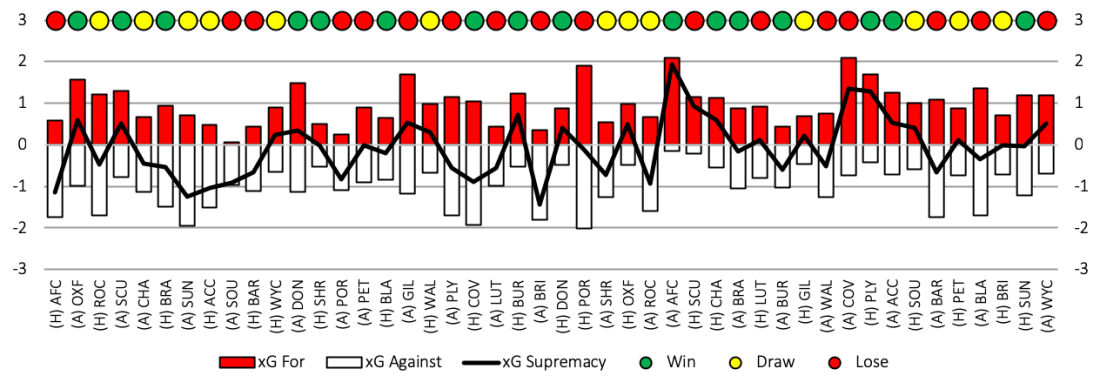
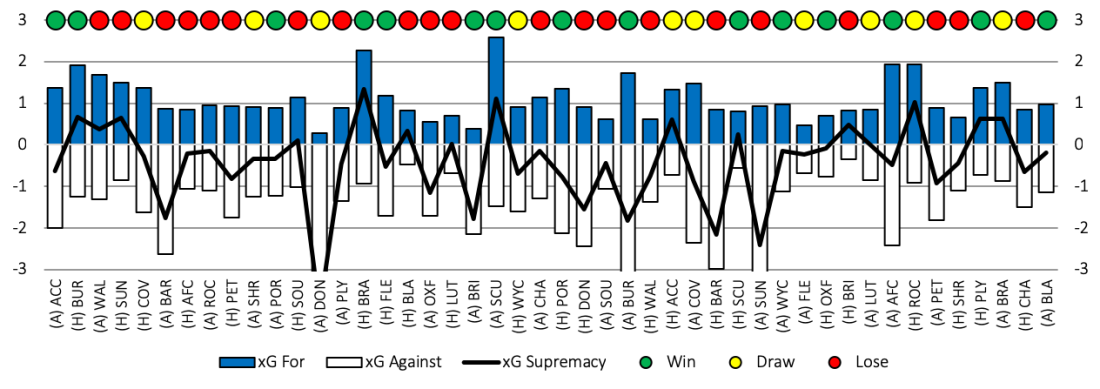
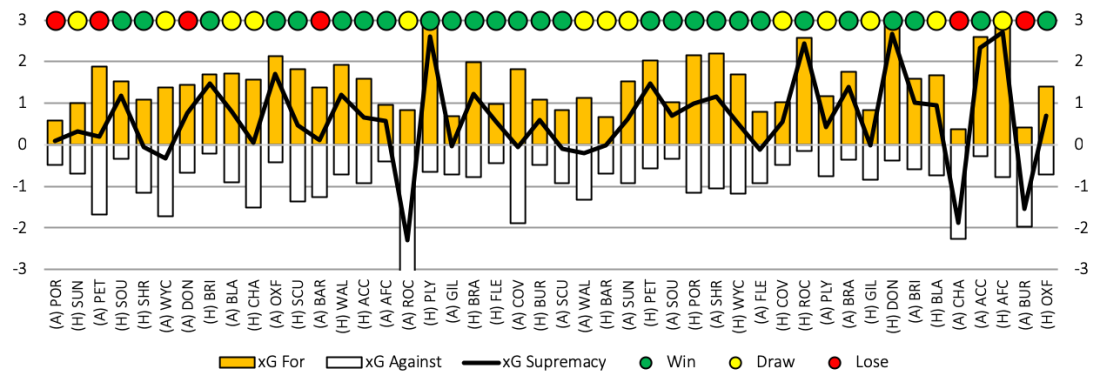
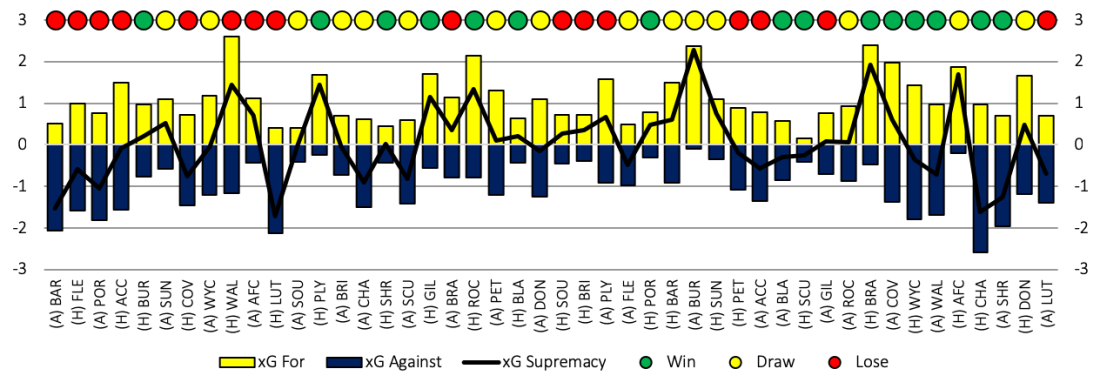
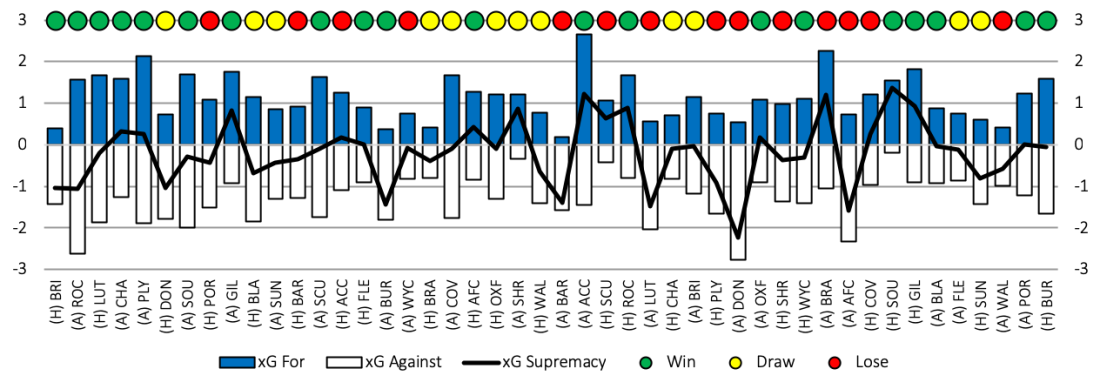
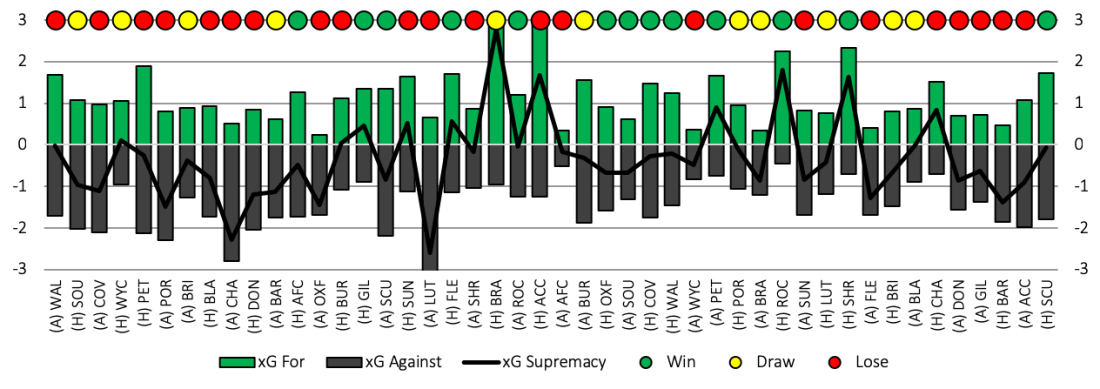
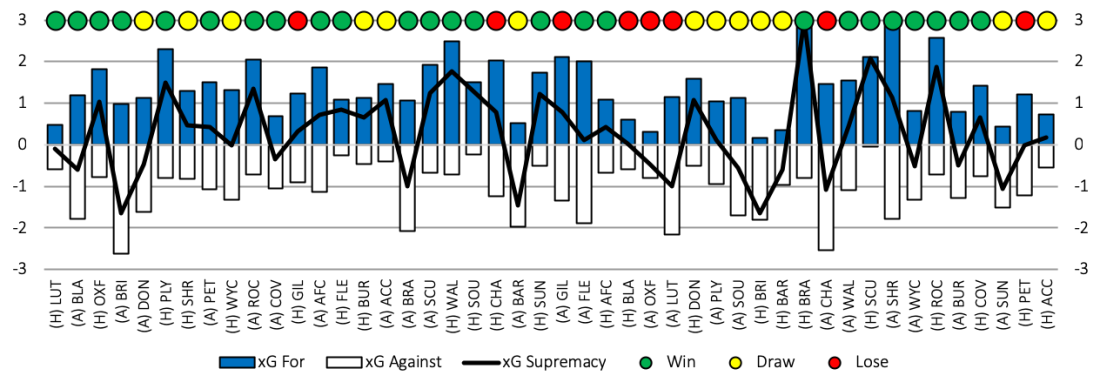
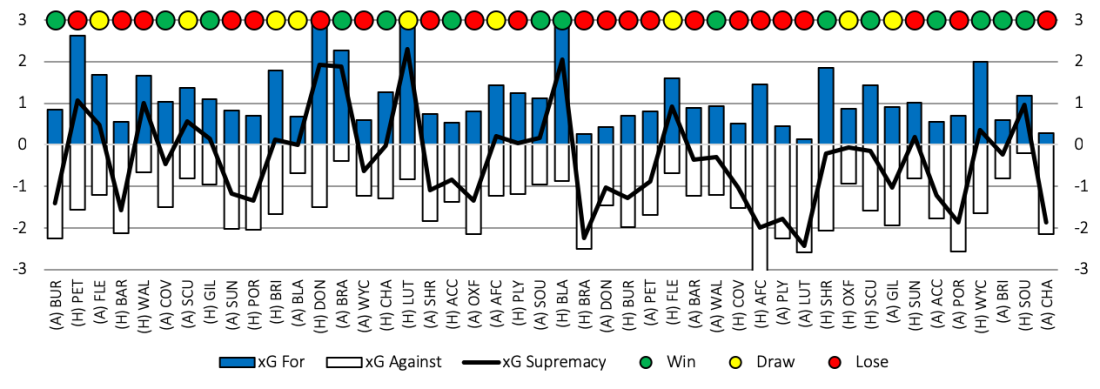
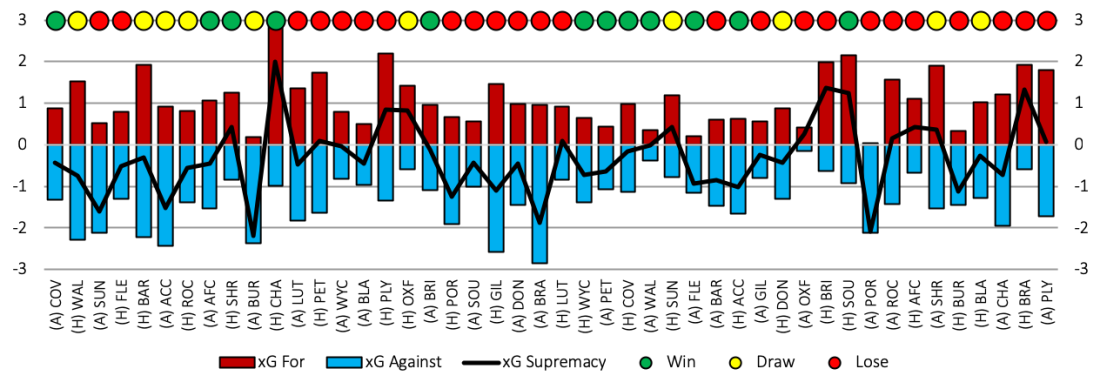
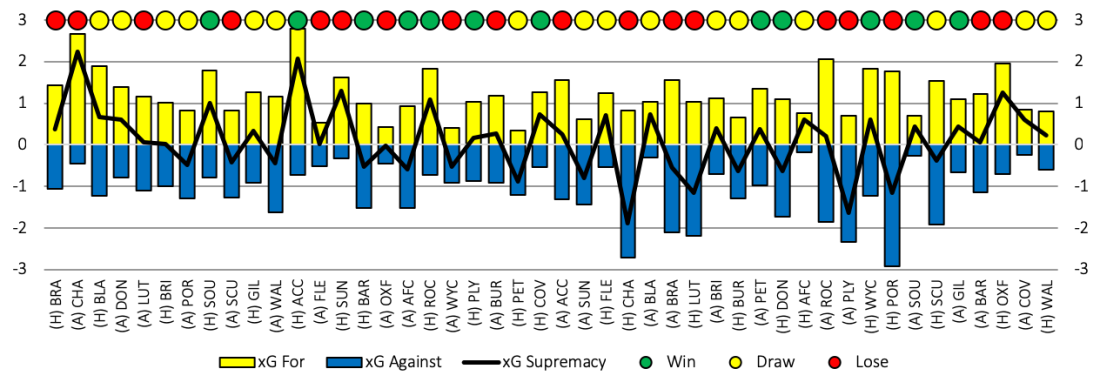
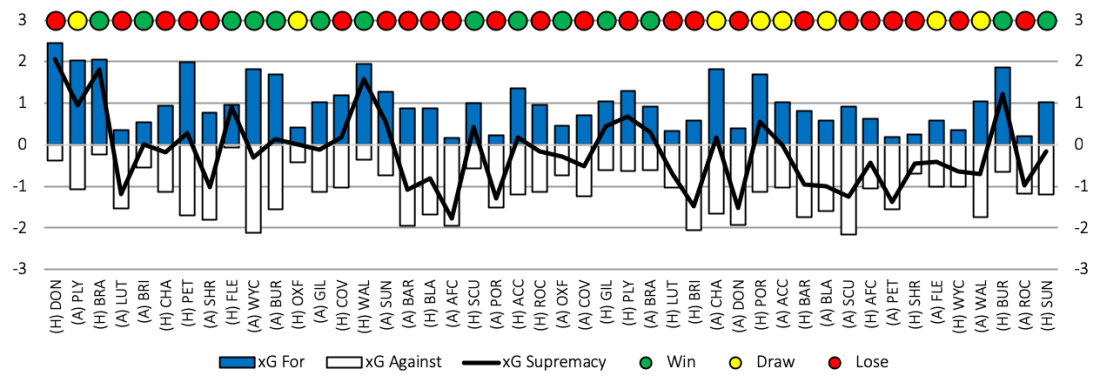
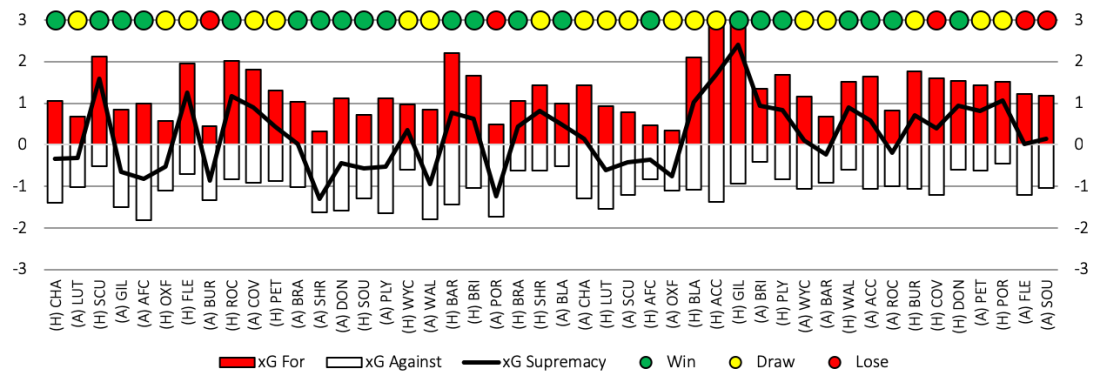
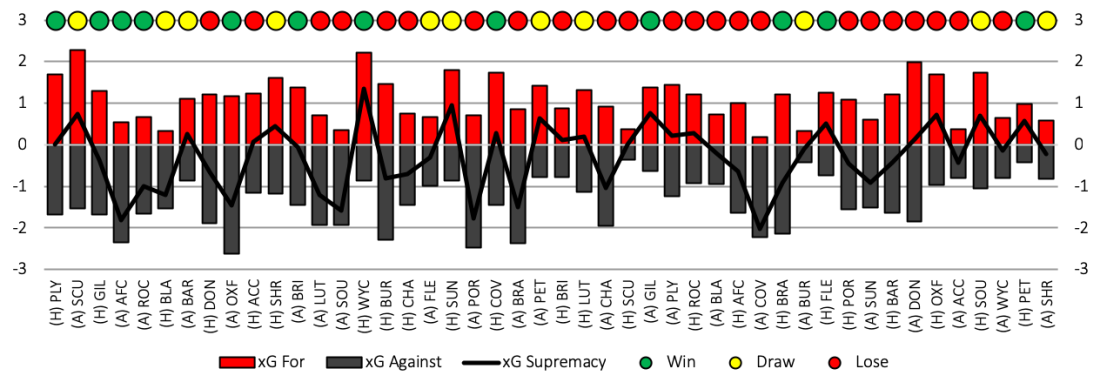
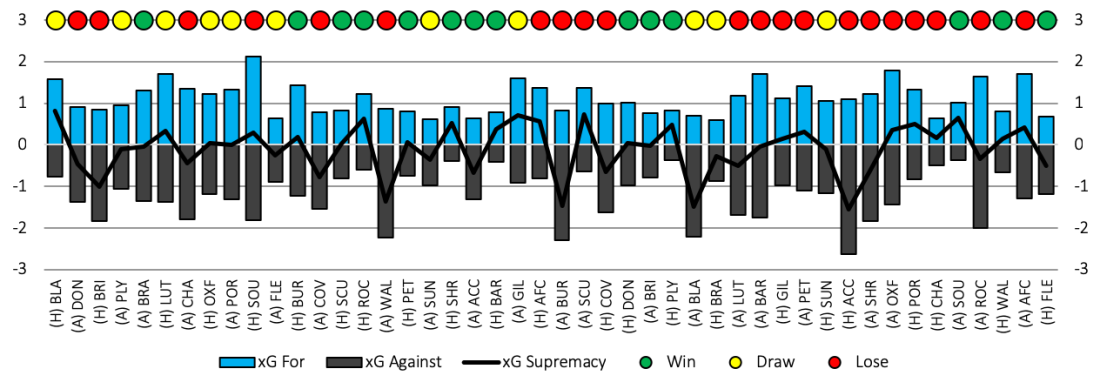
- Performance by Match – A graphical representation of the xG created and conceded by match day. Useful to highlight sections of the season the team performed particularly well/poor. The colour coding at the top indicating the actual match result.
- Performance by Formation – A table to show actual and expected points based on the starting formation used. Useful context to see teams which have a distinct set up and which teams tinkered regularly during the season.
- Performance by Manager – A table to show actual and expected points by manager for those teams who made a change during the season.
- Attacking Performance by Player – A table to show actual and expected goal involvement by player.
- Overall Performance by Player – A new concept to me which attempts to demonstrate the influence a player has to the team by assessing the actual and expected performance when the player featured and when the player was absent.
Accrington Stanley (Actual 14th, xG 16th)
Performance by Match
Performance by Formation
| Starting Formation | Matches | Pts p90 | xPts p90 |
| 4-4-2 (Classic) | 29 | 1.5 | 1.3 |
| 5-4-1 | 1 | 1.0 | 1.0 |
| 4-4-1-1 | 7 | 1.0 | 1.6 |
| 4-5-1 | 5 | 0.6 | 0.6 |
| 3-5-2 | 3 | 0.3 | 1.3 |
| 4-3-1-2 | 1 | 0.0 | 0.7 |
Attacking Performance by Player
| Player | Apps | Mins | GI | G | A | xG | xGp90 |
| Sean McConville | 44 | 3945 | 23 | 15 | 8 | 10.4 | 0.24 |
| Billy Kee | 42 | 3590 | 18 | 13 | 5 | 15.4 | 0.39 |
| Jordan Clark | 44 | 3909 | 11 | 5 | 6 | 7.0 | 0.16 |
| Paul Smyth | 14 | 846 | 5 | 3 | 2 | 2.2 | 0.23 |
| Offrande Zanzala | 27 | 1303 | 4 | 4 | 4.1 | 0.28 | |
| Luke Armstrong | 16 | 808 | 3 | 3 | 2.5 | 0.28 | |
| Ross Sykes | 20 | 1657 | 3 | 3 | 1.7 | 0.09 | |
| Sam Finley | 37 | 2837 | 3 | 1 | 2 | 3.3 | 0.10 |
| Callum Johnson | 41 | 3415 | 2 | 0 | 2 | 0.3 | 0.01 |
| Daniel Barlaser | 39 | 3078 | 2 | 1 | 1 | 2.5 | 0.07 |
Overall Performance by Player (P=Playing, NP=Not Playing)
| Player | Mins | GD P | GDp90 P | GDp90 NP | Diff | xGD P | xGDp90 P | xGDp90 NP | Diff |
| Team Average | 4140 | -16 | -0.35 | -9.5 | -0.21 | ||||
| Mark Hughes | 4124 | -16 | -0.35 | 0.00 | -0.35 | -9.5 | -0.21 | -0.10 | -0.11 |
| Sean McConville | 3945 | -12 | -0.27 | -1.85 | 1.57 | -7.5 | -0.17 | -0.91 | 0.74 |
| Jordan Clark | 3909 | -15 | -0.35 | -0.39 | 0.04 | -6.9 | -0.16 | -1.00 | 0.84 |
| Billy Kee | 3590 | -5 | -0.13 | -1.80 | 1.67 | -6.4 | -0.16 | -0.51 | 0.35 |
| Callum Johnson | 3415 | -18 | -0.47 | 0.25 | -0.72 | -9.3 | -0.24 | -0.03 | -0.21 |
| Daniel Barlaser | 3078 | -10 | -0.29 | -0.51 | 0.22 | -8.9 | -0.26 | -0.05 | -0.20 |
| Sam Finley | 2837 | -14 | -0.44 | -0.14 | -0.31 | -5.9 | -0.19 | -0.25 | 0.06 |
| Connor Ripley | 1980 | -9 | -0.41 | -0.29 | -0.12 | -5.4 | -0.25 | -0.17 | -0.08 |
| Seamus Conneely | 1961 | -5 | -0.23 | -0.45 | 0.22 | -1.9 | -0.09 | -0.31 | 0.23 |
| Nick Anderton | 1898 | -7 | -0.33 | -0.36 | 0.03 | -3.2 | -0.15 | -0.25 | 0.10 |
| Michael Ihiekwe | 1800 | -8 | -0.40 | -0.31 | -0.09 | -4.9 | -0.24 | -0.18 | -0.07 |
| Janoi Donacien | 1681 | -6 | -0.32 | -0.37 | 0.04 | -5.5 | -0.30 | -0.15 | -0.15 |
| Ross Sykes | 1657 | -4 | -0.22 | -0.43 | 0.22 | -3.0 | -0.16 | -0.23 | 0.07 |
| Scott Brown | 1601 | -8 | -0.45 | -0.28 | -0.17 | -3.5 | -0.20 | -0.21 | 0.01 |
| Jon Maxted | 1525 | -5 | -0.30 | -0.38 | 0.08 | -4.8 | -0.28 | -0.16 | -0.12 |
| Offrande Zanzala | 1303 | -2 | -0.14 | -0.44 | 0.31 | -1.8 | -0.12 | -0.24 | 0.12 |
| Ben Richards-Everton | 1146 | -1 | -0.08 | -0.45 | 0.37 | -0.6 | -0.05 | -0.27 | 0.22 |
| Dimitar Evtimov | 878 | -9 | -0.92 | -0.19 | -0.73 | -4.5 | -0.46 | -0.14 | -0.33 |
AFC Wimbledon (Actual 20th, xG 11th)
Performance by Match
Performance by Formation
| Starting Formation | Matches | Pts p90 | xPts p90 |
| 5-3-2 | 2 | 2.0 | 0.8 |
| 3-5-2 | 13 | 1.8 | 1.4 |
| 4-4-1-1 | 3 | 1.0 | 1.4 |
| 4-4-2 (Classic) | 20 | 1.0 | 1.5 |
| 4-1-4-1 | 3 | 0.3 | 1.3 |
| 4-3-3 | 2 | 0.0 | 1.4 |
| 4-5-1 | 1 | 0.0 | 1.0 |
| 4-2-3-1 | 2 | 0.0 | 1.1 |
Performance by Manager
| Managerial Record | Matches | Pts p90 | Rank | xPts p90 | Rank |
| Neal Ardley | 17 | 0.6 | 24th | 1.6 | 3rd |
| Simon Bassey | 3 | 1.0 | 1.4 | ||
| Wally Downes | 26 | 1.4 | 9th | 1.3 | 16th |
Attacking Performance by Player
| Player | Apps | Mins | GI | G | A | xG | xGp90 |
| Joe Pigott | 39 | 2678 | 18 | 15 | 3 | 12.9 | 0.43 |
| Anthony Wordsworth | 37 | 2691 | 6 | 2 | 4 | 3.2 | 0.11 |
| James Hanson | 29 | 1708 | 6 | 5 | 1 | 6.1 | 0.32 |
| Mitchell Pinnock | 33 | 1844 | 6 | 3 | 3 | 3.1 | 0.15 |
| Kwesi Appiah | 26 | 1539 | 5 | 4 | 1 | 5.7 | 0.34 |
| Andy Barcham | 26 | 1734 | 3 | 1 | 2 | 1.0 | 0.05 |
| Jake Jervis | 23 | 1213 | 3 | 2 | 1 | 3.9 | 0.29 |
| Scott Wagstaff | 34 | 2348 | 3 | 2 | 1 | 2.1 | 0.08 |
| Steve Seddon | 18 | 1610 | 3 | 3 | 2.0 | 0.11 | |
| Ben Purrington | 26 | 2281 | 2 | 0 | 2 | 0.3 | 0.01 |
Overall Performance by Player (P=Playing, NP=Not Playing)
| Player | Mins | GD P | GDp90 P | GDp90 NP | Diff | xGD P | xGDp90 P | xGDp90 NP | Diff |
| Team Average | 4140 | -21 | -0.46 | 2.1 | 0.05 | ||||
| Will Nightingale | 3339 | -15 | -0.40 | -0.67 | 0.27 | 0.7 | 0.02 | 0.15 | -0.13 |
| Anthony Wordsworth | 2691 | -5 | -0.17 | -0.99 | 0.83 | 0.4 | 0.01 | 0.10 | -0.09 |
| Joe Pigott | 2678 | -11 | -0.37 | -0.62 | 0.25 | 5.9 | 0.20 | -0.24 | 0.44 |
| Scott Wagstaff | 2348 | -19 | -0.73 | -0.10 | -0.63 | -0.5 | -0.02 | 0.13 | -0.15 |
| Anthony Hartigan | 2311 | -4 | -0.16 | -0.84 | 0.68 | -2.6 | -0.10 | 0.23 | -0.33 |
| Ben Purrington | 2281 | -15 | -0.59 | -0.29 | -0.30 | 4.8 | 0.19 | -0.13 | 0.32 |
| Adedeji Oshilaja | 2242 | -21 | -0.84 | 0.00 | -0.84 | 3.1 | 0.12 | -0.05 | 0.17 |
| Rod McDonald | 2038 | -13 | -0.57 | -0.34 | -0.23 | 3.5 | 0.15 | -0.06 | 0.21 |
| Tennai Watson | 1900 | -15 | -0.71 | -0.24 | -0.47 | -2.0 | -0.09 | 0.16 | -0.26 |
| Terell Thomas | 1863 | -7 | -0.34 | -0.55 | 0.22 | -1.4 | -0.07 | 0.14 | -0.21 |
| Mitchell Pinnock | 1844 | -15 | -0.73 | -0.24 | -0.50 | 4.4 | 0.21 | -0.09 | 0.30 |
| Aaron Ramsdale | 1800 | -4 | -0.20 | -0.65 | 0.45 | -3.0 | -0.15 | 0.19 | -0.34 |
| Andy Barcham | 1734 | -11 | -0.57 | -0.37 | -0.20 | -1.1 | -0.06 | 0.12 | -0.18 |
| James Hanson | 1708 | -3 | -0.16 | -0.67 | 0.51 | -0.2 | -0.01 | 0.08 | -0.09 |
| Tom Soares | 1676 | -13 | -0.70 | -0.29 | -0.41 | 0.4 | 0.02 | 0.06 | -0.04 |
| Toby Sibbick | 1619 | -1 | -0.06 | -0.71 | 0.66 | 3.0 | 0.17 | -0.03 | 0.20 |
| Steve Seddon | 1610 | -1 | -0.06 | -0.71 | 0.66 | -1.0 | -0.05 | 0.11 | -0.16 |
| Kwesi Appiah | 1539 | -14 | -0.82 | -0.24 | -0.58 | 2.0 | 0.12 | 0.00 | 0.12 |
Barnsley (Actual 2nd, xG 1st)
Performance by Match
Performance by Formation
| Starting Formation | Matches | Pts p90 | xPts p90 |
| 4-4-1-1 | 2 | 3.0 | 1.5 |
| 4-1-3-2 | 1 | 3.0 | 2.3 |
| 4-1-4-1 | 3 | 2.3 | 1.7 |
| 4-4-2 (Classic) | 21 | 2.1 | 1.8 |
| 4-3-3 | 6 | 2.0 | 1.8 |
| 4-3-2-1 | 2 | 2.0 | 2.1 |
| 4-2-3-1 | 9 | 1.4 | 1.6 |
| 4-5-1 | 2 | 1.0 | 1.2 |
Attacking Performance by Player
| Player | Apps | Mins | GI | G | A | xG | xGp90 |
| Kieffer Moore | 31 | 2340 | 20 | 17 | 3 | 11.7 | 0.45 |
| Cauley Woodrow | 31 | 2455 | 17 | 16 | 1 | 11.6 | 0.42 |
| Alex Mowatt | 46 | 4114 | 15 | 8 | 7 | 5.4 | 0.12 |
| Jacob Brown | 31 | 2030 | 14 | 8 | 6 | 4.1 | 0.18 |
| Mamadou Thiam | 46 | 2894 | 13 | 7 | 6 | 7.9 | 0.25 |
| Brad Potts | 22 | 1736 | 11 | 6 | 5 | 3.3 | 0.17 |
| Cameron McGeehan | 38 | 2872 | 8 | 6 | 2 | 4.8 | 0.15 |
| Dimitri Kevin Cavare | 41 | 3589 | 6 | 2 | 4 | 2.3 | 0.06 |
| Daniel Pinillos | 35 | 2794 | 5 | 0 | 5 | 1.4 | 0.05 |
| George Moncur | 22 | 1067 | 5 | 1 | 4 | 3.5 | 0.29 |
Overall Performance by Player (P=Playing, NP=Not Playing)
| Player | Mins | GD P | GDp90 P | GDp90 NP | Diff | xGD P | xGDp90 P | xGDp90 NP | Diff |
| Team Average | 4140 | 41 | 0.89 | 29.9 | 0.65 | ||||
| Ethan Pinnock | 4140 | 41 | 0.89 | 29.9 | 0.65 | ||||
| Alex Mowatt | 4114 | 41 | 0.90 | 0.00 | 0.90 | 29.6 | 0.65 | 1.12 | -0.47 |
| Adam Davies | 3780 | 37 | 0.88 | 1.00 | -0.12 | 28.6 | 0.68 | 0.31 | 0.37 |
| Liam Lindsay | 3683 | 36 | 0.88 | 0.98 | -0.10 | 26.0 | 0.64 | 0.75 | -0.12 |
| Dimitri Kevin Cavare | 3589 | 33 | 0.83 | 1.31 | -0.48 | 25.1 | 0.63 | 0.77 | -0.14 |
| Mamadou Thiam | 2894 | 26 | 0.81 | 1.08 | -0.27 | 18.0 | 0.56 | 0.86 | -0.30 |
| Cameron McGeehan | 2872 | 26 | 0.81 | 1.06 | -0.25 | 20.0 | 0.63 | 0.70 | -0.07 |
| Daniel Pinillos | 2794 | 30 | 0.97 | 0.74 | 0.23 | 24.4 | 0.79 | 0.37 | 0.42 |
| Cauley Woodrow | 2455 | 22 | 0.81 | 1.01 | -0.21 | 15.4 | 0.56 | 0.77 | -0.21 |
| Kieffer Moore | 2340 | 23 | 0.88 | 0.90 | -0.02 | 18.9 | 0.73 | 0.55 | 0.18 |
| Jacob Brown | 2030 | 26 | 1.15 | 0.64 | 0.51 | 11.4 | 0.51 | 0.79 | -0.28 |
| Mike-Steven Bv§hre | 1980 | 21 | 0.95 | 0.83 | 0.12 | 14.3 | 0.65 | 0.65 | 0.00 |
| Brad Potts | 1736 | 19 | 0.99 | 0.82 | 0.16 | 15.3 | 0.80 | 0.54 | 0.25 |
| Kenneth Dougall | 1583 | 20 | 1.14 | 0.74 | 0.40 | 12.7 | 0.72 | 0.60 | 0.12 |
| George Moncur | 1067 | 10 | 0.84 | 0.91 | -0.06 | 8.4 | 0.71 | 0.63 | 0.08 |
| Ben Williams | 950 | 10 | 0.95 | 0.87 | 0.07 | 3.8 | 0.36 | 0.74 | -0.38 |
| Jordan Williams | 645 | 5 | 0.70 | 0.93 | -0.23 | 5.4 | 0.75 | 0.63 | 0.12 |
| Ryan Hedges | 635 | -1 | -0.14 | 1.08 | -1.22 | 4.2 | 0.60 | 0.66 | -0.06 |
Blackpool (Actual 10th, xG 13th)
Performance by Match
Performance by Formation
| Starting Formation | Matches | Pts p90 | xPts p90 |
| 4-3-1-2 | 1 | 3.0 | 1.8 |
| 3-5-2 | 3 | 1.7 | 1.3 |
| 4-4-2 (Classic) | 8 | 1.5 | 1.3 |
| 3-4-1-2 | 4 | 1.5 | 1.5 |
| 4-3-3 | 19 | 1.4 | 1.3 |
| 4-2-3-1 | 9 | 1.1 | 1.4 |
| 3-4-3 (Diamond Formation) | 1 | 0.0 | 1.0 |
| 3-4-3 | 1 | 0.0 | 1.4 |
Performance by Manager
| Managerial Record | Matches | Pts p90 | Rank | xPts p90 | Rank |
| Gary Bowyer | 1 | 1.0 | 0.8 | ||
| Terry McPhillips | 45 | 1.4 | 1.3 |
Attacking Performance by Player
| Player | Apps | Mins | GI | G | A | xG | xGp90 |
| Armand Gnanduillet | 43 | 3290 | 13 | 10 | 3 | 9.6 | 0.26 |
| Nathan Delfouneso | 38 | 2838 | 10 | 7 | 3 | 6.6 | 0.21 |
| Curtis Tilt | 37 | 3209 | 7 | 4 | 3 | 3.8 | 0.11 |
| Jay Spearing | 42 | 3665 | 6 | 4 | 2 | 3.3 | 0.08 |
| Michael Nottingham | 29 | 1586 | 6 | 2 | 4 | 1.3 | 0.07 |
| Harry Pritchard | 37 | 1774 | 5 | 3 | 2 | 3.5 | 0.18 |
| Jordan Thompson | 38 | 2797 | 5 | 3 | 2 | 5.1 | 0.16 |
| Joseph Dodoo | 18 | 844 | 4 | 2 | 2 | 2.3 | 0.25 |
| Marc Bola | 35 | 3031 | 4 | 2 | 2 | 0.7 | 0.02 |
| Matthew Virtue-Thick | 13 | 1016 | 4 | 3 | 1 | 1.6 | 0.14 |
Overall Performance by Player (P=Playing, NP=Not Playing)
| Player | Mins | GD P | GDp90 P | GDp90 NP | Diff | xGD P | xGDp90 P | xGDp90 NP | Diff |
| Team Average | 4140 | -2 | -0.04 | -1.8 | -0.04 | ||||
| Ben Heneghan | 3690 | -9 | -0.22 | 1.40 | -1.62 | -4.9 | -0.12 | 0.61 | -0.73 |
| Jay Spearing | 3665 | -5 | -0.12 | 0.57 | -0.69 | -1.7 | -0.04 | -0.04 | 0.00 |
| Armand Gnanduillet | 3290 | 2 | 0.05 | -0.42 | 0.48 | -2.6 | -0.07 | 0.08 | -0.15 |
| Curtis Tilt | 3209 | 5 | 0.14 | -0.68 | 0.82 | 1.0 | 0.03 | -0.28 | 0.30 |
| Marc Bola | 3031 | 6 | 0.18 | -0.65 | 0.83 | 0.3 | 0.01 | -0.17 | 0.18 |
| Nathan Delfouneso | 2838 | -3 | -0.10 | 0.07 | -0.16 | -1.2 | -0.04 | -0.04 | 0.00 |
| Mark Howard | 2806 | 0 | 0.00 | -0.13 | 0.13 | 1.4 | 0.04 | -0.22 | 0.26 |
| Jordan Thompson | 2797 | -3 | -0.10 | 0.07 | -0.16 | -2.3 | -0.08 | 0.03 | -0.11 |
| Oliver Turton | 2718 | 5 | 0.17 | -0.44 | 0.61 | 4.0 | 0.13 | -0.37 | 0.50 |
| Liam Feeney | 2252 | -1 | -0.04 | -0.05 | 0.01 | -2.6 | -0.10 | 0.04 | -0.14 |
| Donervon Daniels | 2017 | 3 | 0.13 | -0.21 | 0.35 | 0.1 | 0.01 | -0.08 | 0.09 |
| Harry Pritchard | 1774 | -7 | -0.36 | 0.19 | -0.55 | 0.2 | 0.01 | -0.08 | 0.08 |
| Michael Nottingham | 1586 | 6 | 0.34 | -0.28 | 0.62 | 0.3 | 0.02 | -0.08 | 0.09 |
| Christoffer Mafoumbi | 1260 | 0 | 0.00 | -0.06 | 0.06 | -3.3 | -0.23 | 0.04 | -0.28 |
| Callum Guy | 1102 | 4 | 0.33 | -0.18 | 0.50 | -2.6 | -0.21 | 0.02 | -0.24 |
| Matthew Virtue-Thick | 1016 | -4 | -0.35 | 0.06 | -0.41 | -1.9 | -0.17 | 0.00 | -0.17 |
| Joseph Dodoo | 844 | -2 | -0.21 | 0.00 | -0.21 | 0.6 | 0.06 | -0.07 | 0.13 |
| Nick Anderton | 761 | -8 | -0.95 | 0.16 | -1.11 | -0.5 | -0.06 | -0.04 | -0.02 |
Bradford City (Actual 24th, xG 23rd)
Performance by Match
Performance by Formation
| Starting Formation | Matches | Pts p90 | xPts p90 |
| 4-1-2-1-2 (Diamond Formation) | 1 | 3.0 | 0.7 |
| 4-3-2-1 | 2 | 2.0 | 1.6 |
| 4-1-3-2 | 4 | 1.8 | 0.9 |
| 4-4-2 (Classic) | 15 | 1.0 | 1.4 |
| 4-2-3-1 | 14 | 0.9 | 1.1 |
| 4-3-3 | 5 | 0.0 | 1.2 |
| 3-4-3 | 2 | 0.0 | 1.1 |
| 5-3-2 | 1 | 0.0 | 0.7 |
| 5-4-1 | 1 | 0.0 | 0.7 |
| 3-4-2-1 | 1 | 0.0 | 0.4 |
Performance by Manager
| Managerial Record | Matches | Pts p90 | Rank | xPts p90 | Rank |
| Michael Collins | 6 | 1.0 | 24th | 1.0 | 24th |
| David Hopkin | 28 | 1.0 | 24th | 1.3 | 14th |
| Martin Drury | 1 | 0.0 | 0.3 | ||
| Gary Bowyer | 11 | 0.7 | 24th | 1.0 | 24th |
Attacking Performance by Player
| Player | Apps | Mins | GI | G | A | xG | xGp90 |
| Eoin Doyle | 44 | 3413 | 15 | 11 | 4 | 12.9 | 0.34 |
| Jack Payne | 39 | 2930 | 14 | 9 | 5 | 7.4 | 0.23 |
| David Ball | 35 | 2663 | 8 | 5 | 3 | 6.7 | 0.23 |
| Anthony O Connor | 42 | 3668 | 7 | 6 | 1 | 2.4 | 0.06 |
| George Miller | 38 | 1921 | 7 | 3 | 4 | 4.2 | 0.20 |
| Lewis O Brien | 40 | 3385 | 7 | 4 | 3 | 3.7 | 0.10 |
| Paul Caddis | 27 | 2231 | 4 | 1 | 3 | 0.6 | 0.03 |
| Billy Clarke | 13 | 519 | 3 | 1 | 2 | 0.2 | 0.04 |
| Hope Akpan | 28 | 2024 | 3 | 2 | 1 | 3.5 | 0.16 |
| Jacob Butterfield | 15 | 1020 | 2 | 1 | 1 | 1.3 | 0.12 |
Overall Performance by Player (P=Playing, NP=Not Playing)
| Player | Mins | GD P | GDp90 P | GDp90 NP | Diff | xGD P | xGDp90 P | xGDp90 NP | Diff |
| Team Average | 4140 | -28 | -0.61 | -18.7 | -0.41 | ||||
| Richard O Donnell | 3780 | -27 | -0.64 | -0.25 | -0.39 | -14.9 | -0.35 | -0.95 | 0.59 |
| Anthony O Connor | 3668 | -22 | -0.54 | -1.14 | 0.60 | -19.1 | -0.47 | 0.09 | -0.56 |
| Eoin Doyle | 3413 | -28 | -0.74 | 0.00 | -0.74 | -14.1 | -0.37 | -0.57 | 0.20 |
| Lewis O Brien | 3385 | -27 | -0.72 | -0.12 | -0.60 | -13.5 | -0.36 | -0.61 | 0.25 |
| Nathaniel Knight-Percival | 3114 | -21 | -0.61 | -0.61 | 0.01 | -8.5 | -0.24 | -0.90 | 0.65 |
| Jack Payne | 2930 | -21 | -0.65 | -0.52 | -0.12 | -9.0 | -0.28 | -0.72 | 0.44 |
| David Ball | 2663 | -16 | -0.54 | -0.73 | 0.19 | -6.5 | -0.22 | -0.74 | 0.53 |
| Adam Chicksen | 2401 | -6 | -0.22 | -1.14 | 0.91 | -4.7 | -0.18 | -0.72 | 0.54 |
| Paul Caddis | 2231 | -7 | -0.28 | -0.99 | 0.71 | -3.1 | -0.12 | -0.74 | 0.61 |
| Hope Akpan | 2024 | -21 | -0.93 | -0.30 | -0.64 | -9.1 | -0.40 | -0.41 | 0.01 |
| Ryan McGowan | 1954 | -17 | -0.78 | -0.45 | -0.33 | -7.0 | -0.32 | -0.48 | 0.16 |
| George Miller | 1921 | -4 | -0.19 | -0.97 | 0.79 | -7.6 | -0.35 | -0.45 | 0.10 |
| Connor Wood | 1654 | -22 | -1.20 | -0.22 | -0.98 | -11.5 | -0.63 | -0.26 | -0.37 |
| Kelvin Mellor | 1481 | -7 | -0.43 | -0.71 | 0.29 | -12.9 | -0.78 | -0.19 | -0.59 |
| Josh Wright | 1316 | -14 | -0.96 | -0.45 | -0.51 | -10.8 | -0.74 | -0.25 | -0.48 |
| Sean Scannell | 1290 | -9 | -0.63 | -0.60 | -0.03 | -10.0 | -0.70 | -0.27 | -0.43 |
| Jacob Butterfield | 1020 | -11 | -0.97 | -0.49 | -0.48 | -6.4 | -0.57 | -0.35 | -0.21 |
| Jermaine Anderson | 822 | -5 | -0.55 | -0.62 | 0.08 | -6.5 | -0.71 | -0.33 | -0.37 |
Bristol Rovers (Actual 15th, xG 8th)
Performance by Match
Performance by Formation
| Starting Formation | Matches | Pts p90 | xPts p90 |
| 5-3-2 | 5 | 1.8 | 1.5 |
| 4-5-1 | 3 | 1.3 | 1.2 |
| 4-4-2 (Classic) | 22 | 1.3 | 1.5 |
| 4-1-2-1-2 (Diamond Formation) | 5 | 1.2 | 1.4 |
| 4-4-1-1 | 3 | 0.7 | 1.1 |
| 4-3-3 | 7 | 0.6 | 1.5 |
| 3-5-2 | 1 | 0.0 | 1.3 |
Performance by Manager
| Managerial Record | Matches | Pts p90 | Rank | xPts p90 | Rank |
| Darrell Clarke | 21 | 0.8 | 24th | 1.5 | 3rd |
| Graham Coughlan | 25 | 1.5 | 8th | 1.3 | 12th |
Attacking Performance by Player
| Player | Apps | Mins | GI | G | A | xG | xGp90 |
| Jonson Clarke-Harris | 16 | 1314 | 11 | 11 | 6.1 | 0.42 | |
| Tom Nichols | 36 | 2146 | 8 | 1 | 7 | 4.1 | 0.17 |
| Alex Rodman | 27 | 1734 | 7 | 5 | 2 | 2.8 | 0.14 |
| Liam Sercombe | 39 | 2967 | 7 | 4 | 3 | 7.1 | 0.22 |
| Ollie Clarke | 40 | 3428 | 6 | 6 | 4.9 | 0.13 | |
| James Clarke | 41 | 3397 | 5 | 2 | 3 | 2.0 | 0.05 |
| Alex Jakubiak | 34 | 1480 | 4 | 2 | 2 | 2.7 | 0.17 |
| Ed Upson | 35 | 2919 | 4 | 1 | 3 | 2.3 | 0.07 |
| Gavin Reilly | 30 | 1423 | 4 | 4 | 4.0 | 0.26 | |
| Tareiq Holmes-Dennis | 18 | 1452 | 3 | 1 | 2 | 0.7 | 0.04 |
Overall Performance by Player (P=Playing, NP=Not Playing)
| Player | Mins | GD P | GDp90 P | GDp90 NP | Diff | xGD P | xGDp90 P | xGDp90 NP | Diff |
| Team Average | 4140 | -3 | -0.07 | 3.9 | 0.09 | ||||
| Tony Craig | 4098 | -3 | -0.07 | 0.00 | -0.07 | 3.3 | 0.07 | 1.37 | -1.30 |
| Tom Lockyer | 3638 | -1 | -0.02 | -0.36 | 0.33 | 2.7 | 0.07 | 0.23 | -0.16 |
| Jack Bonham | 3559 | -1 | -0.03 | -0.31 | 0.28 | -2.2 | -0.06 | 0.95 | -1.00 |
| Ollie Clarke | 3428 | -2 | -0.05 | -0.13 | 0.07 | 1.5 | 0.04 | 0.31 | -0.27 |
| James Clarke | 3397 | -7 | -0.19 | 0.48 | -0.67 | -0.3 | -0.01 | 0.51 | -0.51 |
| Liam Sercombe | 2967 | -2 | -0.06 | -0.08 | 0.02 | 6.2 | 0.19 | -0.18 | 0.36 |
| Ed Upson | 2919 | 2 | 0.06 | -0.37 | 0.43 | -1.3 | -0.04 | 0.38 | -0.42 |
| Tom Nichols | 2146 | 2 | 0.08 | -0.23 | 0.31 | 3.2 | 0.13 | 0.03 | 0.10 |
| Michael Kelly | 1813 | 10 | 0.50 | -0.50 | 1.00 | -4.5 | -0.22 | 0.32 | -0.55 |
| Alex Rodman | 1734 | -2 | -0.10 | -0.04 | -0.07 | 2.3 | 0.12 | 0.06 | 0.06 |
| Alex Jakubiak | 1480 | 1 | 0.06 | -0.14 | 0.20 | -0.4 | -0.03 | 0.15 | -0.17 |
| Tareiq Holmes-Dennis | 1452 | 1 | 0.06 | -0.13 | 0.20 | 4.1 | 0.25 | -0.01 | 0.26 |
| Gavin Reilly | 1423 | 1 | 0.06 | -0.13 | 0.20 | 1.4 | 0.09 | 0.08 | 0.00 |
| Abu Ogogo | 1344 | -1 | -0.07 | -0.06 | 0.00 | -1.6 | -0.11 | 0.18 | -0.29 |
| Jonson Clarke-Harris | 1314 | 0 | 0.00 | -0.10 | 0.10 | -1.1 | -0.08 | 0.16 | -0.24 |
| Kyle Bennett | 1222 | -9 | -0.66 | 0.19 | -0.85 | 4.3 | 0.32 | -0.01 | 0.33 |
| Chris Lines | 1215 | -7 | -0.52 | 0.12 | -0.64 | 4.2 | 0.31 | -0.01 | 0.32 |
| Joe Partington | 1125 | -1 | -0.08 | -0.06 | -0.02 | 6.3 | 0.50 | -0.07 | 0.57 |
Burton Albion (Actual 9th, xG 5th)
Performance by Match
Performance by Formation
| Starting Formation | Matches | Pts p90 | xPts p90 |
| 4-3-1-2 | 2 | 3.0 | 2.1 |
| 4-1-2-1-2 (Diamond Formation) | 3 | 2.3 | 1.5 |
| 4-1-4-1 | 2 | 1.5 | 1.9 |
| 4-2-3-1 | 4 | 1.5 | 1.5 |
| 4-3-3 | 31 | 1.3 | 1.4 |
| 5-3-2 | 1 | 0.0 | 2.1 |
| 4-4-1-1 | 1 | 0.0 | 1.8 |
| 4-5-1 | 1 | 0.0 | 0.7 |
| 3-5-2 | 1 | 0.0 | 1.4 |
Attacking Performance by Player
| Player | Apps | Mins | GI | G | A | xG | xGp90 |
| Lucas Akins | 45 | 4050 | 20 | 13 | 7 | 12.9 | 0.29 |
| Liam Boyce | 37 | 2941 | 18 | 11 | 7 | 10.7 | 0.33 |
| Jamie Allen | 41 | 3421 | 9 | 7 | 2 | 4.9 | 0.13 |
| Scott Fraser | 42 | 3398 | 8 | 6 | 2 | 6.2 | 0.17 |
| David Templeton | 27 | 1450 | 6 | 5 | 1 | 5.6 | 0.34 |
| John Brayford | 41 | 3458 | 6 | 3 | 3 | 1.0 | 0.02 |
| Kyle McFadzean | 35 | 3111 | 5 | 4 | 1 | 2.8 | 0.08 |
| Marcus Myers-Harness | 30 | 2022 | 5 | 3 | 2 | 1.8 | 0.08 |
| Will Miller | 19 | 696 | 4 | 1 | 3 | 1.6 | 0.20 |
| Ben Fox | 25 | 1376 | 3 | 1 | 2 | 1.6 | 0.11 |
Overall Performance by Player (P=Playing, NP=Not Playing)
| Player | Mins | GD P | GDp90 P | GDp90 NP | Diff | xGD P | xGDp90 P | xGDp90 NP | Diff |
| Team Average | 4140 | 9 | 0.20 | 9.6 | 0.21 | ||||
| Lucas Akins | 4050 | 9 | 0.20 | 0.00 | 0.20 | 10.5 | 0.23 | -0.90 | 1.13 |
| Stephen Quinn | 3494 | 9 | 0.23 | 0.00 | 0.23 | 7.5 | 0.19 | 0.29 | -0.09 |
| John Brayford | 3458 | -2 | -0.05 | 1.45 | -1.50 | 9.1 | 0.24 | 0.06 | 0.18 |
| Jamie Allen | 3421 | 12 | 0.32 | -0.38 | 0.69 | 12.5 | 0.33 | -0.37 | 0.69 |
| Scott Fraser | 3398 | 4 | 0.11 | 0.61 | -0.50 | 6.6 | 0.18 | 0.36 | -0.18 |
| Kyle McFadzean | 3111 | 6 | 0.17 | 0.26 | -0.09 | 10.0 | 0.29 | -0.03 | 0.32 |
| Liam Boyce | 2941 | 2 | 0.06 | 0.53 | -0.46 | 3.4 | 0.10 | 0.46 | -0.36 |
| Bradley Collins | 2745 | 15 | 0.49 | -0.39 | 0.88 | 5.6 | 0.18 | 0.25 | -0.07 |
| Jake Buxton | 2070 | 10 | 0.43 | -0.04 | 0.48 | 2.6 | 0.11 | 0.30 | -0.19 |
| Marcus Myers-Harness | 2022 | 8 | 0.36 | 0.04 | 0.31 | 4.1 | 0.18 | 0.23 | -0.05 |
| Ben Turner | 1699 | 1 | 0.05 | 0.29 | -0.24 | 4.6 | 0.24 | 0.18 | 0.06 |
| Reece Hutchinson | 1511 | 2 | 0.12 | 0.24 | -0.12 | -2.7 | -0.16 | 0.42 | -0.58 |
| Colin Daniel | 1493 | 10 | 0.60 | -0.03 | 0.64 | 3.1 | 0.19 | 0.22 | -0.03 |
| David Templeton | 1450 | 13 | 0.81 | -0.13 | 0.94 | 8.1 | 0.50 | 0.05 | 0.45 |
| Ben Fox | 1376 | 4 | 0.26 | 0.16 | 0.10 | 3.5 | 0.23 | 0.20 | 0.03 |
| Damien McCrory | 1053 | 2 | 0.17 | 0.20 | -0.03 | 7.6 | 0.65 | 0.06 | 0.60 |
| Jake Hesketh | 1040 | -4 | -0.35 | 0.38 | -0.72 | -0.1 | -0.01 | 0.28 | -0.29 |
| Kieran Wallace | 978 | 6 | 0.55 | 0.09 | 0.47 | 3.6 | 0.33 | 0.17 | 0.16 |
Charlton Athletic (Actual 3rd, xG 6th)
Performance by Match
Performance by Formation
| Starting Formation | Matches | Pts p90 | xPts p90 |
| 3-4-3 | 1 | 3.0 | 1.1 |
| 3-4-1-2 | 1 | 3.0 | 1.6 |
| 4-1-2-1-2 (Diamond Formation) | 24 | 2.2 | 1.5 |
| 4-2-3-1 | 3 | 2.0 | 2.2 |
| 4-4-2 (Classic) | 10 | 1.7 | 1.4 |
| 4-3-3 | 2 | 1.5 | 1.3 |
| 3-5-2 | 1 | 1.0 | 1.3 |
| 4-1-3-2 | 2 | 0.5 | 1.4 |
| 4-3-2-1 | 2 | 0.5 | 1.2 |
Attacking Performance by Player
| Player | Apps | Mins | GI | G | A | xG | xGp90 |
| Lyle Taylor | 40 | 3554 | 30 | 21 | 9 | 19.6 | 0.50 |
| Karlan Ahearne-Grant | 28 | 2296 | 18 | 14 | 4 | 11.0 | 0.43 |
| Joe Aribo | 36 | 3113 | 12 | 9 | 3 | 6.3 | 0.18 |
| Ben Reeves | 29 | 1837 | 6 | 4 | 2 | 3.3 | 0.16 |
| Igor Vetokele | 23 | 1056 | 5 | 3 | 2 | 2.5 | 0.22 |
| Krystian Bielik | 31 | 2525 | 5 | 3 | 2 | 1.5 | 0.05 |
| Tarique Fosu-Henry | 27 | 1496 | 5 | 2 | 3 | 3.0 | 0.18 |
| Jason Pearce | 25 | 2224 | 4 | 2 | 2 | 1.9 | 0.08 |
| Josh Cullen | 29 | 2600 | 4 | 1 | 3 | 2.3 | 0.08 |
| Darren Pratley | 28 | 1702 | 3 | 2 | 1 | 1.2 | 0.06 |
Overall Performance by Player (P=Playing, NP=Not Playing)
| Player | Mins | GD P | GDp90 P | GDp90 NP | Diff | xGD P | xGDp90 P | xGDp90 NP | Diff |
| Team Average | 4140 | 33 | 0.72 | 10.7 | 0.23 | ||||
| Lyle Taylor | 3554 | 31 | 0.79 | 0.31 | 0.48 | 8.5 | 0.22 | 0.33 | -0.12 |
| Chris Solly | 3245 | 16 | 0.44 | 1.71 | -1.27 | 3.5 | 0.10 | 0.73 | -0.63 |
| Patrick Bauer | 3116 | 27 | 0.78 | 0.53 | 0.25 | 7.3 | 0.21 | 0.30 | -0.09 |
| Joe Aribo | 3113 | 30 | 0.87 | 0.26 | 0.60 | 9.0 | 0.26 | 0.15 | 0.11 |
| Mahamadou-Naby Sarr | 2814 | 27 | 0.86 | 0.41 | 0.46 | 9.1 | 0.29 | 0.11 | 0.18 |
| Josh Cullen | 2600 | 24 | 0.83 | 0.53 | 0.30 | 10.3 | 0.36 | 0.02 | 0.33 |
| Krystian Bielik | 2525 | 22 | 0.78 | 0.61 | 0.17 | 7.4 | 0.26 | 0.19 | 0.08 |
| Dillon Phillips | 2430 | 22 | 0.81 | 0.58 | 0.24 | 9.4 | 0.35 | 0.07 | 0.28 |
| Karlan Ahearne-Grant | 2296 | 12 | 0.47 | 1.02 | -0.55 | 3.0 | 0.12 | 0.38 | -0.26 |
| Jason Pearce | 2224 | 12 | 0.49 | 0.99 | -0.50 | 3.6 | 0.15 | 0.33 | -0.18 |
| Anfernee Dijksteel | 1971 | 20 | 0.91 | 0.54 | 0.37 | 7.3 | 0.33 | 0.14 | 0.19 |
| Ben Reeves | 1837 | 15 | 0.73 | 0.70 | 0.03 | 9.1 | 0.45 | 0.06 | 0.38 |
| Jed Steer | 1710 | 11 | 0.58 | 0.81 | -0.24 | 1.3 | 0.07 | 0.35 | -0.28 |
| Darren Pratley | 1702 | 2 | 0.11 | 1.14 | -1.04 | 0.1 | 0.01 | 0.39 | -0.38 |
| Ben Purrington | 1665 | 20 | 1.08 | 0.47 | 0.61 | 10.1 | 0.54 | 0.02 | 0.52 |
| Tarique Fosu-Henry | 1496 | 10 | 0.60 | 0.78 | -0.18 | 0.9 | 0.05 | 0.33 | -0.28 |
| George Lapslie | 1156 | 8 | 0.62 | 0.75 | -0.13 | 1.6 | 0.12 | 0.28 | -0.15 |
| Jonathan Williams | 1144 | 9 | 0.71 | 0.72 | -0.01 | 6.5 | 0.51 | 0.13 | 0.38 |
Coventry City (Actual 8th, xG 9th)
Performance by Match
Performance by Formation
| Starting Formation | Matches | Pts p90 | xPts p90 |
| 4-4-2 (Classic) | 13 | 1.8 | 1.4 |
| 4-3-3 | 4 | 1.5 | 1.4 |
| 4-2-3-1 | 23 | 1.3 | 1.4 |
| 4-4-1-1 | 6 | 1.0 | 1.7 |
Attacking Performance by Player
| Player | Apps | Mins | GI | G | A | xG | xGp90 |
| Jordy Hiwula-Mayifuila | 38 | 2953 | 16 | 12 | 4 | 7.3 | 0.22 |
| Amadou Bakayoko | 30 | 1633 | 11 | 7 | 4 | 5.1 | 0.28 |
| Conor Chaplin | 31 | 2091 | 11 | 8 | 3 | 8.9 | 0.38 |
| Bright Enobakhare | 18 | 1489 | 9 | 6 | 3 | 3.9 | 0.24 |
| Luke Thomas | 43 | 3619 | 9 | 4 | 5 | 9.9 | 0.25 |
| Tom Bayliss | 38 | 3182 | 6 | 3 | 3 | 2.9 | 0.08 |
| Jonson Clarke-Harris | 27 | 1790 | 5 | 5 | 5.2 | 0.26 | |
| Dujon Sterling | 38 | 3330 | 4 | 0 | 4 | 0.8 | 0.02 |
| Jordan Shipley | 31 | 1935 | 3 | 3 | 2.4 | 0.11 | |
| Junior Brown | 22 | 1557 | 2 | 0 | 2 | 0.2 | 0.01 |
Overall Performance by Player (P=Playing, NP=Not Playing)
| Player | Mins | GD P | GDp90 P | GDp90 NP | Diff | xGD P | xGDp90 P | xGDp90 NP | Diff |
| Team Average | 4140 | 0 | 0.00 | 4.7 | 0.10 | ||||
| Luke Thomas | 3619 | -1 | -0.02 | 0.17 | -0.20 | 5.1 | 0.13 | -0.07 | 0.19 |
| Lee Burge | 3600 | -2 | -0.05 | 0.33 | -0.38 | 2.0 | 0.05 | 0.46 | -0.41 |
| Dujon Sterling | 3330 | 7 | 0.19 | -0.78 | 0.97 | 2.2 | 0.06 | 0.28 | -0.22 |
| Dominic Hyam | 3310 | -1 | -0.03 | 0.11 | -0.14 | 6.7 | 0.18 | -0.21 | 0.40 |
| Jordan Willis | 3297 | -3 | -0.08 | 0.32 | -0.40 | 1.7 | 0.05 | 0.32 | -0.27 |
| Tom Bayliss | 3182 | 7 | 0.20 | -0.66 | 0.86 | 1.4 | 0.04 | 0.31 | -0.27 |
| Jordy Hiwula-Mayifuila | 2953 | 8 | 0.24 | -0.61 | 0.85 | 5.4 | 0.16 | -0.05 | 0.21 |
| Liam Kelly | 2271 | -1 | -0.04 | 0.05 | -0.09 | 1.9 | 0.08 | 0.14 | -0.06 |
| Brandon Mason | 2111 | 2 | 0.09 | -0.09 | 0.17 | 2.5 | 0.11 | 0.10 | 0.01 |
| Conor Chaplin | 2091 | 1 | 0.04 | -0.04 | 0.09 | 5.0 | 0.22 | -0.01 | 0.23 |
| Jordan Shipley | 1935 | 0 | 0.00 | 0.00 | 0.00 | -3.0 | -0.14 | 0.31 | -0.45 |
| Michael Doyle | 1882 | -4 | -0.19 | 0.16 | -0.35 | 2.0 | 0.10 | 0.11 | -0.01 |
| Tom Davies | 1795 | 1 | 0.05 | -0.04 | 0.09 | 1.8 | 0.09 | 0.11 | -0.02 |
| Jonson Clarke-Harris | 1790 | -9 | -0.45 | 0.34 | -0.80 | 2.9 | 0.14 | 0.07 | 0.07 |
| Amadou Bakayoko | 1633 | 7 | 0.39 | -0.25 | 0.64 | 0.7 | 0.04 | 0.15 | -0.11 |
| Junior Brown | 1557 | -3 | -0.17 | 0.10 | -0.28 | -0.1 | -0.01 | 0.17 | -0.18 |
| Bright Enobakhare | 1489 | 1 | 0.06 | -0.03 | 0.09 | 3.3 | 0.20 | 0.05 | 0.15 |
| Jack Grimmer | 682 | -7 | -0.92 | 0.18 | -1.11 | 1.7 | 0.23 | 0.08 | 0.15 |
Doncaster Rovers (Actual 6th, xG 7th)
Performance by Match
Performance by Formation
| Starting Formation | Matches | Pts p90 | xPts p90 |
| 4-3-3 | 45 | 1.6 | 1.5 |
| 4-4-2 (Classic) | 1 | 0.0 | 0.4 |
Attacking Performance by Player
| Player | Apps | Mins | GI | G | A | xG | xGp90 |
| John Marquis | 44 | 3960 | 25 | 21 | 4 | 16.8 | 0.38 |
| Mallik Wilks | 45 | 3314 | 21 | 14 | 7 | 11.1 | 0.30 |
| James Coppinger | 43 | 3048 | 16 | 4 | 12 | 3.1 | 0.09 |
| Herbie Kane | 38 | 3181 | 10 | 4 | 6 | 3.6 | 0.10 |
| Benjamin Whiteman | 40 | 3459 | 8 | 3 | 5 | 3.2 | 0.08 |
| Ali Crawford | 35 | 2177 | 7 | 3 | 4 | 2.1 | 0.09 |
| Matty Blair | 42 | 2901 | 6 | 3 | 3 | 1.9 | 0.06 |
| Tommy Rowe | 32 | 1732 | 6 | 5 | 1 | 2.4 | 0.12 |
| Alfie May | 34 | 1182 | 5 | 2 | 3 | 4.6 | 0.35 |
| Danny Andrew | 46 | 4116 | 5 | 4 | 1 | 3.3 | 0.07 |
Overall Performance by Player (P=Playing, NP=Not Playing)
| Player | Mins | GD P | GDp90 P | GDp90 NP | Diff | xGD P | xGDp90 P | xGDp90 NP | Diff |
| Team Average | 4140 | 18 | 0.39 | 7.7 | 0.17 | ||||
| Danny Andrew | 4116 | 19 | 0.42 | -3.75 | 4.17 | 8.7 | 0.19 | -3.76 | 3.95 |
| John Marquis | 3960 | 16 | 0.36 | 1.00 | -0.64 | 7.6 | 0.17 | 0.07 | 0.10 |
| Andy Butler | 3570 | 16 | 0.40 | 0.32 | 0.09 | 5.0 | 0.12 | 0.43 | -0.31 |
| Benjamin Whiteman | 3459 | 14 | 0.36 | 0.53 | -0.16 | 9.1 | 0.24 | -0.19 | 0.43 |
| Mallik Wilks | 3314 | 18 | 0.49 | 0.00 | 0.49 | 7.1 | 0.19 | 0.06 | 0.13 |
| Marko Marosi | 3240 | 5 | 0.14 | 1.30 | -1.16 | 5.3 | 0.15 | 0.24 | -0.09 |
| Herbie Kane | 3181 | 14 | 0.40 | 0.38 | 0.02 | 11.4 | 0.32 | -0.35 | 0.67 |
| James Coppinger | 3048 | 15 | 0.44 | 0.25 | 0.20 | 4.2 | 0.12 | 0.29 | -0.17 |
| Matty Blair | 2901 | 15 | 0.47 | 0.22 | 0.25 | 7.2 | 0.22 | 0.04 | 0.19 |
| Ali Crawford | 2177 | 15 | 0.62 | 0.14 | 0.48 | 0.4 | 0.02 | 0.34 | -0.32 |
| Tom Anderson | 1878 | 14 | 0.67 | 0.16 | 0.51 | 10.8 | 0.52 | -0.12 | 0.64 |
| Tommy Rowe | 1732 | 7 | 0.36 | 0.41 | -0.05 | -0.5 | -0.03 | 0.31 | -0.33 |
| Niall Mason | 1683 | 1 | 0.05 | 0.62 | -0.57 | 3.0 | 0.16 | 0.17 | -0.01 |
| Paul Downing | 1488 | 3 | 0.18 | 0.51 | -0.33 | 1.2 | 0.07 | 0.22 | -0.15 |
| Joe Wright | 1345 | 0 | 0.00 | 0.58 | -0.58 | -2.0 | -0.13 | 0.31 | -0.45 |
| Alfie May | 1182 | 6 | 0.46 | 0.37 | 0.09 | 4.1 | 0.31 | 0.11 | 0.20 |
| Ian Lawlor | 900 | 13 | 1.30 | 0.14 | 1.16 | 2.4 | 0.24 | 0.15 | 0.09 |
| Kieran Sadlier | 606 | 9 | 1.34 | 0.23 | 1.11 | 2.0 | 0.30 | 0.14 | 0.15 |
Fleetwood Town (Actual 11th, xG 15th)
Performance by Match
Performance by Formation
| Starting Formation | Matches | Pts p90 | xPts p90 |
| 3-4-3 | 1 | 3.0 | 1.8 |
| 4-4-2 (Classic) | 23 | 1.4 | 1.2 |
| 4-3-3 | 20 | 1.3 | 1.4 |
| 4-2-3-1 | 1 | 0.0 | 0.7 |
| 3-5-2 | 1 | 0.0 | 1.0 |
Attacking Performance by Player
| Player | Apps | Mins | GI | G | A | xG | xGp90 |
| Paddy Madden | 44 | 3536 | 22 | 15 | 7 | 10.3 | 0.26 |
| Ched Evans | 39 | 3273 | 21 | 17 | 4 | 12.1 | 0.33 |
| Ashley Hunter | 42 | 2648 | 18 | 8 | 10 | 5.1 | 0.17 |
| Wes Burns | 39 | 3098 | 9 | 7 | 2 | 3.7 | 0.11 |
| Ross Wallace | 36 | 2895 | 6 | 1 | 5 | 1.4 | 0.04 |
| Ashley Nadesan | 20 | 1098 | 4 | 1 | 3 | 2.2 | 0.18 |
| James Wallace | 18 | 964 | 4 | 1 | 3 | 0.6 | 0.05 |
| Lewie Coyle | 41 | 3667 | 3 | 0 | 3 | 1.2 | 0.03 |
| Ashley Eastham | 45 | 3884 | 2 | 2 | 1.7 | 0.04 | |
| Cian Bolger | 10 | 572 | 2 | 1 | 1 | 0.4 | 0.06 |
Overall Performance by Player (P=Playing, NP=Not Playing)
| Player | Mins | GD P | GDp90 P | GDp90 NP | Diff | xGD P | xGDp90 P | xGDp90 NP | Diff |
| Team Average | 4140 | 6 | 0.13 | -2.9 | -0.06 | ||||
| Alex Cairns | 4140 | 6 | 0.13 | -2.9 | -0.06 | ||||
| Ashley Eastham | 3884 | 3 | 0.07 | 1.05 | -0.99 | -1.0 | -0.02 | -0.65 | 0.63 |
| Lewie Coyle | 3667 | 7 | 0.17 | -0.19 | 0.36 | -5.0 | -0.12 | 0.41 | -0.54 |
| Paddy Madden | 3536 | 12 | 0.31 | -0.89 | 1.20 | -0.6 | -0.01 | -0.34 | 0.32 |
| Ched Evans | 3273 | 6 | 0.16 | 0.00 | 0.16 | -1.7 | -0.05 | -0.12 | 0.07 |
| Wes Burns | 3098 | 2 | 0.06 | 0.35 | -0.29 | 0.4 | 0.01 | -0.28 | 0.29 |
| Ross Wallace | 2895 | -3 | -0.09 | 0.65 | -0.74 | 1.1 | 0.03 | -0.29 | 0.32 |
| James Husband | 2690 | 8 | 0.27 | -0.12 | 0.39 | -1.7 | -0.06 | -0.07 | 0.02 |
| Ashley Hunter | 2648 | 14 | 0.48 | -0.48 | 0.96 | -0.1 | 0.00 | -0.17 | 0.16 |
| Jason Holt | 2376 | 8 | 0.30 | -0.10 | 0.41 | -2.0 | -0.08 | -0.04 | -0.03 |
| Craig Morgan | 1893 | 8 | 0.38 | -0.08 | 0.46 | -1.9 | -0.09 | -0.04 | -0.06 |
| Nathan Sheron | 1613 | -3 | -0.17 | 0.32 | -0.49 | -1.5 | -0.09 | -0.05 | -0.04 |
| Dean Marney | 1240 | 9 | 0.65 | -0.09 | 0.75 | -6.0 | -0.44 | 0.10 | -0.54 |
| Ashley Nadesan | 1098 | 1 | 0.08 | 0.15 | -0.07 | 4.0 | 0.33 | -0.20 | 0.53 |
| Harry Souttar | 990 | 0 | 0.00 | 0.17 | -0.17 | 2.6 | 0.24 | -0.16 | 0.39 |
| Jack Sowerby | 971 | 2 | 0.19 | 0.11 | 0.07 | 1.3 | 0.12 | -0.12 | 0.23 |
| James Wallace | 964 | 7 | 0.65 | -0.03 | 0.68 | 1.7 | 0.16 | -0.13 | 0.28 |
| Harrison Biggins | 881 | -4 | -0.41 | 0.28 | -0.68 | -0.7 | -0.07 | -0.06 | -0.01 |
Gillingham (Actual 13th, xG 24th)
Performance by Match
Performance by Formation
| Starting Formation | Matches | Pts p90 | xPts p90 |
| 4-4-2 (Classic) | 3 | 2.0 | 0.9 |
| 4-3-1-2 | 10 | 1.7 | 1.3 |
| 3-4-1-2 | 2 | 1.5 | 1.1 |
| 4-1-2-1-2 (Diamond Formation) | 20 | 1.2 | 1.2 |
| 3-5-2 | 4 | 1.0 | 1.0 |
| 4-3-3 | 5 | 0.4 | 1.2 |
| 4-1-3-2 | 1 | 0.0 | 0.7 |
| 4-2-3-1 | 1 | 0.0 | 0.4 |
Performance by Manager
| Managerial Record | Matches | Pts p90 | Rank | xPts p90 | Rank |
| Steve Lovell | 44 | 1.2 | 1.2 | ||
| Mark Patterson | 2 | 1.5 | 1.1 |
Attacking Performance by Player
| Player | Apps | Mins | GI | G | A | xG | xGp90 |
| Thomas Eaves | 43 | 3369 | 23 | 21 | 2 | 13.1 | 0.35 |
| Brandon Hanlan | 39 | 2935 | 11 | 9 | 2 | 7.7 | 0.24 |
| Luke O Neill | 38 | 3011 | 9 | 3 | 6 | 2.6 | 0.08 |
| Mark Byrne | 45 | 3926 | 9 | 4 | 5 | 2.6 | 0.06 |
| Elliott List | 36 | 1880 | 8 | 5 | 3 | 3.8 | 0.18 |
| Callum Reilly | 25 | 1675 | 7 | 5 | 2 | 3.5 | 0.19 |
| Dean Parrett | 25 | 1593 | 5 | 1 | 4 | 1.2 | 0.07 |
| Josh Parker | 21 | 1641 | 5 | 4 | 1 | 2.5 | 0.13 |
| Max Ehmer | 40 | 3490 | 4 | 1 | 3 | 1.8 | 0.05 |
| Regan Charles-Cook | 26 | 1458 | 4 | 3 | 1 | 2.8 | 0.17 |
Overall Performance by Player (P=Playing, NP=Not Playing)
| Player | Mins | GD P | GDp90 P | GDp90 NP | Diff | xGD P | xGDp90 P | xGDp90 NP | Diff |
| Team Average | 4140 | -11 | -0.24 | -18.9 | -0.41 | ||||
| Tomas Holy | 4140 | -11 | -0.24 | -18.9 | -0.41 | ||||
| Mark Byrne | 3926 | -8 | -0.18 | -1.26 | 1.08 | -16.1 | -0.37 | -1.17 | 0.80 |
| Max Ehmer | 3490 | -4 | -0.10 | -0.97 | 0.87 | -12.6 | -0.32 | -0.88 | 0.56 |
| Thomas Eaves | 3369 | -12 | -0.32 | 0.12 | -0.44 | -14.7 | -0.39 | -0.49 | 0.10 |
| Barry Fuller | 3272 | -8 | -0.22 | -0.31 | 0.09 | -16.3 | -0.45 | -0.27 | -0.17 |
| Luke O Neill | 3011 | -10 | -0.30 | -0.08 | -0.22 | -10.4 | -0.31 | -0.68 | 0.36 |
| Brandon Hanlan | 2935 | -2 | -0.06 | -0.67 | 0.61 | -10.5 | -0.32 | -0.63 | 0.30 |
| Connor Ogilvie | 2641 | -9 | -0.31 | -0.12 | -0.19 | -14.4 | -0.49 | -0.27 | -0.22 |
| Gabriel Zakuani | 2462 | -10 | -0.37 | -0.05 | -0.31 | -14.3 | -0.52 | -0.25 | -0.27 |
| Elliott List | 1880 | -14 | -0.67 | 0.12 | -0.79 | -11.1 | -0.53 | -0.31 | -0.22 |
| Callum Reilly | 1675 | -7 | -0.38 | -0.15 | -0.23 | -14.7 | -0.79 | -0.15 | -0.64 |
| Josh Parker | 1641 | -7 | -0.38 | -0.14 | -0.24 | -12.1 | -0.66 | -0.24 | -0.42 |
| Dean Parrett | 1593 | -6 | -0.34 | -0.18 | -0.16 | -3.9 | -0.22 | -0.53 | 0.31 |
| Regan Charles-Cook | 1458 | 2 | 0.12 | -0.44 | 0.56 | -4.7 | -0.29 | -0.48 | 0.18 |
| Bradley Garmston | 1408 | -2 | -0.13 | -0.30 | 0.17 | -5.9 | -0.37 | -0.43 | 0.06 |
| Billy Bingham | 1171 | -4 | -0.31 | -0.21 | -0.10 | -5.3 | -0.41 | -0.41 | 0.00 |
| Alex Lacey | 1122 | -7 | -0.56 | -0.12 | -0.44 | -10.6 | -0.85 | -0.25 | -0.60 |
| Leonardo Da Silva Lopes | 1015 | 3 | 0.27 | -0.40 | 0.67 | -1.2 | -0.11 | -0.51 | 0.40 |
Luton Town (Actual 1st, xG 2nd)
Performance by Match
Performance by Formation
| Starting Formation | Matches | Pts p90 | xPts p90 |
| 4-4-1-1 | 1 | 3.0 | 2.1 |
| 4-3-1-2 | 13 | 2.4 | 1.9 |
| 4-1-2-1-2 (Diamond Formation) | 26 | 2.2 | 1.7 |
| 4-3-3 | 2 | 0.5 | 1.9 |
| 4-4-2 (Classic) | 2 | 0.5 | 1.5 |
| 5-3-2 | 2 | 0.5 | 1.3 |
Performance by Manager
| Managerial Record | Matches | Pts p90 | Rank | xPts p90 | Rank |
| Nathan Jones | 26 | 2.0 | 1st | 1.6 | 2nd |
| Mick Harford | 20 | 2.1 | 1st | 1.8 | 1st |
Attacking Performance by Player
| Player | Apps | Mins | GI | G | A | xG | xGp90 |
| James Collins | 43 | 3768 | 28 | 25 | 3 | 17.8 | 0.42 |
| Elliot Lee | 38 | 3014 | 15 | 12 | 3 | 11.1 | 0.33 |
| Jack Stacey | 45 | 4050 | 12 | 4 | 8 | 1.7 | 0.04 |
| Pelly Ruddock | 46 | 4125 | 11 | 5 | 6 | 3.7 | 0.08 |
| Danny Hylton | 25 | 1611 | 9 | 8 | 1 | 6.6 | 0.37 |
| Harry Cornick | 31 | 1351 | 9 | 6 | 3 | 3.8 | 0.25 |
| James Justin | 41 | 3248 | 9 | 3 | 6 | 3.1 | 0.09 |
| Andrew Shinnie | 41 | 3407 | 8 | 4 | 4 | 3.1 | 0.08 |
| Matty Pearson | 46 | 4082 | 8 | 6 | 2 | 3.5 | 0.08 |
| George Moncur | 14 | 472 | 6 | 6 | 1.9 | 0.36 |
Overall Performance by Player (P=Playing, NP=Not Playing)
| Player | Mins | GD P | GDp90 P | GDp90 NP | Diff | xGD P | xGDp90 P | xGDp90 NP | Diff |
| Team Average | 4140 | 48 | 1.04 | 28.6 | 0.62 | ||||
| Pelly Ruddock | 4125 | 47 | 1.03 | 6.00 | -4.97 | 28.3 | 0.62 | 1.97 | -1.35 |
| Matty Pearson | 4082 | 47 | 1.04 | 1.55 | -0.52 | 27.4 | 0.60 | 1.81 | -1.21 |
| Jack Stacey | 4050 | 49 | 1.09 | -1.00 | 2.09 | 28.5 | 0.63 | 0.10 | 0.53 |
| Sonny Bradley | 3960 | 49 | 1.11 | -0.50 | 1.61 | 28.2 | 0.64 | 0.21 | 0.43 |
| James Collins | 3768 | 44 | 1.05 | 0.97 | 0.08 | 25.6 | 0.61 | 0.71 | -0.10 |
| James Shea | 3690 | 48 | 1.17 | 0.00 | 1.17 | 22.9 | 0.56 | 1.13 | -0.57 |
| Andrew Shinnie | 3407 | 50 | 1.32 | -0.25 | 1.57 | 25.2 | 0.67 | 0.41 | 0.26 |
| James Justin | 3248 | 44 | 1.22 | 0.40 | 0.82 | 21.3 | 0.59 | 0.73 | -0.14 |
| Elliot Lee | 3014 | 24 | 0.72 | 1.92 | -1.20 | 20.2 | 0.60 | 0.67 | -0.07 |
| Glen Rea | 1787 | 23 | 1.16 | 0.96 | 0.20 | 11.6 | 0.58 | 0.65 | -0.07 |
| Danny Hylton | 1611 | 16 | 0.89 | 1.14 | -0.24 | 9.6 | 0.54 | 0.67 | -0.14 |
| Alan McCormack | 1416 | 16 | 1.02 | 1.06 | -0.04 | 10.4 | 0.66 | 0.60 | 0.06 |
| Harry Cornick | 1351 | 22 | 1.47 | 0.84 | 0.63 | 7.2 | 0.48 | 0.69 | -0.21 |
| Dan Potts | 1340 | 5 | 0.34 | 1.38 | -1.05 | 7.7 | 0.52 | 0.67 | -0.16 |
| Luke Berry | 1117 | 15 | 1.21 | 0.98 | 0.23 | 11.4 | 0.92 | 0.51 | 0.40 |
| Jorge Grant | 1072 | 8 | 0.67 | 1.17 | -0.50 | 7.5 | 0.63 | 0.62 | 0.01 |
| Kazenga Lua Lua | 980 | 17 | 1.56 | 0.88 | 0.68 | 14.4 | 1.32 | 0.40 | 0.92 |
| George Moncur | 472 | 5 | 0.95 | 1.06 | -0.10 | -0.7 | -0.12 | 0.72 | -0.84 |
Oxford United (Actual 12th, xG 12th)
Performance by Match
Performance by Formation
| Starting Formation | Matches | Pts p90 | xPts p90 |
| 4-1-4-1 | 1 | 3.0 | 1.4 |
| 4-2-3-1 | 28 | 1.6 | 1.5 |
| 4-1-2-1-2 (Diamond Formation) | 1 | 1.0 | 0.8 |
| 4-3-3 | 15 | 0.7 | 1.2 |
Attacking Performance by Player
| Player | Apps | Mins | GI | G | A | xG | xGp90 |
| James Henry | 44 | 3359 | 16 | 11 | 5 | 7.7 | 0.21 |
| Gavin Whyte | 36 | 2728 | 10 | 7 | 3 | 3.6 | 0.12 |
| Jamie Mackie | 39 | 2529 | 10 | 5 | 5 | 4.9 | 0.18 |
| Cameron Brannagan | 41 | 3573 | 9 | 3 | 6 | 2.7 | 0.07 |
| Luke Garbutt | 24 | 1526 | 9 | 4 | 5 | 2.3 | 0.14 |
| Marcus Browne | 33 | 2150 | 9 | 6 | 3 | 5.0 | 0.21 |
| Jerome Sinclair | 16 | 942 | 5 | 3 | 2 | 3.0 | 0.29 |
| Josh Ruffels | 44 | 3699 | 5 | 4 | 1 | 2.4 | 0.06 |
| Curtis Nelson | 46 | 4140 | 4 | 4 | 5.5 | 0.12 | |
| John Mousinho | 35 | 2765 | 3 | 2 | 1 | 2.3 | 0.08 |
Overall Performance by Player (P=Playing, NP=Not Playing)
| Player | Mins | GD P | GDp90 P | GDp90 NP | Diff | xGD P | xGDp90 P | xGDp90 NP | Diff |
| .Team Average | 4140 | -6 | -0.13 | 3.7 | 0.08 | ||||
| Curtis Nelson | 4140 | -6 | -0.13 | 3.7 | 0.08 | ||||
| Josh Ruffels | 3699 | -1 | -0.02 | -1.02 | 1.00 | 6.0 | 0.15 | -0.47 | 0.62 |
| Cameron Brannagan | 3573 | -5 | -0.13 | -0.16 | 0.03 | 4.2 | 0.11 | -0.09 | 0.19 |
| James Henry | 3359 | -2 | -0.05 | -0.46 | 0.41 | 9.8 | 0.26 | -0.71 | 0.97 |
| Robert Dickie | 3170 | -3 | -0.09 | -0.28 | 0.19 | 2.0 | 0.06 | 0.15 | -0.09 |
| Simon Eastwood | 3150 | -1 | -0.03 | -0.45 | 0.43 | 5.7 | 0.16 | -0.18 | 0.34 |
| John Mousinho | 2765 | 1 | 0.03 | -0.46 | 0.49 | 6.7 | 0.22 | -0.20 | 0.41 |
| Gavin Whyte | 2728 | 1 | 0.03 | -0.45 | 0.48 | 8.1 | 0.27 | -0.28 | 0.55 |
| Jamie Mackie | 2529 | -6 | -0.21 | 0.00 | -0.21 | 1.5 | 0.05 | 0.12 | -0.06 |
| Marcus Browne | 2150 | -8 | -0.33 | 0.09 | -0.43 | 0.7 | 0.03 | 0.13 | -0.10 |
| Jamie Hanson | 2051 | -9 | -0.39 | 0.13 | -0.52 | 5.0 | 0.22 | -0.06 | 0.27 |
| Luke Garbutt | 1526 | -8 | -0.47 | 0.07 | -0.54 | -6.2 | -0.37 | 0.34 | -0.71 |
| Sam Long | 1469 | 6 | 0.37 | -0.40 | 0.77 | 1.6 | 0.10 | 0.07 | 0.03 |
| Ricky Holmes | 1123 | 0 | 0.00 | -0.18 | 0.18 | 0.8 | 0.06 | 0.09 | -0.02 |
| Jordan Graham | 1113 | 0 | 0.00 | -0.18 | 0.18 | 4.0 | 0.32 | -0.01 | 0.34 |
| Jerome Sinclair | 942 | 6 | 0.57 | -0.34 | 0.91 | 2.2 | 0.21 | 0.04 | 0.17 |
| Jonathan Mitchell | 900 | -6 | -0.60 | 0.00 | -0.60 | -0.8 | -0.08 | 0.12 | -0.20 |
| Tony McMahon | 900 | -5 | -0.50 | -0.03 | -0.47 | -5.2 | -0.52 | 0.25 | -0.76 |
Peterborough United (Actual 7th, xG 17th)
Performance by Match
Performance by Formation
| Starting Formation | Matches | Pts p90 | xPts p90 |
| 4-1-3-2 | 1 | 3.0 | 1.4 |
| 4-4-2 (Classic) | 30 | 1.9 | 1.3 |
| 4-3-1-2 | 2 | 1.5 | 1.3 |
| 4-5-1 | 2 | 1.5 | 1.3 |
| 4-4-1-1 | 3 | 1.0 | 1.5 |
| 4-1-2-1-2 (Diamond Formation) | 6 | 0.5 | 1.2 |
| 4-2-3-1 | 2 | 0.5 | 0.9 |
Performance by Manager
| Managerial Record | Matches | Pts p90 | Rank | xPts p90 | Rank |
| Steve Evans | 29 | 1.7 | 6th | 1.3 | 16th |
| Darren Ferguson | 17 | 1.4 | th | 1.2 | 16th |
Attacking Performance by Player
| Player | Apps | Mins | GI | G | A | xG | xGp90 |
| Ivan Toney | 44 | 3111 | 23 | 16 | 7 | 12.9 | 0.37 |
| Marcus Maddison | 40 | 2902 | 22 | 7 | 15 | 6.4 | 0.20 |
| Matthew Godden | 37 | 2511 | 17 | 14 | 3 | 8.0 | 0.29 |
| Jason Cummings | 21 | 951 | 11 | 6 | 5 | 5.5 | 0.52 |
| Siriki Dembele | 38 | 2527 | 11 | 5 | 6 | 3.4 | 0.12 |
| Joe Ward | 43 | 3133 | 7 | 4 | 3 | 1.8 | 0.05 |
| Jason Naismith | 43 | 3708 | 4 | 1 | 3 | 1.6 | 0.04 |
| Mark O Hara | 21 | 1312 | 4 | 4 | 1.4 | 0.10 | |
| Rhys Bennett | 37 | 3240 | 4 | 4 | 2.0 | 0.06 | |
| Lee Tomlin | 18 | 1032 | 3 | 2 | 1 | 2.1 | 0.18 |
Overall Performance by Player (P=Playing, NP=Not Playing)
| Player | Mins | GD P | GDp90 P | GDp90 NP | Diff | xGD P | xGDp90 P | xGDp90 NP | Diff |
| Team Average | 4140 | 8 | 0.17 | -8.8 | -0.19 | ||||
| Jason Naismith | 3708 | 6 | 0.15 | 0.42 | -0.27 | -10.2 | -0.25 | 0.31 | -0.56 |
| Alex Woodyard | 3691 | 12 | 0.29 | -0.80 | 1.09 | -8.0 | -0.20 | -0.15 | -0.04 |
| Ryan Tafazolli | 3268 | 14 | 0.39 | -0.62 | 1.00 | -3.1 | -0.09 | -0.58 | 0.49 |
| Rhys Bennett | 3240 | 10 | 0.28 | -0.20 | 0.48 | -9.3 | -0.26 | 0.05 | -0.31 |
| Joe Ward | 3133 | 8 | 0.23 | 0.00 | 0.23 | -6.2 | -0.18 | -0.23 | 0.05 |
| Ivan Toney | 3111 | -2 | -0.06 | 0.87 | -0.93 | -6.9 | -0.20 | -0.16 | -0.04 |
| Marcus Maddison | 2902 | 1 | 0.03 | 0.51 | -0.48 | -2.7 | -0.08 | -0.44 | 0.36 |
| Aaron Chapman | 2880 | 14 | 0.44 | -0.43 | 0.87 | -4.7 | -0.15 | -0.29 | 0.14 |
| Siriki Dembele | 2527 | 18 | 0.64 | -0.56 | 1.20 | -4.5 | -0.16 | -0.24 | 0.07 |
| Matthew Godden | 2511 | 4 | 0.14 | 0.22 | -0.08 | -2.3 | -0.08 | -0.36 | 0.27 |
| Colin Daniel | 1730 | 12 | 0.62 | -0.15 | 0.77 | -4.9 | -0.26 | -0.14 | -0.11 |
| Louis Reed | 1727 | -4 | -0.21 | 0.45 | -0.66 | -2.2 | -0.11 | -0.25 | 0.13 |
| Daniel Lafferty | 1576 | -1 | -0.06 | 0.32 | -0.37 | -1.5 | -0.09 | -0.25 | 0.16 |
| Mark O Hara | 1312 | 9 | 0.62 | -0.03 | 0.65 | -5.2 | -0.35 | -0.11 | -0.24 |
| Ben White | 1262 | -6 | -0.43 | 0.44 | -0.87 | -4.3 | -0.30 | -0.14 | -0.16 |
| Conor O Malley | 1260 | -6 | -0.43 | 0.44 | -0.87 | -4.0 | -0.29 | -0.15 | -0.14 |
| Lee Tomlin | 1032 | 4 | 0.35 | 0.12 | 0.23 | 0.3 | 0.02 | -0.26 | 0.29 |
| Jason Cummings | 951 | 12 | 1.14 | -0.11 | 1.25 | -2.3 | -0.22 | -0.18 | -0.03 |
Plymouth Argyle (Actual 21st, xG 22nd)
Performance by Match
Performance by Formation
| Starting Formation | Matches | Pts p90 | xPts p90 |
| 4-1-2-1-2 (Diamond Formation) | 1 | 3.0 | 1.9 |
| 4-3-3 | 12 | 1.3 | 1.2 |
| 4-2-3-1 | 26 | 1.2 | 1.2 |
| 4-5-1 | 1 | 1.0 | 0.7 |
| 4-1-4-1 | 6 | 0.2 | 0.9 |
Performance by Manager
| Managerial Record | Matches | Pts p90 | Rank | xPts p90 | Rank |
| Derek Adams | 45 | 1.0 | 1.2 | ||
| Kevin Nancekivell | 1 | 3.0 | 1.3 |
Attacking Performance by Player
| Player | Apps | Mins | GI | G | A | xG | xGp90 |
| Freddie Ladapo | 45 | 3713 | 21 | 18 | 3 | 12.5 | 0.30 |
| Graham Carey | 44 | 3821 | 17 | 6 | 11 | 10.5 | 0.25 |
| Ruben Lameiras | 41 | 2795 | 17 | 11 | 6 | 6.1 | 0.20 |
| Antoni Sarcevic | 37 | 3210 | 7 | 3 | 4 | 5.5 | 0.15 |
| David Fox | 43 | 3476 | 5 | 1 | 4 | 2.2 | 0.06 |
| Joel Grant | 17 | 1157 | 5 | 4 | 1 | 2.9 | 0.22 |
| Ryan Edwards | 36 | 3145 | 5 | 5 | 2.8 | 0.08 | |
| Ashley Smith-Brown | 31 | 2643 | 3 | 1 | 2 | 0.8 | 0.03 |
| Conor Grant | 10 | 765 | 3 | 0 | 3 | 0.5 | 0.05 |
| Niall Canavan | 33 | 2560 | 2 | 2 | 1.3 | 0.05 |
Overall Performance by Player (P=Playing, NP=Not Playing)
| Player | Mins | GD P | GDp90 P | GDp90 NP | Diff | xGD P | xGDp90 P | xGDp90 NP | Diff |
| Team Average | 4140 | -24 | -0.52 | -14.7 | -0.32 | ||||
| Graham Carey | 3821 | -24 | -0.57 | 0.00 | -0.57 | -13.3 | -0.31 | -0.41 | 0.10 |
| Freddie Ladapo | 3713 | -17 | -0.41 | -1.48 | 1.06 | -12.4 | -0.30 | -0.48 | 0.18 |
| David Fox | 3476 | -13 | -0.34 | -1.49 | 1.15 | -8.6 | -0.22 | -0.83 | 0.61 |
| Yann Songo o | 3295 | -18 | -0.49 | -0.64 | 0.15 | -14.3 | -0.39 | -0.05 | -0.34 |
| Antoni Sarcevic | 3210 | -14 | -0.39 | -0.97 | 0.58 | -6.3 | -0.18 | -0.82 | 0.64 |
| Ryan Edwards | 3145 | -16 | -0.46 | -0.72 | 0.27 | -13.0 | -0.37 | -0.15 | -0.22 |
| Matt Macey | 2953 | -29 | -0.88 | 0.38 | -1.26 | -11.6 | -0.35 | -0.24 | -0.11 |
| Ruben Lameiras | 2795 | -7 | -0.23 | -1.14 | 0.91 | -10.2 | -0.33 | -0.30 | -0.03 |
| Gary Sawyer | 2650 | -12 | -0.41 | -0.72 | 0.32 | -8.0 | -0.27 | -0.41 | 0.14 |
| Ashley Smith-Brown | 2643 | -12 | -0.41 | -0.72 | 0.31 | -8.9 | -0.30 | -0.35 | 0.04 |
| Niall Canavan | 2560 | -3 | -0.11 | -1.20 | 1.09 | -1.8 | -0.06 | -0.74 | 0.68 |
| Jamie Ness | 1547 | -18 | -1.05 | -0.21 | -0.84 | -5.4 | -0.31 | -0.33 | 0.01 |
| Tafari Moore | 1241 | -9 | -0.65 | -0.47 | -0.19 | -7.8 | -0.56 | -0.22 | -0.35 |
| Kyle Letheren | 1160 | 4 | 0.31 | -0.85 | 1.16 | -3.8 | -0.29 | -0.33 | 0.04 |
| Joel Grant | 1157 | -4 | -0.31 | -0.60 | 0.29 | -2.3 | -0.18 | -0.38 | 0.20 |
| Ryan Taylor | 1068 | -20 | -1.69 | -0.12 | -1.57 | -5.0 | -0.42 | -0.29 | -0.13 |
| Joe Riley | 1054 | -7 | -0.60 | -0.50 | -0.10 | 1.5 | 0.13 | -0.47 | 0.60 |
| Conor Grant | 765 | -4 | -0.47 | -0.53 | 0.06 | -3.4 | -0.41 | -0.30 | -0.10 |
Portsmouth (Actual 4th, xG 3rd)
Performance by Match
Performance by Formation
| Starting Formation | Matches | Pts p90 | xPts p90 |
| 4-4-2 (Classic) | 5 | 2.6 | 1.1 |
| 4-3-3 | 3 | 2.3 | 1.7 |
| 4-2-3-1 | 38 | 1.8 | 1.5 |
Attacking Performance by Player
| Player | Apps | Mins | GI | G | A | xG | xGp90 |
| Jamal Lowe | 45 | 3921 | 23 | 15 | 8 | 10.9 | 0.25 |
| Ronan Curtis | 41 | 3206 | 19 | 11 | 8 | 8.5 | 0.24 |
| Brett Pitman | 32 | 1645 | 16 | 11 | 5 | 7.2 | 0.39 |
| Gareth Evans | 41 | 2921 | 16 | 10 | 6 | 7.1 | 0.22 |
| Oliver Hawkins | 38 | 2405 | 13 | 7 | 6 | 7.7 | 0.29 |
| Ben Close | 34 | 2305 | 8 | 8 | 3.5 | 0.14 | |
| Ben Thompson | 23 | 1703 | 5 | 2 | 3 | 2.3 | 0.12 |
| Tom Naylor | 43 | 3870 | 5 | 4 | 1 | 3.8 | 0.09 |
| Lee Brown | 44 | 3880 | 4 | 0 | 4 | 1.0 | 0.02 |
| Matthew Clarke | 46 | 4135 | 4 | 3 | 1 | 3.0 | 0.06 |
Overall Performance by Player (P=Playing, NP=Not Playing)
| Player | Mins | GD P | GDp90 P | GDp90 NP | Diff | xGD P | xGDp90 P | xGDp90 NP | Diff |
| Team Average | 4140 | 32 | 0.70 | 13.6 | 0.30 | ||||
| Craig MacGillivray | 4140 | 32 | 0.70 | 13.6 | 0.30 | ||||
| Matthew Clarke | 4135 | 31 | 0.67 | 18.00 | -17.33 | 13.4 | 0.29 | 4.68 | -4.39 |
| Jamal Lowe | 3921 | 34 | 0.78 | -0.82 | 1.60 | 14.6 | 0.33 | -0.38 | 0.72 |
| Lee Brown | 3880 | 28 | 0.65 | 1.38 | -0.74 | 12.2 | 0.28 | 0.48 | -0.20 |
| Tom Naylor | 3870 | 32 | 0.74 | 0.00 | 0.74 | 13.0 | 0.30 | 0.20 | 0.10 |
| Ronan Curtis | 3206 | 24 | 0.67 | 0.77 | -0.10 | 12.2 | 0.34 | 0.13 | 0.21 |
| Gareth Evans | 2921 | 23 | 0.71 | 0.66 | 0.04 | 8.1 | 0.25 | 0.41 | -0.16 |
| Nathan Thompson | 2686 | 24 | 0.80 | 0.50 | 0.31 | 18.5 | 0.62 | -0.30 | 0.92 |
| Oliver Hawkins | 2405 | 17 | 0.64 | 0.78 | -0.14 | 8.3 | 0.31 | 0.28 | 0.03 |
| Ben Close | 2305 | 17 | 0.66 | 0.74 | -0.07 | 9.0 | 0.35 | 0.23 | 0.12 |
| Jack Whatmough | 2234 | 16 | 0.64 | 0.76 | -0.11 | 6.3 | 0.26 | 0.34 | -0.09 |
| Christian Burgess | 1936 | 16 | 0.74 | 0.65 | 0.09 | 7.3 | 0.34 | 0.26 | 0.08 |
| Ben Thompson | 1703 | 18 | 0.95 | 0.52 | 0.43 | 7.8 | 0.41 | 0.21 | 0.20 |
| Brett Pitman | 1645 | 18 | 0.98 | 0.51 | 0.48 | 7.3 | 0.40 | 0.23 | 0.17 |
| Anton Walkes | 1496 | 8 | 0.48 | 0.82 | -0.34 | -5.7 | -0.35 | 0.66 | -1.00 |
| Omar Bogle | 678 | 11 | 1.46 | 0.55 | 0.91 | 4.2 | 0.55 | 0.25 | 0.31 |
| Bryn Morris | 442 | 0 | 0.00 | 0.78 | -0.78 | -1.9 | -0.39 | 0.38 | -0.77 |
| Viv Solomon-Otabor | 421 | 3 | 0.64 | 0.70 | -0.06 | 1.9 | 0.41 | 0.28 | 0.12 |
Rochdale (Actual 16th, xG 21st)
Performance by Match
Performance by Formation
| Starting Formation | Matches | Pts p90 | xPts p90 |
| 4-4-1-1 | 1 | 3.0 | 1.0 |
| 3-4-3 | 6 | 2.2 | 1.1 |
| 4-1-3-2 | 2 | 1.5 | 1.4 |
| 4-3-3 | 18 | 1.3 | 1.1 |
| 4-4-2 (Classic) | 7 | 0.9 | 1.3 |
| 3-5-2 | 5 | 0.8 | 1.3 |
| 4-2-3-1 | 2 | 0.5 | 1.1 |
| 3-4-1-2 | 1 | 0.0 | 2.3 |
| 5-4-1 | 2 | 0.0 | 0.7 |
| 5-3-2 | 2 | 0.0 | 0.6 |
Performance by Manager
| Managerial Record | Matches | Pts p90 | Rank | xPts p90 | Rank |
| Keith Hill | 35 | 1.0 | 23rd | 1.2 | 20th |
| Brian Barry-Murphy | 11 | 1.8 | 6th | 1.1 | 24th |
Attacking Performance by Player
| Player | Apps | Mins | GI | G | A | xG | xGp90 |
| Ian Henderson | 45 | 3991 | 26 | 20 | 6 | 13.8 | 0.31 |
| Aaron Wilbraham | 23 | 1434 | 7 | 4 | 3 | 3.4 | 0.22 |
| Bradden Inman | 28 | 1557 | 7 | 4 | 3 | 3.1 | 0.18 |
| Calvin Andrew | 38 | 1762 | 6 | 3 | 3 | 4.1 | 0.21 |
| Callum Camps | 41 | 3531 | 5 | 3 | 2 | 4.0 | 0.10 |
| Matt Done | 36 | 2454 | 5 | 2 | 3 | 3.6 | 0.13 |
| Ethan Hamilton | 14 | 1215 | 4 | 4 | 1.6 | 0.12 | |
| Kgosietsile Ntlhe | 19 | 1302 | 4 | 3 | 1 | 2.5 | 0.17 |
| Oliver Rathbone | 28 | 2156 | 4 | 4 | 3.9 | 0.16 | |
| Jordan Williams | 45 | 2935 | 3 | 2 | 1 | 3.6 | 0.11 |
Overall Performance by Player (P=Playing, NP=Not Playing)
| Player | Mins | GD P | GDp90 P | GDp90 NP | Diff | xGD P | xGDp90 P | xGDp90 NP | Diff |
| Team Average | 4140 | -33 | -0.72 | -15.5 | -0.34 | ||||
| Ian Henderson | 3991 | -26 | -0.59 | -4.23 | 3.64 | -11.4 | -0.26 | -2.46 | 2.21 |
| Callum Camps | 3531 | -23 | -0.59 | -1.48 | 0.89 | -15.4 | -0.39 | -0.02 | -0.38 |
| Jordan Williams | 2935 | -33 | -1.01 | 0.00 | -1.01 | -9.2 | -0.28 | -0.47 | 0.19 |
| Ryan Delaney | 2582 | -34 | -1.19 | 0.06 | -1.24 | -14.1 | -0.49 | -0.08 | -0.41 |
| Matt Done | 2454 | -23 | -0.84 | -0.53 | -0.31 | -13.5 | -0.49 | -0.11 | -0.39 |
| Josh Lillis | 2356 | -19 | -0.73 | -0.71 | -0.02 | -9.7 | -0.37 | -0.29 | -0.08 |
| Joseph Rafferty | 2274 | -14 | -0.55 | -0.92 | 0.36 | 0.2 | 0.01 | -0.76 | 0.76 |
| Oliver Rathbone | 2156 | -16 | -0.67 | -0.77 | 0.10 | -3.9 | -0.16 | -0.53 | 0.37 |
| Jimmy McNulty | 2149 | -8 | -0.34 | -1.13 | 0.80 | -11.3 | -0.47 | -0.19 | -0.28 |
| Harrison McGahey | 1866 | -13 | -0.63 | -0.79 | 0.16 | -1.1 | -0.05 | -0.57 | 0.52 |
| Calvin Andrew | 1762 | -16 | -0.82 | -0.64 | -0.17 | -7.8 | -0.40 | -0.29 | -0.10 |
| Bradden Inman | 1557 | -20 | -1.16 | -0.45 | -0.70 | -3.6 | -0.21 | -0.41 | 0.20 |
| Aaron Wilbraham | 1434 | -3 | -0.19 | -1.00 | 0.81 | -3.2 | -0.20 | -0.41 | 0.21 |
| Stephen Dooley | 1434 | -6 | -0.38 | -0.90 | 0.52 | -6.0 | -0.37 | -0.32 | -0.06 |
| Ethan Ebanks-Landell | 1395 | -3 | -0.19 | -0.98 | 0.79 | -7.8 | -0.51 | -0.25 | -0.25 |
| Kgosietsile Ntlhe | 1302 | -12 | -0.83 | -0.67 | -0.16 | -2.0 | -0.14 | -0.43 | 0.29 |
| Ethan Hamilton | 1215 | -13 | -0.96 | -0.62 | -0.35 | -11.4 | -0.84 | -0.13 | -0.72 |
| Joe Bunney | 1083 | -4 | -0.33 | -0.85 | 0.52 | -9.7 | -0.80 | -0.17 | -0.63 |
Scunthorpe United (Actual 23rd, xG 20th)
Performance by Match
Performance by Formation
| Starting Formation | Matches | Pts p90 | xPts p90 |
| 4-3-1-2 | 1 | 3.0 | 1.3 |
| 3-4-3 | 2 | 1.5 | 1.9 |
| 3-4-1-2 | 5 | 1.4 | 0.9 |
| 4-1-2-1-2 (Diamond Formation) | 7 | 1.1 | 1.6 |
| 4-4-2 (Classic) | 15 | 1.0 | 1.1 |
| 4-2-3-1 | 7 | 0.9 | 0.9 |
| 4-3-3 | 5 | 0.8 | 1.3 |
| 4-3-2-1 | 1 | 0.0 | 1.0 |
| 5-3-2 | 1 | 0.0 | 1.1 |
| 3-5-2 | 1 | 0.0 | 1.4 |
| 4-2-2-2 | 1 | 0.0 | 1.0 |
Performance by Manager
| Managerial Record | Matches | Pts p90 | Rank | xPts p90 | Rank |
| Nick Daws | 4 | 1.0 | 23rd | 0.9 | 24th |
| Andy Dawson | 8 | 0.4 | 24th | 1.4 | 13th |
| Stuart McCall | 34 | 1.1 | 18th | 1.2 | 20th |
Attacking Performance by Player
| Player | Apps | Mins | GI | G | A | xG | xGp90 |
| Lee Novak | 43 | 3498 | 13 | 12 | 1 | 7.4 | 0.19 |
| Josh Morris | 19 | 1495 | 11 | 5 | 6 | 3.5 | 0.21 |
| George Thomas | 36 | 2334 | 9 | 2 | 7 | 2.7 | 0.10 |
| Kyle Wootton | 25 | 1797 | 7 | 6 | 1 | 5.1 | 0.26 |
| Stephen Humphrys | 16 | 892 | 6 | 4 | 2 | 4.2 | 0.43 |
| Tony McMahon | 14 | 1153 | 5 | 1 | 4 | 0.8 | 0.06 |
| Ryan Colclough | 17 | 1109 | 4 | 2 | 2 | 2.0 | 0.16 |
| Charlie Goode | 21 | 1890 | 3 | 3 | 1.8 | 0.09 | |
| Matthew Lund | 22 | 1424 | 3 | 2 | 1 | 2.7 | 0.17 |
| Andy Dales | 20 | 1047 | 2 | 1 | 1 | 1.1 | 0.09 |
Overall Performance by Player (P=Playing, NP=Not Playing)
| Player | Mins | GD P | GDp90 P | GDp90 NP | Diff | xGD P | xGDp90 P | xGDp90 NP | Diff |
| Team Average | 4140 | -30 | -0.65 | -13.8 | -0.30 | ||||
| Jak Alnwick | 3690 | -23 | -0.56 | -1.40 | 0.84 | -10.2 | -0.25 | -0.72 | 0.47 |
| Lee Novak | 3498 | -20 | -0.51 | -1.40 | 0.89 | -13.1 | -0.34 | -0.09 | -0.24 |
| James Perch | 3448 | -29 | -0.76 | -0.13 | -0.63 | -12.3 | -0.32 | -0.19 | -0.13 |
| Rory McArdle | 3281 | -29 | -0.80 | -0.10 | -0.69 | -8.0 | -0.22 | -0.61 | 0.39 |
| Funso Ojo | 3209 | -17 | -0.48 | -1.26 | 0.78 | -11.5 | -0.32 | -0.22 | -0.11 |
| Cameron Burgess | 3015 | -9 | -0.27 | -1.68 | 1.41 | -12.6 | -0.37 | -0.10 | -0.28 |
| Cameron Borthwick-Jackson | 2360 | -20 | -0.76 | -0.51 | -0.26 | -5.7 | -0.22 | -0.41 | 0.19 |
| George Thomas | 2334 | -25 | -0.96 | -0.25 | -0.71 | -13.9 | -0.53 | 0.00 | -0.54 |
| Charlie Goode | 1890 | -14 | -0.67 | -0.64 | -0.03 | -8.0 | -0.38 | -0.23 | -0.15 |
| Kyle Wootton | 1797 | -6 | -0.30 | -0.92 | 0.62 | -5.2 | -0.26 | -0.33 | 0.07 |
| Josh Morris | 1495 | -19 | -1.14 | -0.37 | -0.77 | -5.9 | -0.36 | -0.27 | -0.09 |
| Matthew Lund | 1424 | -4 | -0.25 | -0.86 | 0.61 | -6.1 | -0.39 | -0.25 | -0.13 |
| Levi Sutton | 1344 | -4 | -0.27 | -0.84 | 0.57 | -3.7 | -0.25 | -0.32 | 0.08 |
| Jordan Clarke | 1312 | -21 | -1.44 | -0.29 | -1.15 | -5.3 | -0.36 | -0.27 | -0.09 |
| Tony McMahon | 1153 | 3 | 0.23 | -0.99 | 1.23 | -0.7 | -0.06 | -0.39 | 0.34 |
| Ryan Colclough | 1109 | -4 | -0.32 | -0.77 | 0.45 | 0.9 | 0.07 | -0.44 | 0.51 |
| Andy Dales | 1047 | -11 | -0.95 | -0.55 | -0.39 | -7.1 | -0.61 | -0.19 | -0.41 |
| Stephen Humphrys | 892 | -10 | -1.01 | -0.55 | -0.45 | -2.7 | -0.27 | -0.31 | 0.04 |
Shrewsbury Town (Actual 18th, xG 10th)
Performance by Match
Performance by Formation
| Starting Formation | Matches | Pts p90 | xPts p90 |
| 3-5-1-1 | 3 | 2.0 | 1.3 |
| 3-4-1-2 | 4 | 1.8 | 1.3 |
| 3-4-3 | 3 | 1.7 | 1.7 |
| 4-1-2-1-2 (Diamond Formation) | 7 | 1.6 | 1.3 |
| 4-3-3 | 10 | 1.2 | 1.7 |
| 5-3-2 | 2 | 1.0 | 1.6 |
| 3-5-2 | 6 | 0.7 | 1.0 |
| 4-4-2 (Classic) | 5 | 0.6 | 1.3 |
| 3-4-2-1 | 3 | 0.3 | 1.5 |
| 4-5-1 | 3 | 0.3 | 1.4 |
Performance by Manager
| Managerial Record | Matches | Pts p90 | Rank | xPts p90 | Rank |
| John Askey | 17 | 1.1 | 21st | 1.5 | 3rd |
| Danny Coyne | 3 | 2.0 | 1.5 | ||
| Sam Ricketts | 26 | 1.1 | 21st | 1.3 | 12th |
Attacking Performance by Player
| Player | Apps | Mins | GI | G | A | xG | xGp90 |
| Greg Docherty | 41 | 3108 | 15 | 7 | 8 | 5.0 | 0.14 |
| Ollie Norburn | 41 | 3329 | 12 | 9 | 3 | 7.3 | 0.20 |
| Fejiri Okenabirhie | 38 | 2150 | 11 | 10 | 1 | 5.5 | 0.23 |
| Luke Waterfall | 44 | 3883 | 7 | 5 | 2 | 4.4 | 0.10 |
| Shaun Whalley | 32 | 2524 | 7 | 2 | 5 | 6.0 | 0.22 |
| Josh Laurent | 41 | 2696 | 5 | 2 | 3 | 4.9 | 0.16 |
| Tyrese Campbell | 15 | 957 | 5 | 5 | 3.0 | 0.29 | |
| Lee Angol | 16 | 939 | 4 | 3 | 1 | 2.9 | 0.28 |
| Aaron Holloway | 29 | 1656 | 3 | 2 | 1 | 3.6 | 0.20 |
| Alex Gilliead | 27 | 1497 | 3 | 1 | 2 | 2.0 | 0.12 |
Overall Performance by Player (P=Playing, NP=Not Playing)
| Player | Mins | GD P | GDp90 P | GDp90 NP | Diff | xGD P | xGDp90 P | xGDp90 NP | Diff |
| Team Average | 4140 | -8 | -0.17 | 5.2 | 0.11 | ||||
| Luke Waterfall | 3883 | -8 | -0.19 | 0.00 | -0.19 | 2.9 | 0.07 | 0.80 | -0.73 |
| Anthony Grant | 3459 | -8 | -0.21 | 0.00 | -0.21 | -1.9 | -0.05 | 0.93 | -0.98 |
| Ollie Norburn | 3329 | -6 | -0.16 | -0.22 | 0.06 | 3.4 | 0.09 | 0.19 | -0.10 |
| Greg Docherty | 3108 | -5 | -0.14 | -0.26 | 0.12 | 4.7 | 0.14 | 0.04 | 0.10 |
| Omar Beckles | 3095 | -3 | -0.09 | -0.43 | 0.34 | 6.1 | 0.18 | -0.08 | 0.26 |
| Josh Laurent | 2696 | -1 | -0.03 | -0.44 | 0.40 | 10.9 | 0.36 | -0.36 | 0.72 |
| James Bolton | 2667 | -6 | -0.20 | -0.12 | -0.08 | 2.8 | 0.09 | 0.14 | -0.05 |
| Mat Sadler | 2533 | -8 | -0.28 | 0.00 | -0.28 | 3.6 | 0.13 | 0.09 | 0.04 |
| Shaun Whalley | 2524 | 0 | 0.00 | -0.45 | 0.45 | 8.4 | 0.30 | -0.18 | 0.48 |
| Fejiri Okenabirhie | 2150 | -7 | -0.29 | -0.05 | -0.25 | -4.0 | -0.17 | 0.41 | -0.58 |
| Steve Arnold | 2056 | -5 | -0.22 | -0.13 | -0.09 | -4.8 | -0.21 | 0.43 | -0.64 |
| Aaron Holloway | 1656 | 1 | 0.05 | -0.33 | 0.38 | 2.3 | 0.13 | 0.10 | 0.02 |
| Alex Gilliead | 1497 | -4 | -0.24 | -0.14 | -0.10 | 2.8 | 0.17 | 0.08 | 0.09 |
| Joel Coleman | 1440 | -5 | -0.31 | -0.10 | -0.21 | 6.8 | 0.42 | -0.05 | 0.48 |
| Ro-Shaun Williams | 1440 | 2 | 0.13 | -0.33 | 0.46 | 0.8 | 0.05 | 0.14 | -0.09 |
| Scott Golbourne | 1343 | -2 | -0.13 | -0.19 | 0.06 | 0.1 | 0.01 | 0.16 | -0.16 |
| Ryan Haynes | 1311 | -9 | -0.62 | 0.03 | -0.65 | 2.4 | 0.16 | 0.09 | 0.07 |
| Joshua Emmanuel | 1186 | -1 | -0.08 | -0.21 | 0.14 | 2.8 | 0.21 | 0.07 | 0.14 |
Southend United (Actual 19th, xG 18th)
Performance by Match
Performance by Formation
| Starting Formation | Matches | Pts p90 | xPts p90 |
| 4-5-1 | 2 | 1.5 | 1.1 |
| 4-4-1-1 | 2 | 1.5 | 2.0 |
| 3-5-2 | 10 | 1.4 | 1.2 |
| 4-4-2 (Classic) | 16 | 1.2 | 1.3 |
| 4-1-2-1-2 (Diamond Formation) | 1 | 1.0 | 1.4 |
| 4-3-3 | 9 | 0.9 | 1.2 |
| 5-3-2 | 5 | 0.4 | 0.9 |
| 4-2-3-1 | 1 | 0.0 | 1.1 |
Performance by Manager
| Managerial Record | Matches | Pts p90 | Rank | xPts p90 | Rank |
| Chris Powell | 39 | 1.1 | 21st | 1.3 | 17th |
| Ricky Duncan | 1 | 0.0 | 1.1 | ||
| Kevin Bond | 6 | 1.3 | 11th | 1.2 | 19th |
Attacking Performance by Player
| Player | Apps | Mins | GI | G | A | xG | xGp90 |
| Simon Cox | 45 | 3686 | 21 | 15 | 6 | 9.8 | 0.24 |
| Tom Hopper | 14 | 1109 | 9 | 7 | 2 | 3.8 | 0.31 |
| Sam Mantom | 43 | 3751 | 8 | 5 | 3 | 4.3 | 0.10 |
| Timothee Dieng | 43 | 3428 | 7 | 3 | 4 | 2.7 | 0.07 |
| Harry Bunn | 23 | 1511 | 6 | 4 | 2 | 3.3 | 0.20 |
| Theo Robinson | 24 | 1171 | 6 | 4 | 2 | 4.1 | 0.31 |
| Michael Kightly | 31 | 1580 | 5 | 1 | 4 | 1.2 | 0.07 |
| Stephen Humphrys | 10 | 583 | 5 | 5 | 1.2 | 0.19 | |
| Ben Coker | 16 | 1326 | 4 | 0 | 4 | 0.8 | 0.05 |
| Jason Demetriou | 24 | 1863 | 4 | 2 | 2 | 1.7 | 0.08 |
Overall Performance by Player (P=Playing, NP=Not Playing)
| Player | Mins | GD P | GDp90 P | GDp90 NP | Diff | xGD P | xGDp90 P | xGDp90 NP | Diff |
| Team Average | 4140 | -13 | -0.28 | -8.2 | -0.18 | ||||
| Sam Mantom | 3751 | -6 | -0.14 | -1.62 | 1.48 | -5.9 | -0.14 | -0.52 | 0.38 |
| Simon Cox | 3686 | -15 | -0.37 | 0.40 | -0.76 | -9.3 | -0.23 | 0.23 | -0.46 |
| Timothee Dieng | 3428 | -14 | -0.37 | 0.13 | -0.49 | -9.2 | -0.24 | 0.13 | -0.37 |
| Michael Turner | 3017 | -6 | -0.18 | -0.56 | 0.38 | 0.2 | 0.00 | -0.67 | 0.67 |
| Taylor Moore | 2964 | -7 | -0.21 | -0.46 | 0.25 | -9.6 | -0.29 | 0.11 | -0.40 |
| John White | 2698 | -3 | -0.10 | -0.62 | 0.52 | -6.0 | -0.20 | -0.14 | -0.06 |
| Elvis Bwomono | 2535 | -7 | -0.25 | -0.34 | 0.09 | -8.9 | -0.32 | 0.04 | -0.36 |
| Mark Oxley | 2250 | 0 | 0.00 | -0.62 | 0.62 | -1.2 | -0.05 | -0.33 | 0.28 |
| Jason Demetriou | 1863 | -10 | -0.48 | -0.12 | -0.36 | -0.2 | -0.01 | -0.32 | 0.31 |
| Stephen McLaughlin | 1785 | -12 | -0.61 | -0.04 | -0.57 | -0.7 | -0.04 | -0.29 | 0.25 |
| Dru Yearwood | 1683 | -5 | -0.27 | -0.29 | 0.03 | -4.7 | -0.25 | -0.13 | -0.12 |
| Nathan Bishop | 1620 | -11 | -0.61 | -0.07 | -0.54 | -7.2 | -0.40 | -0.04 | -0.36 |
| Michael Kightly | 1580 | -10 | -0.57 | -0.11 | -0.46 | -3.8 | -0.22 | -0.15 | -0.06 |
| Sam Hart | 1543 | -11 | -0.64 | -0.07 | -0.57 | -7.6 | -0.45 | -0.02 | -0.43 |
| Harry Bunn | 1511 | -13 | -0.77 | 0.00 | -0.77 | -2.5 | -0.15 | -0.19 | 0.04 |
| Ben Coker | 1326 | 3 | 0.20 | -0.51 | 0.72 | 4.7 | 0.32 | -0.41 | 0.73 |
| Stephen Hendrie | 1267 | -2 | -0.14 | -0.34 | 0.20 | -4.4 | -0.32 | -0.12 | -0.20 |
| Theo Robinson | 1171 | 8 | 0.61 | -0.64 | 1.25 | -0.8 | -0.06 | -0.22 | 0.16 |
Sunderland (Actual 5th, xG 4th)
Performance by Match
Performance by Formation
| Starting Formation | Matches | Pts p90 | xPts p90 |
| 4-2-3-1 | 30 | 2.0 | 1.6 |
| 4-5-1 | 2 | 2.0 | 1.5 |
| 4-4-2 (Classic) | 10 | 1.8 | 1.4 |
| 3-5-2 | 1 | 1.0 | 1.0 |
| 4-1-3-2 | 1 | 1.0 | 2.3 |
| 4-3-3 | 2 | 0.5 | 1.0 |
Attacking Performance by Player
| Player | Apps | Mins | GI | G | A | xG | xGp90 |
| Josh Maja | 23 | 1696 | 17 | 15 | 2 | 5.5 | 0.29 |
| Aiden McGeady | 33 | 2491 | 16 | 11 | 5 | 6.8 | 0.24 |
| Lynden Gooch | 38 | 2746 | 12 | 5 | 7 | 4.3 | 0.14 |
| Chris Maguire | 33 | 2037 | 11 | 7 | 4 | 5.2 | 0.23 |
| George Honeyman | 36 | 2862 | 9 | 6 | 3 | 3.3 | 0.11 |
| Lee Cattermole | 29 | 2501 | 9 | 7 | 2 | 2.7 | 0.10 |
| Luke O Nien | 37 | 2346 | 8 | 5 | 3 | 1.5 | 0.06 |
| Charlie Wyke | 21 | 1205 | 7 | 4 | 3 | 5.9 | 0.44 |
| Max Power | 35 | 2679 | 7 | 4 | 3 | 3.8 | 0.13 |
| William Grigg | 17 | 1186 | 7 | 4 | 3 | 5.2 | 0.40 |
Overall Performance by Player (P=Playing, NP=Not Playing)
| Player | Mins | GD P | GDp90 P | GDp90 NP | Diff | xGD P | xGDp90 P | xGDp90 NP | Diff |
| Team Average | 4140 | 33 | 0.72 | 10.6 | 0.23 | ||||
| Jon McLaughlin | 4126 | 33 | 0.72 | 0.00 | 0.72 | 9.9 | 0.22 | 4.01 | -3.79 |
| Jack Baldwin | 3060 | 25 | 0.74 | 0.67 | 0.07 | 4.4 | 0.13 | 0.51 | -0.38 |
| George Honeyman | 2862 | 29 | 0.91 | 0.28 | 0.63 | 8.0 | 0.25 | 0.18 | 0.07 |
| Lynden Gooch | 2746 | 21 | 0.69 | 0.77 | -0.09 | 2.3 | 0.08 | 0.53 | -0.45 |
| Tom Flanagan | 2729 | 25 | 0.82 | 0.51 | 0.31 | 9.2 | 0.30 | 0.09 | 0.22 |
| Max Power | 2679 | 13 | 0.44 | 1.23 | -0.80 | 5.0 | 0.17 | 0.34 | -0.17 |
| Lee Cattermole | 2501 | 23 | 0.83 | 0.55 | 0.28 | 8.4 | 0.30 | 0.12 | 0.19 |
| Aiden McGeady | 2491 | 20 | 0.72 | 0.71 | 0.01 | 8.8 | 0.32 | 0.09 | 0.23 |
| Luke O Nien | 2346 | 14 | 0.54 | 0.95 | -0.42 | 11.4 | 0.44 | -0.04 | 0.48 |
| Reece James | 2246 | 20 | 0.80 | 0.62 | 0.18 | 1.1 | 0.04 | 0.45 | -0.40 |
| Chris Maguire | 2037 | 26 | 1.15 | 0.30 | 0.85 | 2.9 | 0.13 | 0.33 | -0.20 |
| Adam Matthews | 1949 | 19 | 0.88 | 0.58 | 0.30 | 1.3 | 0.06 | 0.38 | -0.32 |
| Josh Maja | 1696 | 19 | 1.01 | 0.52 | 0.49 | 1.5 | 0.08 | 0.33 | -0.25 |
| Bryan Oviedo | 1468 | 9 | 0.55 | 0.81 | -0.26 | 5.3 | 0.32 | 0.18 | 0.15 |
| Dylan McGeouch | 1235 | 17 | 1.24 | 0.50 | 0.74 | 0.0 | 0.00 | 0.33 | -0.32 |
| Charlie Wyke | 1205 | 2 | 0.15 | 0.95 | -0.80 | 6.9 | 0.52 | 0.11 | 0.41 |
| William Grigg | 1186 | 10 | 0.76 | 0.70 | 0.06 | 7.3 | 0.56 | 0.10 | 0.46 |
| Grant Leadbitter | 1136 | 6 | 0.48 | 0.81 | -0.33 | 7.4 | 0.59 | 0.09 | 0.50 |
Walsall (Actual 22nd, xG 19th)
Performance by Match
Performance by Formation
| Starting Formation | Matches | Pts p90 | xPts p90 |
| 3-5-2 | 1 | 3.0 | 1.8 |
| 4-5-1 | 1 | 3.0 | 2.1 |
| 3-4-3 | 1 | 3.0 | 1.4 |
| 4-2-3-1 | 2 | 2.0 | 1.0 |
| 4-4-2 (Classic) | 29 | 1.0 | 1.2 |
| 4-3-3 | 9 | 0.6 | 1.2 |
| 4-1-2-1-2 (Diamond Formation) | 1 | 0.0 | 1.0 |
| 4-1-4-1 | 1 | 0.0 | 0.5 |
Performance by Manager
| Managerial Record | Matches | Pts p90 | Rank | xPts p90 | Rank |
| Dean Keates | 41 | 1.0 | 22nd | 1.2 | 20th |
| Martin O’Connor | 5 | 1.0 | 22nd | 1.4 | 8th |
Attacking Performance by Player
| Player | Apps | Mins | GI | G | A | xG | xGp90 |
| Andy Cook | 42 | 3202 | 16 | 13 | 3 | 12.0 | 0.34 |
| Josh Gordon | 35 | 2467 | 10 | 7 | 3 | 5.3 | 0.20 |
| Luke Leahy | 44 | 3943 | 9 | 3 | 6 | 2.5 | 0.06 |
| George Dobson | 39 | 3157 | 6 | 0 | 6 | 1.9 | 0.05 |
| Morgan Ferrier | 33 | 2166 | 6 | 5 | 1 | 4.6 | 0.19 |
| Nicholas Devlin | 43 | 3745 | 4 | 2 | 2 | 0.8 | 0.02 |
| Zeli Ismail | 32 | 1985 | 4 | 3 | 1 | 2.8 | 0.13 |
| Isaiah Osbourne | 32 | 2284 | 3 | 3 | 2.1 | 0.08 | |
| Kieron Morris | 17 | 1029 | 3 | 2 | 1 | 2.2 | 0.19 |
| Dan Scarr | 17 | 1502 | 2 | 1 | 1 | 0.6 | 0.04 |
Overall Performance by Player (P=Playing, NP=Not Playing)
| Player | Mins | GD P | GDp90 P | GDp90 NP | Diff | xGD P | xGDp90 P | xGDp90 NP | Diff |
| Team Average | 4140 | -22 | -0.48 | -12.9 | -0.28 | ||||
| Luke Leahy | 3943 | -17 | -0.39 | -2.28 | 1.90 | -10.8 | -0.25 | -0.96 | 0.71 |
| Liam Roberts | 3780 | -24 | -0.57 | 0.50 | -1.07 | -13.8 | -0.33 | 0.22 | -0.55 |
| Nicholas Devlin | 3745 | -17 | -0.41 | -1.14 | 0.73 | -10.8 | -0.26 | -0.48 | 0.22 |
| Jon Guthrie | 3718 | -20 | -0.48 | -0.43 | -0.06 | -11.6 | -0.28 | -0.28 | 0.00 |
| Andy Cook | 3202 | -14 | -0.39 | -0.77 | 0.37 | -6.2 | -0.17 | -0.64 | 0.47 |
| George Dobson | 3157 | -13 | -0.37 | -0.82 | 0.45 | -8.6 | -0.25 | -0.39 | 0.15 |
| Josh Gordon | 2467 | -12 | -0.44 | -0.54 | 0.10 | -6.2 | -0.23 | -0.36 | 0.13 |
| Liam Kinsella | 2295 | -12 | -0.47 | -0.49 | 0.02 | -7.6 | -0.30 | -0.26 | -0.04 |
| Isaiah Osbourne | 2284 | -14 | -0.55 | -0.39 | -0.16 | -9.9 | -0.39 | -0.15 | -0.24 |
| Morgan Ferrier | 2166 | -12 | -0.50 | -0.46 | -0.04 | -9.2 | -0.38 | -0.17 | -0.21 |
| Zeli Ismail | 1985 | -8 | -0.36 | -0.58 | 0.22 | -6.2 | -0.28 | -0.28 | 0.00 |
| Jack Fitzwater | 1849 | -10 | -0.49 | -0.47 | -0.02 | -10.0 | -0.48 | -0.12 | -0.37 |
| Joe Edwards | 1542 | -7 | -0.41 | -0.52 | 0.11 | -3.9 | -0.23 | -0.31 | 0.09 |
| Josh Ginnelly | 1531 | -7 | -0.41 | -0.52 | 0.11 | -8.3 | -0.49 | -0.16 | -0.33 |
| Dan Scarr | 1502 | -11 | -0.66 | -0.38 | -0.28 | -3.7 | -0.22 | -0.31 | 0.09 |
| Kieron Morris | 1029 | -5 | -0.44 | -0.49 | 0.05 | -5.4 | -0.47 | -0.22 | -0.25 |
| Russell Martin | 720 | -8 | -1.00 | -0.37 | -0.63 | -2.5 | -0.31 | -0.27 | -0.04 |
| Matthew Jarvis | 709 | -4 | -0.51 | -0.47 | -0.04 | -0.9 | -0.11 | -0.32 | 0.20 |
Wycombe Wanderers (Actual 17th, xG 14th)
Performance by Match
Performance by Formation
| Starting Formation | Matches | Pts p90 | xPts p90 |
| 3-5-2 | 2 | 2.0 | 1.3 |
| 4-4-2 (Classic) | 17 | 1.4 | 1.3 |
| 4-3-3 | 25 | 1.0 | 1.4 |
| 4-3-1-2 | 1 | 0.0 | 1.6 |
| 4-2-3-1 | 1 | 0.0 | 1.0 |
Attacking Performance by Player
| Player | Apps | Mins | GI | G | A | xG | xGp90 |
| Adebayo Akinfenwa | 36 | 2463 | 13 | 7 | 6 | 8.6 | 0.31 |
| Joe Jacobson | 36 | 3197 | 12 | 7 | 5 | 5.0 | 0.14 |
| Alex Samuel | 30 | 2289 | 6 | 5 | 1 | 4.8 | 0.19 |
| Paris Cowan-Hall | 30 | 1508 | 6 | 4 | 2 | 2.5 | 0.15 |
| Bryn Morris | 19 | 1407 | 5 | 3 | 2 | 2.7 | 0.17 |
| Adam El-Abd | 34 | 3015 | 4 | 3 | 1 | 3.0 | 0.09 |
| Fred Onyedinma | 20 | 1465 | 4 | 4 | 3.3 | 0.20 | |
| Jason McCarthy | 44 | 3960 | 4 | 2 | 2 | 1.6 | 0.04 |
| Randell Williams | 19 | 1260 | 4 | 2 | 2 | 1.9 | 0.14 |
| Scott Kashket | 26 | 1130 | 4 | 3 | 1 | 3.4 | 0.27 |
Overall Performance by Player (P=Playing, NP=Not Playing)
| Player | Mins | GD P | GDp90 P | GDp90 NP | Diff | xGD P | xGDp90 P | xGDp90 NP | Diff |
| Team Average | 4140 | -11 | -0.24 | -4.5 | -0.10 | ||||
| Jason McCarthy | 3960 | -8 | -0.18 | -1.50 | 1.32 | -4.9 | -0.11 | 0.18 | -0.29 |
| Dominic Gape | 3671 | -10 | -0.25 | -0.19 | -0.05 | -3.7 | -0.09 | -0.17 | 0.08 |
| Ryan Allsop | 3420 | -11 | -0.29 | 0.00 | -0.29 | -5.4 | -0.14 | 0.11 | -0.25 |
| Joe Jacobson | 3197 | -6 | -0.17 | -0.48 | 0.31 | -2.7 | -0.08 | -0.18 | 0.10 |
| Curtis Thompson | 3018 | -12 | -0.36 | 0.08 | -0.44 | -5.6 | -0.17 | 0.08 | -0.25 |
| Adam El-Abd | 3015 | -8 | -0.24 | -0.24 | 0.00 | -4.7 | -0.14 | 0.02 | -0.16 |
| Sido Jombati | 2835 | -9 | -0.29 | -0.14 | -0.15 | -3.6 | -0.11 | -0.06 | -0.05 |
| Adebayo Akinfenwa | 2463 | -4 | -0.15 | -0.38 | 0.23 | -2.6 | -0.10 | -0.10 | 0.01 |
| Alex Samuel | 2289 | -1 | -0.04 | -0.49 | 0.45 | -1.2 | -0.05 | -0.16 | 0.12 |
| Michael Harriman | 1898 | -4 | -0.19 | -0.28 | 0.09 | -5.5 | -0.26 | 0.04 | -0.30 |
| Matt Bloomfield | 1766 | -8 | -0.41 | -0.11 | -0.29 | -2.0 | -0.10 | -0.10 | 0.00 |
| Nick Freeman | 1603 | -12 | -0.67 | 0.04 | -0.71 | -2.9 | -0.16 | -0.06 | -0.10 |
| Paris Cowan-Hall | 1508 | -3 | -0.18 | -0.27 | 0.09 | -3.6 | -0.22 | -0.03 | -0.19 |
| Fred Onyedinma | 1465 | -4 | -0.25 | -0.24 | -0.01 | -3.3 | -0.21 | -0.04 | -0.17 |
| Bryn Morris | 1407 | 0 | 0.00 | -0.36 | 0.36 | -1.8 | -0.12 | -0.09 | -0.03 |
| Anthony Stewart | 1358 | -12 | -0.80 | 0.03 | -0.83 | 1.0 | 0.07 | -0.18 | 0.25 |
| Randell Williams | 1260 | 2 | 0.14 | -0.41 | 0.55 | 2.5 | 0.18 | -0.22 | 0.39 |
| Scott Kashket | 1130 | 2 | 0.16 | -0.39 | 0.55 | 2.0 | 0.16 | -0.19 | 0.35 |
