Following the previous posts detailing how I have created a betting a model using expected goals data, link below, and a prediction for the League Two play-offs it’s now time to turn Mystic Meg once again to predict the outcome of the League One play-offs.
https://eflnumbers.wordpress.com/2020/06/11/how-to-create-a-betting-model-using-expected-goals-data/
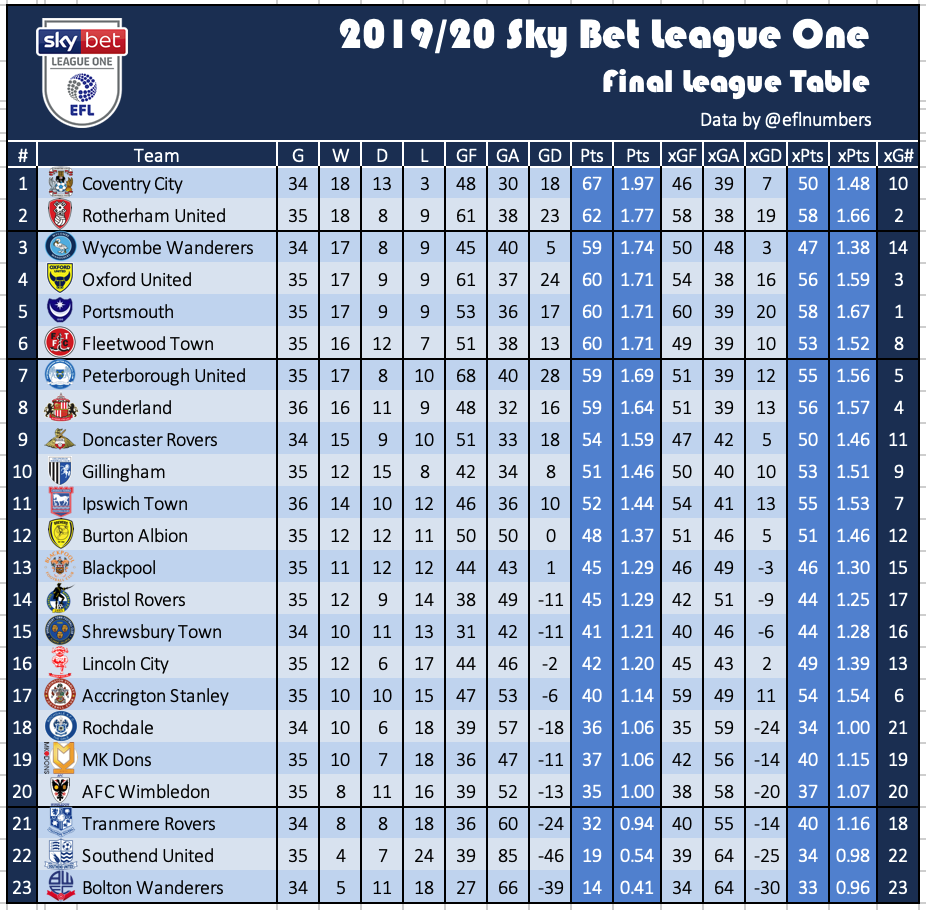
With Coronavirus halting football across England, League One ultimately (and reluctantly in some cases) followed League Two’s lead using points per game to finish the season. The automatic spots and a place in next season’s Championship went to Coventry City (ranked as 10th best by my model) and Rotherham United (2nd highest ranked). Behind that came the cavalry.
Six teams were separated by one point and with only four play-off spots available it was Wycombe Wanderers, Oxford United, Portsmouth and Fleetwood Town who still have an opportunity for glory.
Wycombe Wanderers
| # | Team | G | W | D | L | GF | GA | GD | Pts | Pts | xGF | xGA | xGD | xPts | xPts | xG# |
| 3 | Wycombe Wanderers | 34 | 17 | 8 | 9 | 45 | 40 | 5 | 59 | 1.74 | 50 | 48 | 2 | 47 | 1.38 | 14 |
At the time of the halt Wycombe Wanderers were in 8th and the old adage of points on the board are better than games in hand was not correct in this instance with a points per game table catapulting them into 3rd. The table may appear to show them as the strongest of the play-off quartet but my expected goals data suggests they are the weakest. They only finished with a +5 GD, considerably lower than the teams around them, but my xG model calculates this should have been lower and only good enough for 14th place.
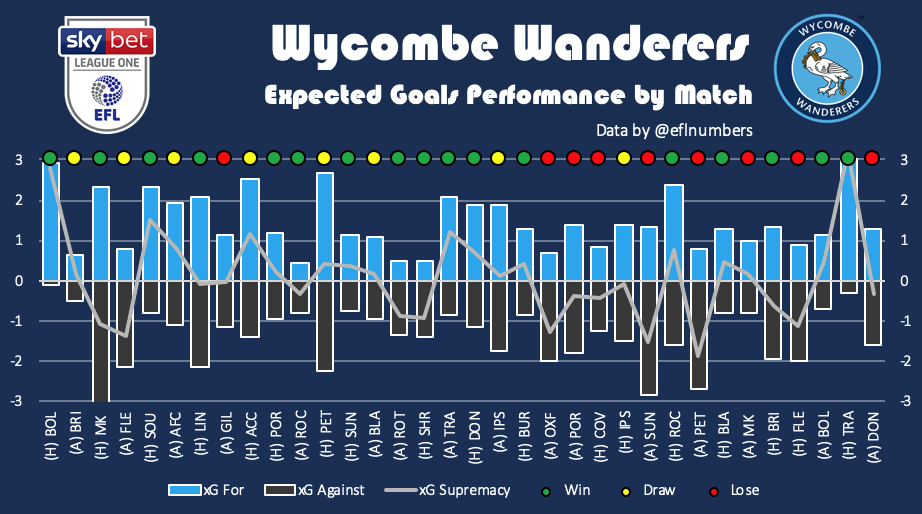
Wycome’s season is essentially summarised as good start, bad finish. The good included a 12 match unbeaten run, with 2 excellent performances at home to a weakend Bolton Wanderers on the opening day (won 2-0) and against relegated Tranmere Rovers (won 3-1). The bad involved a 5 match winless run in a particularly tricky period against multiple promotion rivals.

Prior to the away defeat at Oxford United during the end of December their W-D-L record was 12-7-1 and automatic promotion looked a formality. From that game onwards the form tailed off very quickly and a record of 5-1-8 means they are considered fortunate to have an opportunity in the play-offs. Put simply they became a lot more leaker at the back. Interestingly the expected goals data shows little fluctuation in performances between February and that awesome start but results ultimately were.
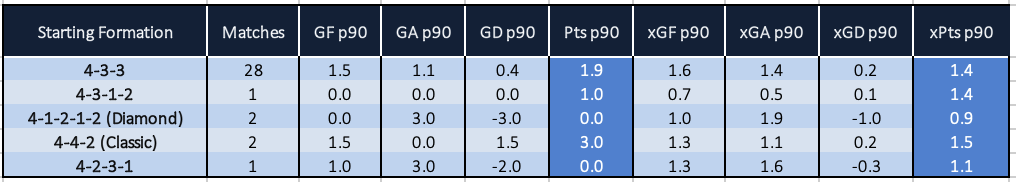
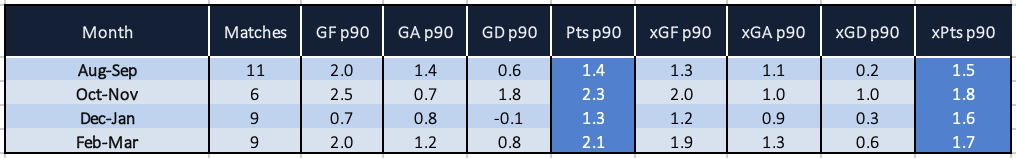
Gareth Ainsworth was pretty set in the 4-3-3 formation starting in that shape over 80% of the time, including both games against Fleetwood Town during the regular season, and is unlikely to change now. They have achieved 1.9 points per game in those games compared to 1.2 in the other 6 games aided by a 100% record in the two games in a classic 4-4-2. The expected goals implies it would be best to stick to the known.
Oxford United
| # | Team | G | W | D | L | GF | GA | GD | Pts | Pts | xGF | xGA | xGD | xPts | xPts | xG# |
| 4 | Oxford United | 35 | 17 | 9 | 9 | 61 | 37 | 24 | 60 | 1.71 | 54 | 38 | 16 | 56 | 1.59 | 3 |
Oxford United were in third but dropped a place, leapfrogged by Wycombe Wanderers, due to an inferior points per game total. Oxford were the second highest scorers (61) in the division, behind only Peterborough, and although the expected goals data indicates they scored more than expected they still rank strongly. The xG model indicates they have joint best defence in the league and the Yellows are rated as the 3rd strongest overall.
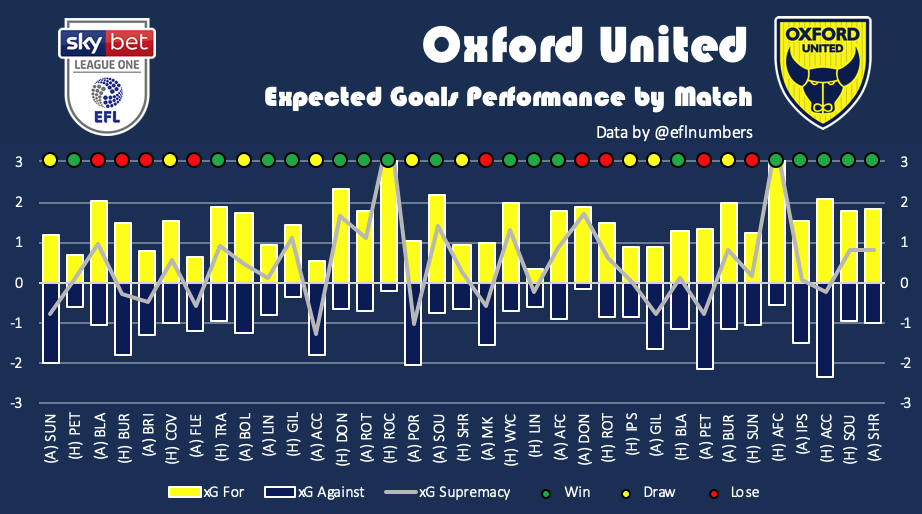
For a second season in a row Oxford United started slowly but often ran hot. Oxford’s best performances both came at the Kassam Stadium against Rochdale (won 3-0) and AFC Wimbledon (won 5-0). In contrast, they were never dominated.
The season concluded with a five match winning run with the season perfectly captured in the last game away to Shrewsbury Town. At 2-0 down and then against 10 men, Oxford fought back with Josh Ruffels scoring another late minute winner. No goal there and Oxford’s season would already be over.
The initial August – September will be remembered as particularly poor but it was also the results across December – January, a W-D-L record of 3-3-3 which put pay to any automatic hopes. The expected goals data has Oxford United as strong throughout and with the form at the end of the season they would have been fancying their chances to catch either Coventry City or Rotherham United ahead of them.
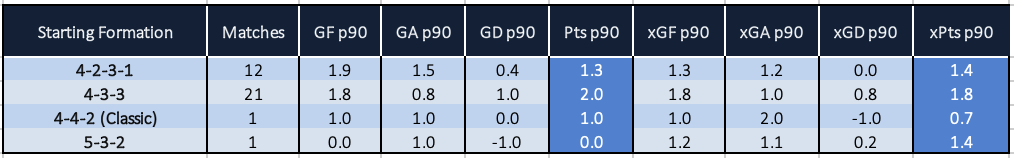
Karl Robinson started the season in a 4-2-3-1 shape but due to the poor start that was binned in October in favour of a 4-3-3 shape with Alex Rodriguez the sole sitter allowing Cameron Brannagan to push further forward. The change in results was stark with the average goals conceded per match halved whilst still maintaining the attacking threat. This is backed up by the expected goals data. Interesting to note the trip to Fratton Park earlier in the season was the only match Robinson started in a 4-4-2 with Taylor and Mackie leading the line, elsewhere it’s tended to be either or.
Portsmouth
| # | Team | G | W | D | L | GF | GA | GD | Pts | Pts | xGF | xGA | xGD | xPts | xPts | xG# |
| 5 | Portsmouth | 35 | 17 | 9 | 9 | 53 | 36 | 17 | 60 | 1.71 | 60 | 39 | 20 | 58 | 1.67 | 1 |
Portsmouth shared an identical W-D-L record with Oxford United and could only be separated by goal difference. Pompey finished with a +17 GD but the expected goals data indicates it should have been more (+20 xGD) due to an underperformance in the goals scored column. They finished 5th in the table but I have them as the strongest team in the league.
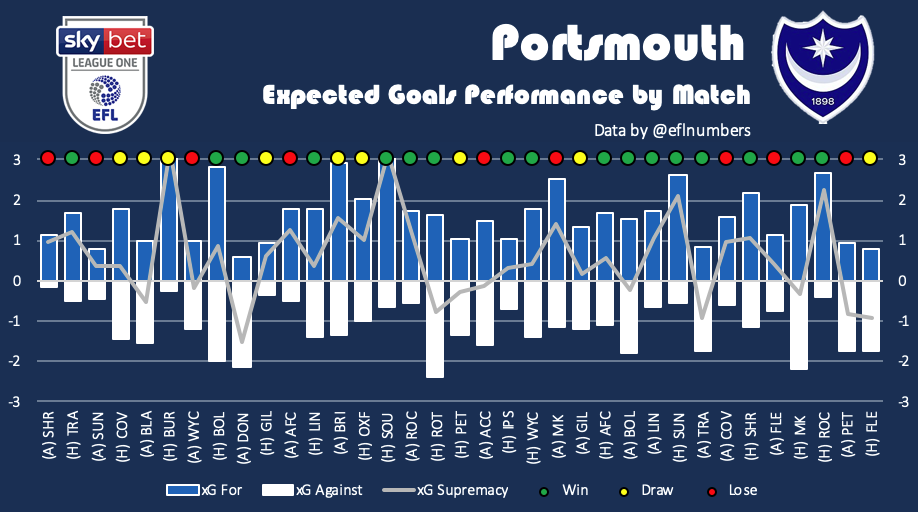
Another side with a poor start and due to having games in hand they found themselves as low as 20th by mid September with some calling for Kenny Jackett to be sacked. The start included their best performance of the season, as measured by expected goals, when drawing 1-1 at home to Burton Albion (3.5 – 0.3 xG). There were a number of other notable home performances in games against Southend (won 4-1), Sunderland (won 2-0) and Rochdale (won 3-0). The worst performance came away to Doncaster Rovers but they still managed to pick up all three points thanks to an Ellis Harrison stoppage time winner.
The poor start cost Pompey in the end with the expected goals data suggesting they were unfortunate to pick up so few points. Thereafter they were consistently picking up a high number of points and had the post October form started in August then they would have achieved an automatic finish. The expected goals shows how the results were no fluke as the consistently performed well.
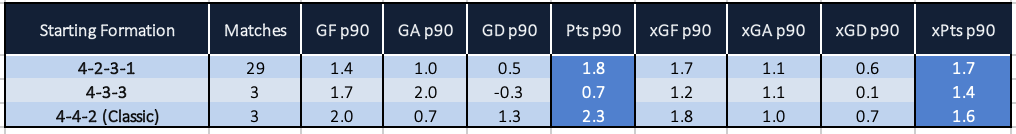
Kenny Jackett has used the fewest starting formations of the four playoff managers. The 4-2-3-1 is the most used, and was used at Fratton Park against Oxford United earlier in the season. A 4-4-2 shape has been used only three times this season but has a W-D-L record of 2-1-0 with strong expected goals data. The last 20 games of the season started with a 4-2-3-1 so the next one is unlikely to differ.
Fleetwood Town
| # | Team | G | W | D | L | GF | GA | GD | Pts | Pts | xGF | xGA | xGD | xPts | xPts | xG# |
| 6 | Fleetwood Town | 35 | 16 | 12 | 7 | 51 | 38 | 13 | 60 | 1.71 | 49 | 39 | 10 | 53 | 1.52 | 8 |
Fleetwood make up the play-off hopefuls, also finishing on 60 points. Impressively they were only beaten on 7 occasions in the league with champions Coventry City the other team with fewer. In all the performed similar to the expected goals data which ultimately has them scoring two fewer and conceding one more. This was good enough for 8th in the expected goals table but they’ll be more than happy with a 6th place finish.
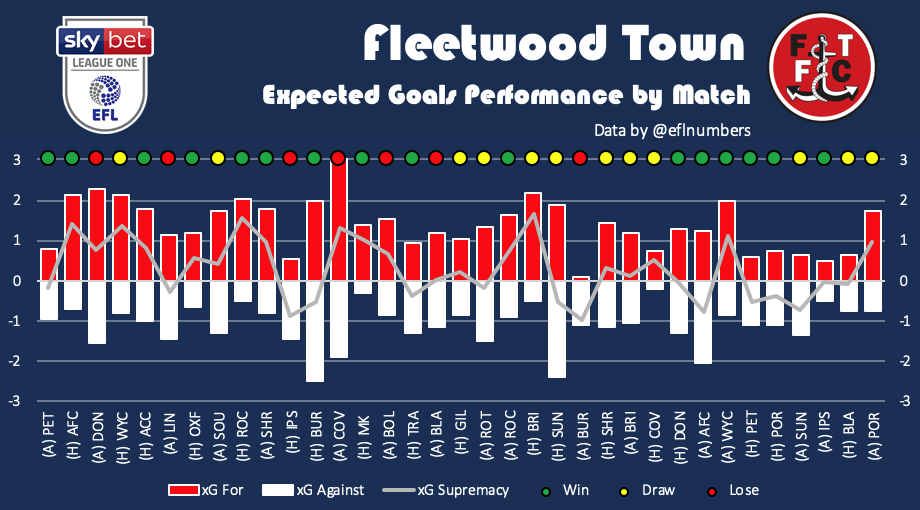
A mixed bag of results with my eye drawn to the run towards the end of the season with just one defeat in 18 but dig a little deeper and that highlights the problem. Fleetwood Town were in the playoffs for the majority of the early part of the season but the sheer number of draws around the turn of the year ultimately meant they were losing ground on their rivals. It wasn’t until the run of 5 successive wins in February that they regained a playoff spot.

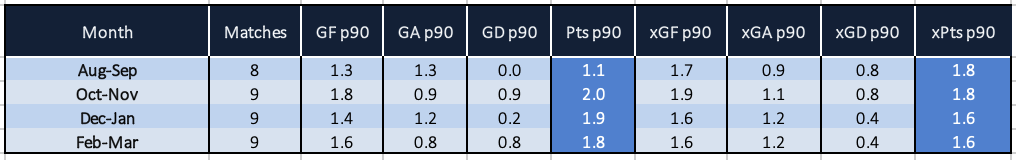
The season was bookended in terms of points per game with a strong start and an even stronger finish. The first spell down to a formidable attack, the second by a stubborn defence. The February – March spell featuring a 6-3-0 W-D-L record with just 6 goals conceded. Interestingly the expected goals data shows a different trend with expected goals decreasing as the season went with attacking threat diminishing as the season went on.
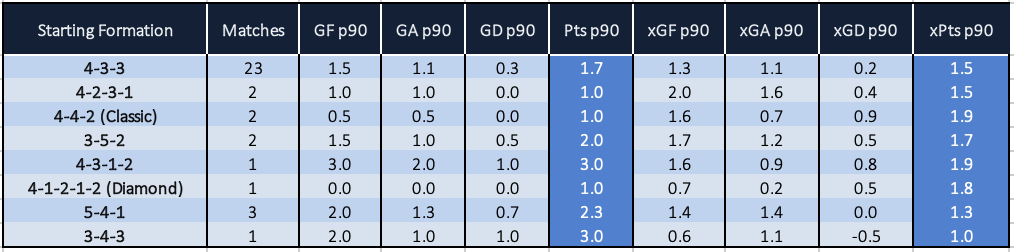
Joey Barton appears to have a tried and trusted but also has many tried and not necessarily trusted formations, playing the most formation of all four managers. The 4-3-3 is the most popular but was not seen in either match against Wycombe Wanderers this season. August’s home match started with a 4-2-3-1 formation whilst the February return was a 3-5-2. Which formation he starts is anyones guess here.
Oxford United (4th) v Portsmouth (5th)
The play-offs kick off on Friday evening with Portsmouth hosting Oxford United at Fratton Park before the return leg at the Kassam Stadium three days later.
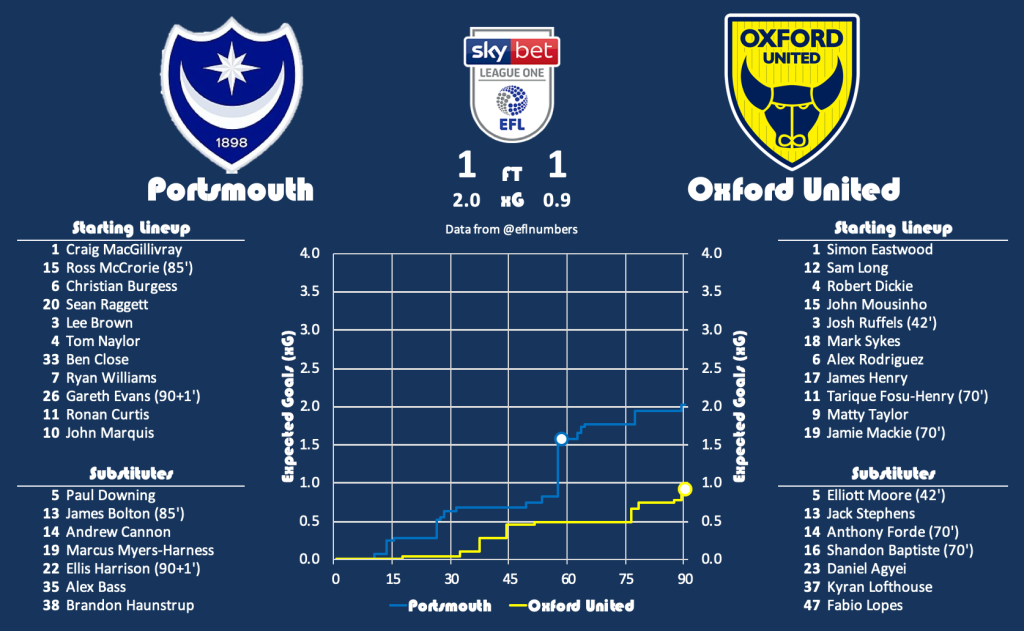
The teams have only faced each other once in the league this season with the scheduled return in March cancelled. Portsmouth played host on the 2nd November 2019 in a 1-1 score draw. The teams were evenly matched in the first half before Gareth Evans penalty put Pompey ahead on the hour mark. Noted previously this was the only time Karl Robinson started Oxford United in a 4-4-2 shape and the goal prompted the change with Mackie replaced with the visitors shuffling into a 4-3-3/4-2-3-1 shape. In the end Matty Taylor’s injury time equaliser secured Oxford United a point but Portsmouth will be rueing not being able to see the game out and secure all three points.
Finishing 1st (Portsmouth) and 3rd (Oxford United) in my expected goals table implies these two teams should not be facing each other in a play-off semi. This will be a close match up and is considerably stronger in teams of strength than the other semi. To calculate the expected match probabilities I use a rolling 46 game season of data which ordinarily would be a complete season but in this instance uses a handful of games from the season before.
A poisson distribution estimates the following probabilities for the number of combined goals scored across the ties.
| 0 | 1 | 2 | 3 | 4 | 5 | 6 | |
| Oxford United | 6% | 17% | 24% | 22% | 15% | 8% | 4% |
| Portsmouth | 5% | 14% | 22% | 22% | 17% | 11% | 5% |
My model has Portsmouth as the favourites to make the final, pretty much identical to the bookmakers odds, and therefore no value play.
| Modelled Probability | Bookmakers Odds | Bookmakers Probability | Difference | |
| Oxford United | 44.5% | 6/5 | 45.5% | -0.9% |
| Portsmouth | 55.5% | 8/11 | 57.9% | -2.4% |
Wycombe Wanderers (3rd) v Fleetwood Town (6th)
Friday’s action concludes with Wycombe Wanderers travelling to Highbury to face Fleetwood Town with the reverse tie also three days later at Adams Park.
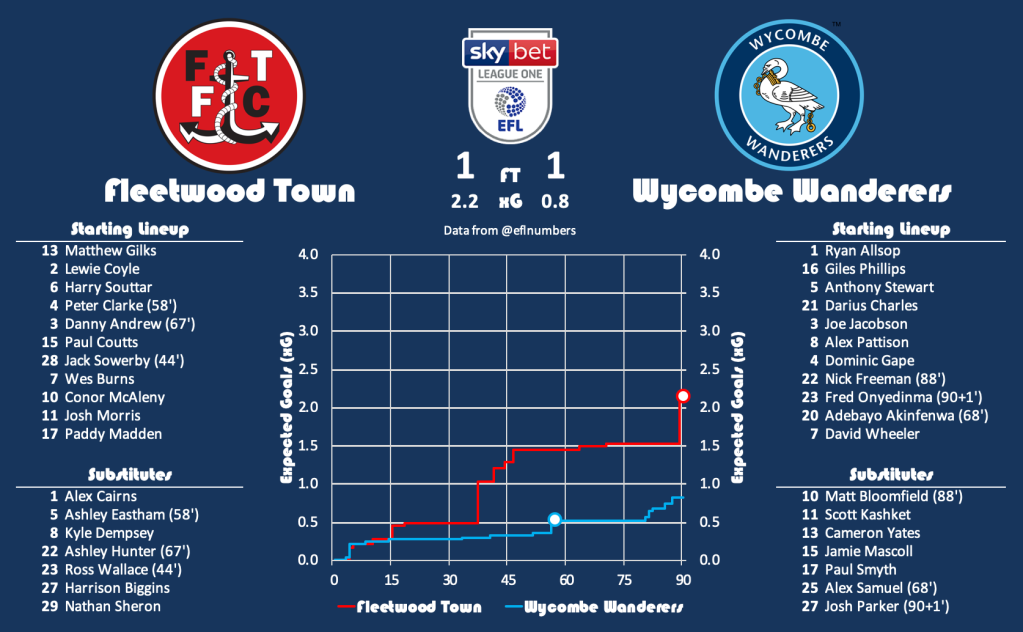
There’s been two heads to heads this season with the first happening on the 20th August 2019 with the teams playing out a 1-1 draw. Peter Clarke missed a good chance just after the half an hour mark with a number of half chances just before the break. Adebayo Akinfenwa put the visitors ahead early in the second half with the home response disappointingly non existent. Paddy Madden rescued a point at the death and is ultimately deserved on the balance of the play.
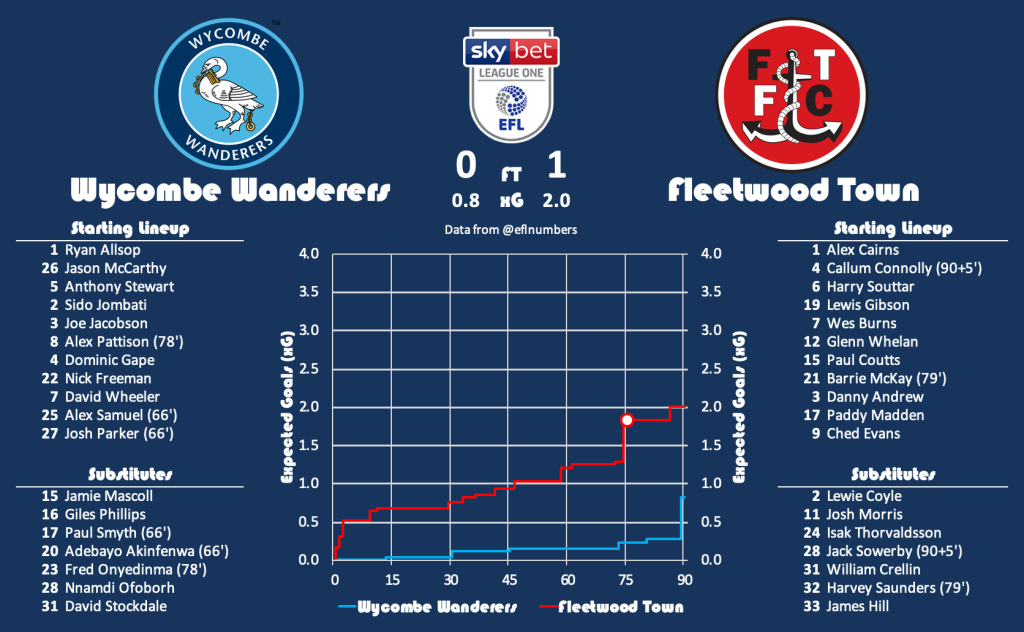
Wycombe Wanderers hosted the return on 11th February 2020 with Fleetwood taking all three points in a 1-0 victory. Paddy Madden the goalscorer again this time. It’s striking how similar the two expected goals results are and that will give Joey Barton great confidence going into the game. Gareth Ainsworth will need to have a plan up his sleeve and it is a worry they conceded 4.2 xG across the two games.
14th plays 8th in my expected goals and with neither apparently good enough for a play-off spot in my data. The winner of this tie will definitely be the underdog come Wembley. As per the other play-off I will calculate the expected match probabilities using a rolling 46 game season of data which ordinarily would be a complete season but in this instance uses a handful of games from the season before.
A poisson distribution estimates the following probabilities for the number of combined goals scored across the ties.
| 0 | 1 | 2 | 3 | 4 | 5 | 6 | |
| Wycombe Wanderers | 9% | 21% | 26% | 21% | 13% | 6% | 3% |
| Fleetwood Town | 5% | 15% | 22% | 22% | 17% | 10% | 5% |
My model has Fleetwood Town as the most likely to make it to Wembley and is again near identical to the bookmakers odds with no betting selection suggested.
| Modelled Probability | Bookmakers Odds | Bookmakers Probability | Difference | |
| Wycombe Wanderers | 39.1% | 11/8 | 42.1% | -3.0% |
| Fleetwood Town | 60.9% | 8/13 | 61.9% | -1.0% |
Outright
Given how the expected goals data rates the four teams the winner of the Oxford United – Portsmouth match should win the final and would be anticipated to do so.
The model thinks Portsmouth are the right favourites with a 33% chance matching the probabilities suggested by the bookmakers odds. Fleetwood Town are second favourites only due to facing the easiest opponents. Due to the proximity of my modelled probabilities and the bookmakers odds there is currently no value in placing in a bet and therefore no selection is made.
| Modelled Probability | Bookmakers Odds | Bookmakers Probability | Difference | |
| Wycombe Wanderers | 14.5% | 5/1 | 16.7% | -2.2% |
| Oxford United | 24.5% | 11/4 | 26.7% | -2.2% |
| Portsmouth | 33.2% | 2/1 | 33.3% | -0.1% |
| Fleetwood Town | 27.8% | 5/2 | 28.6% | -0.8% |
Recommended Bets
No selection
