Following the previous posts detailing how I have created a betting a model using expected goals data, link below, and predictions for the League One and League Two play-offs it’s the last of the trilogy for this season and time to predict the outcome of the Championship play-offs.
https://eflnumbers.wordpress.com/2020/06/11/how-to-create-a-betting-model-using-expected-goals-data/
The Championship was also Coronavirus impacted season, like the other the EFL leagues, however unlike the other EFL leagues this one did reach a conclusion with all 24 teams playing the complete set of fixtures.
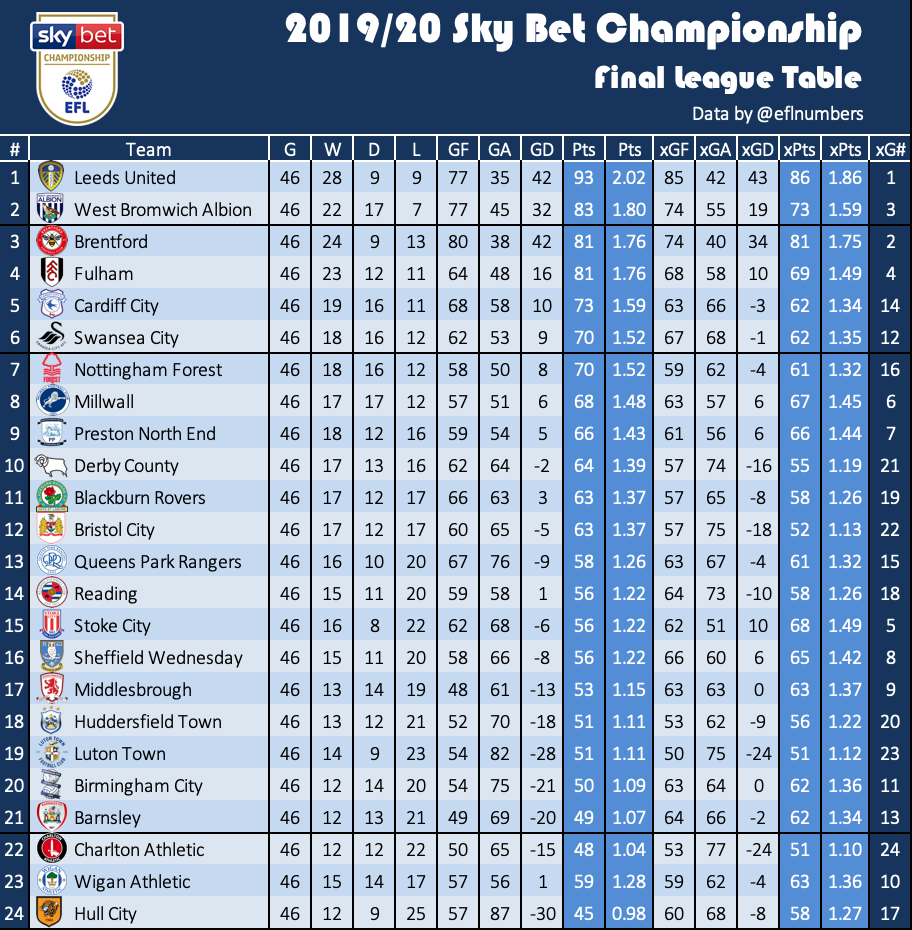
Leeds United were the Champions and right so (ranked the best team by my expected goals model). They should have been promoted 12 months earlier though. Runners up were West Bromwich Albion and no one will begrudge them that given they spent a large majority of the season in pole position. They ranked as the third best side in the league.
The next four teams were separated by 11 points with Brentford, Fulham, Cardiff City and Swansea City the teams still facing an opportunity to reach the promised land and the riches of the Premier League.
Brentford
| # | Team | G | W | D | L | GF | GA | GD | Pts | PPG | xGF | xGA | xGD | xPts | xPPG | xG# |
| 3 | Brentford | 46 | 24 | 9 | 13 | 80 | 38 | 42 | 81 | 1.76 | 74 | 40 | 34 | 81 | 1.75 | 2 |
Brentford finished 3rd two points behind West Brom in the end with a win in either of the last two games good enough for an automatic spot. According to my expected goals model Brentford are the clear second best side in the league (behind Leeds United) and are the strongest of the play-off quartet. Brentford had the second best defence (ranked 1st by xG) and the highest scoring attack (joint second best by xG).
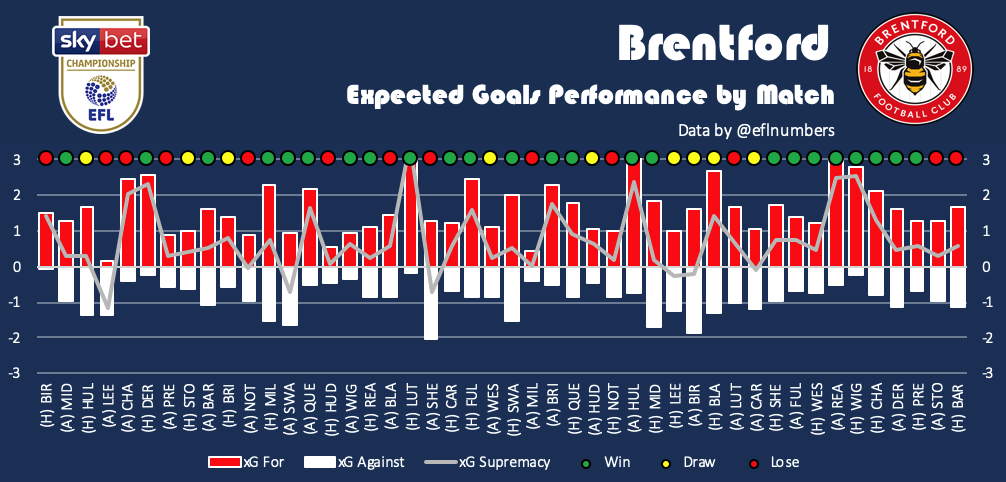
Brentford’s automatic chances were badly hampered by the slow start. The Bees essentially spent the first 3 months in the bottom half before their form picked up. The performance of the season came in the home match against Luton Town (won 7-0) and they weren’t dominated. They were 4th going into the enforced break and had no right to have a chance of the automatic spots before 7 consecutive wins put them right up there. Performances away to Reading (won 3-0) and home to Wigan Athletic (won 3-0) were of particular note.
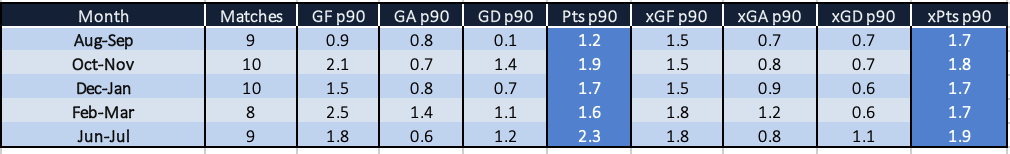
The Aug-Sep period of 9 games at the start of the season picked up just 1.2 points per game, let down by a lack of goals. The rest of the season was fairly strong before the post lockdown period went up a level with a W-D-L record of 7-0-2. It’s interesting to note that the expected goals performance was consistent throughout.

Thomas Frank only tried two formations all season, a 3-4-3 or a 4-3-3. The season started with 8 games in a 3-4-3 formation with a W-D-L record of 2-2-4. The expected goals data shows they deserved more and didn’t take the chances they created. From thereafter it was almost exclusively 4-3-3. The expected goals data shows they gave up more chances on average but more importantly created more. The expected points was only slightly higher but the actual points on the board was 2 points per game. If only they started the season in a 4-3-3.
Fulham
| # | Team | G | W | D | L | GF | GA | GD | Pts | PPG | xGF | xGA | xGD | xPts | xPPG | xG# |
| 4 | Fulham | 46 | 23 | 12 | 11 | 64 | 48 | 16 | 81 | 1.76 | 68 | 58 | 10 | 69 | 1.49 | 4 |
Fulham only had an outside chance of getting an automatic spot and just failed in the end. They finished in fourth exactly where the expected goals model placed them but finished the season well.
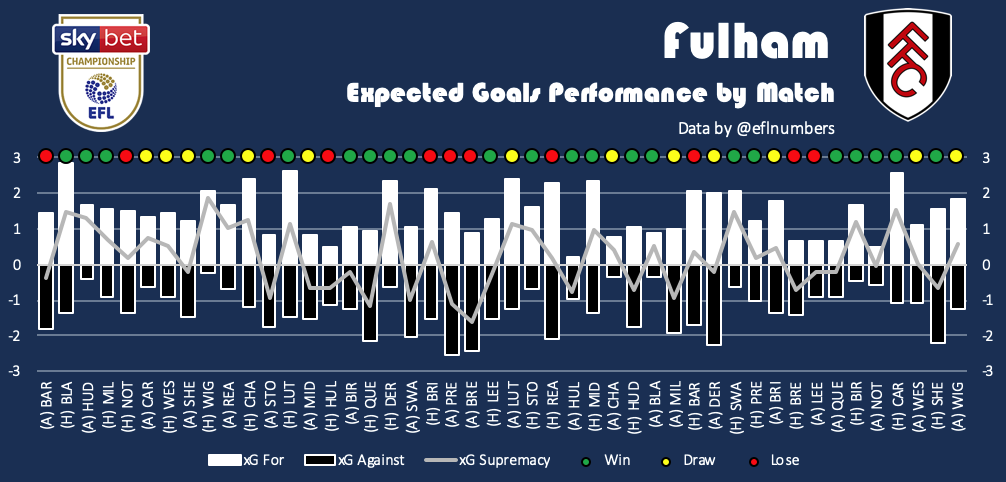
Fulham have spent a large section of the season in the play-offs. The Cottagers were in 12th following the early period of four winless games (3 draws and 1 defeat) but bounced back strongly. The following game at home to Wigan Athletic (won 2-0) was the best performance of the season.
The initial August – September ultimately ended in a W-D-L record of 4-3-2 and was the best expected goals performance all season. Thereafter the defence gave up more chances on average and consequently conceded more goals. The post lockdown June to July months was when the Cottagers created the poorest quality of chances.
Scott Parker started the season in a 4-3-3 formation which was largely used throughout. Come the end of the season it was the 4-2-3-1 formation which was used. Performance was largely similar with the 4-3-3 picking up slightly more points per game. Expected goals data would indicate that the 4-2-3-1 formation is the superior due to the fewer quality chances conceded.
Cardiff City
| # | Team | G | W | D | L | GF | GA | GD | Pts | PPG | xGF | xGA | xGD | xPts | xPPG | xG# |
| 5 | Cardiff City | 46 | 19 | 16 | 11 | 68 | 58 | 10 | 73 | 1.59 | 63 | 66 | -3 | 62 | 1.34 | 14 |
Cardiff City would have settled for 6th coming out of lockdown but ultimately finished in 5th due to a good run of form towards the end of the season. Although they finished in the play-offs spots the expected goals data only ranks them as the 14th best team in the league and the weakest to make the playoffs. The Bluebirds conceded 58 goals during the season, the highest of the playoff quartet so they will need to improve defensively, xG implies they should have conceded 66.
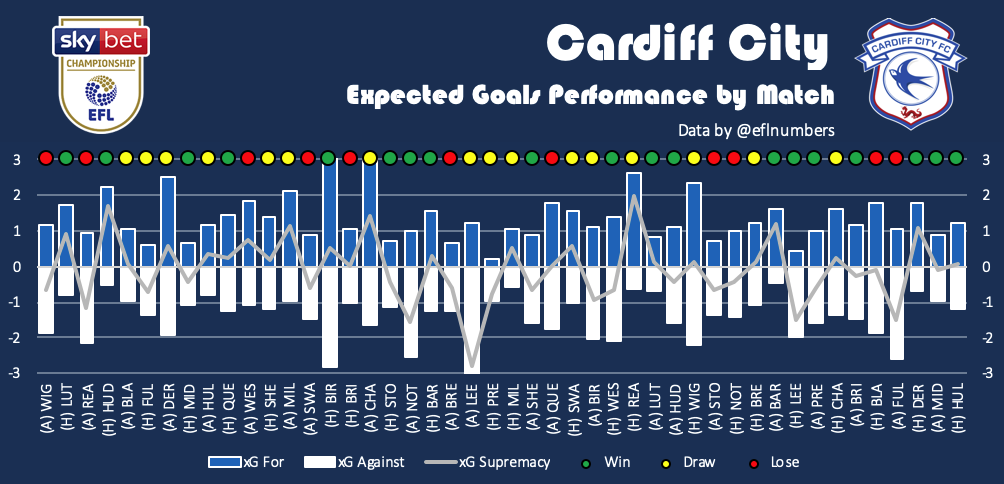
Cardiff’s start to the season was mixed and predominately spent in the bottom half resulting in Neil Warnock losing his job in November after defeat against Bristol City. The problem this season has been the good performances haven’t resulted in three points. Even in the post Warnock era both the visit to Charlton Athletic and the home game against Reading should have been comfortable wins but ended all square.
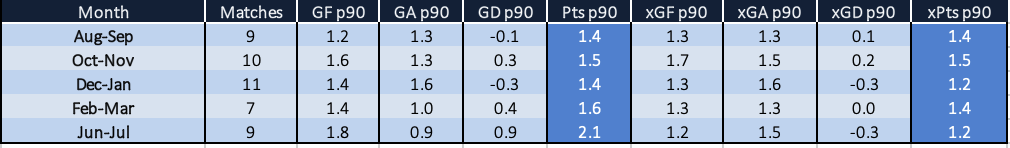
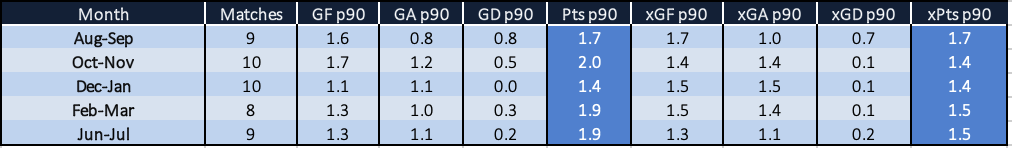
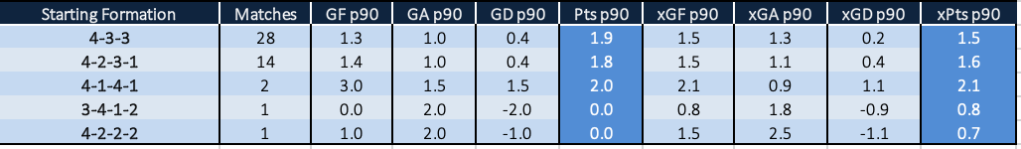
On the whole though many will say that Neil Harris has done a good job though, epitomised by the post lockdown form. The 9 game period in June and July resulted in a W-D-L record of 7-1-2. 2.1 points per game is Champions standard. The negative is that although results improved the process didn’t. Expected goals indicates Harris’ Cardiff were actually poorer than in Warnock’s time.
Both Warnock and Harris favoured the 4-2-3-1 formation but it’s interesting that the 4-3-3 wasn’t used more often. The Bluebirds never lost in 7 games in that setup (3 wins and 4 draws) scoring more and conceding fewer than the 4-2-3-1. Expected goals would back up that it’s the better formation.
Swansea City
| # | Team | G | W | D | L | GF | GA | GD | Pts | PPG | xGF | xGA | xGD | xPts | xPPG | xG# |
| 6 | Swansea City | 46 | 18 | 16 | 12 | 62 | 53 | 9 | 70 | 1.52 | 67 | 68 | -1 | 62 | 1.35 | 12 |
The last team of the play-off quartet did not finalise their place until injury time on the final day. The expected goals model indicating they shouldn’t have been this close, ranked at just 12th. They scored the fewest of the play-off hopefuls but xG does indicate they underperformed on that front. It was defensively where the goals conceded should have been 15 higher.
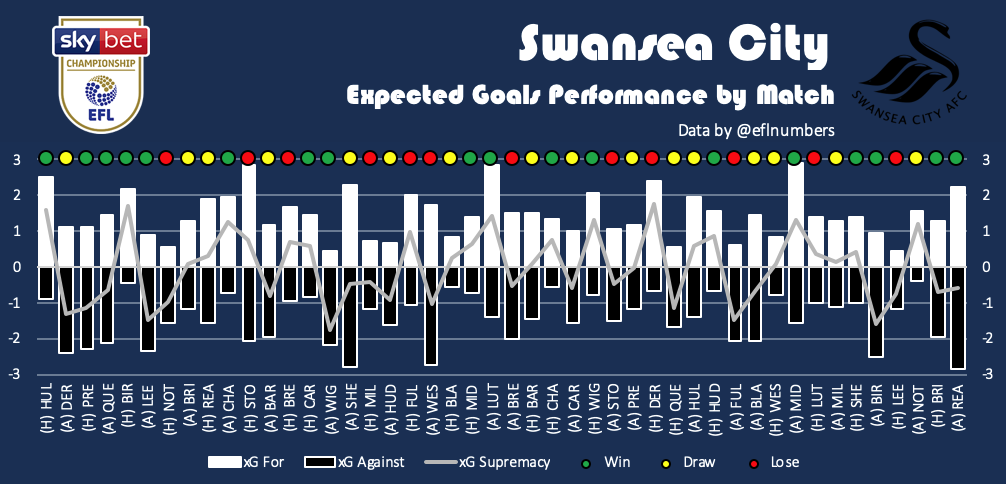
The Swans flew out of the traps ending August in 1st with a W-D-L record of 5-1-0 including an impressive salvo in the 2-0 win against Hull City on the opening day. They gradually slipped thereafter dropping to a low of 11th before rebounding into the play-offs following some late drama.
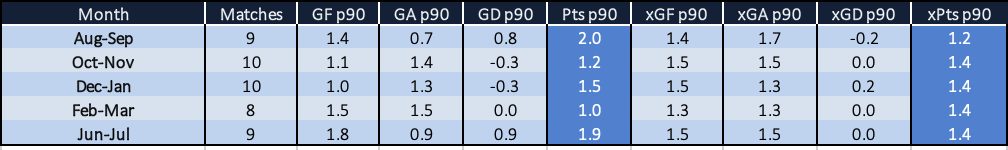
The season was bookended in terms of points per game with a strong start and a strong finish. The first spell helped by a strong defence and the second spell by free flowing scoring. Interestingly though the expected goals have been constant throughout. The opening two months was actually the poorest in terms of expected points due to the quality of chances conceded.
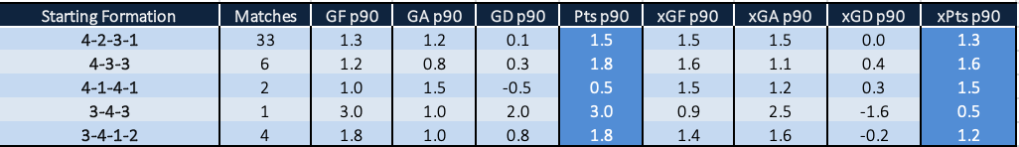
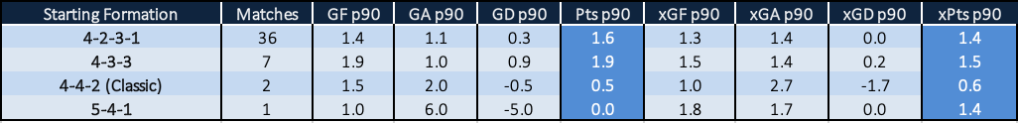
The 4-2-3-1 formation was the favourite, but similar to Cardiff City, it’s surprising the 4-3-3 wasn’t used more often. The 4-3-3 was used in a 6 game consecutive period in December/January and yielded 11 points (3 wins, 2 draws and 1 defeat) with expected goals also highlighting the strength of the alternative.
Swansea City (6th) v Brentford (3rd)
The play-offs kick off on Sunday evening with Swansea City hosting Brentford at the Liberty Stadium before the return leg at the Griffin Park three days later.
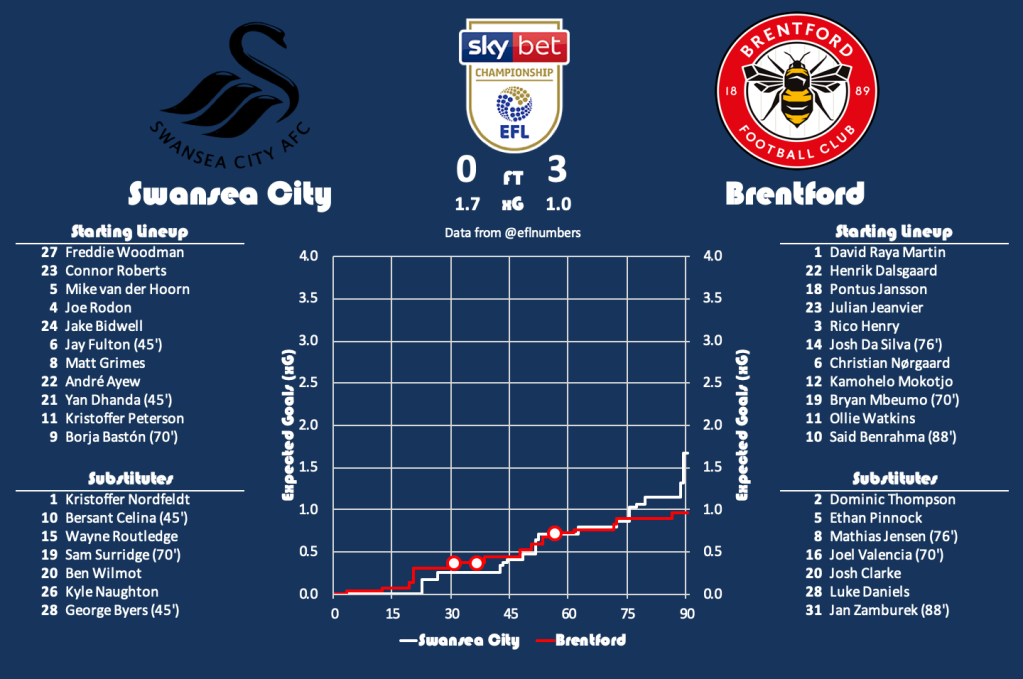
Swansea played host on the 22nd October 2019 in a 3-0 win for the Bees but the expected goals data indicated Swansea created the better chances that day.
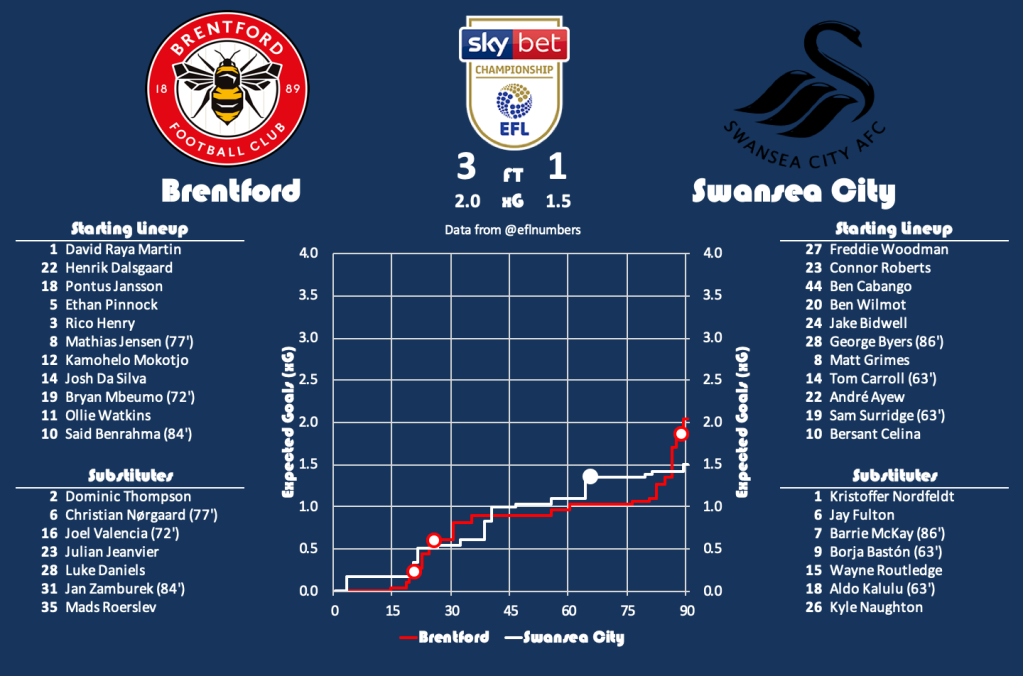
The return leg on the 26th December 2019 also saw a Bees victory, 3-1 this time, but again the expected goals data had the match closer than the final score.
Finishing 2nd (Brentford) and 12th (Swansea City) in my expected goals table implies both of these teams season should have been already over but that’s football and both now have an opportunity to reach Wembley. To calculate the expected match probabilities I use a rolling 46 game season of data to estimate the strength of each team.
A poisson distribution estimates the following probabilities for the number of combined goals scored across the ties.
| 0 | 1 | 2 | 3 | 4 | 5 | 6 | |
| Brentford | 3% | 10% | 18% | 21% | 19% | 13% | 8% |
| Swansea City | 15% | 28% | 27% | 17% | 8% | 3% | 1% |
My model has Brentford as the strong favourites to make the final, even more likely than forecasted than the bookmakers, and therefore this is the value play.
| Modelled Probability | Bookmakers Odds | Bookmakers Probability | Difference | |
| Brentford | 77.9% | 4/11 | 73.3% | 4.6% |
| Swansea City | 22.1% | 9/4 | 30.8% | -8.7% |
Fulham (4th) v Cardiff City (5th)
The first legs concludes with Fulham travelling to Cardiff on Monday with the reverse leg three days later at Craven Cottage Park.
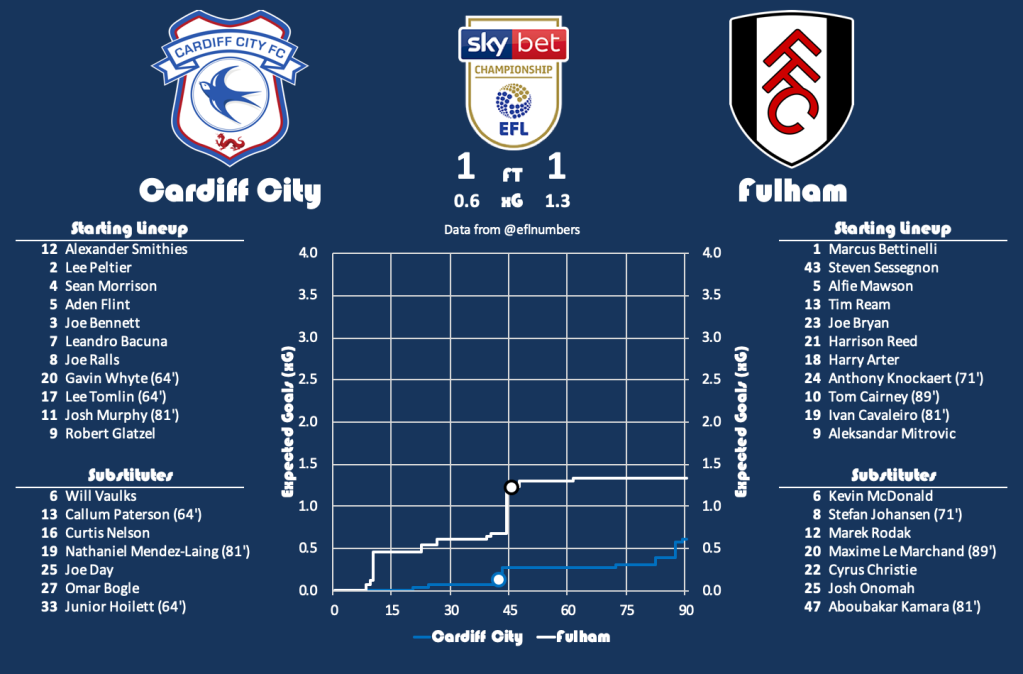
The first head to head to head saw Cardiff City as the hosts in a 1-1 draw on the 30th August 2019. Fulham shaded it that day with Cardiff creating very little.
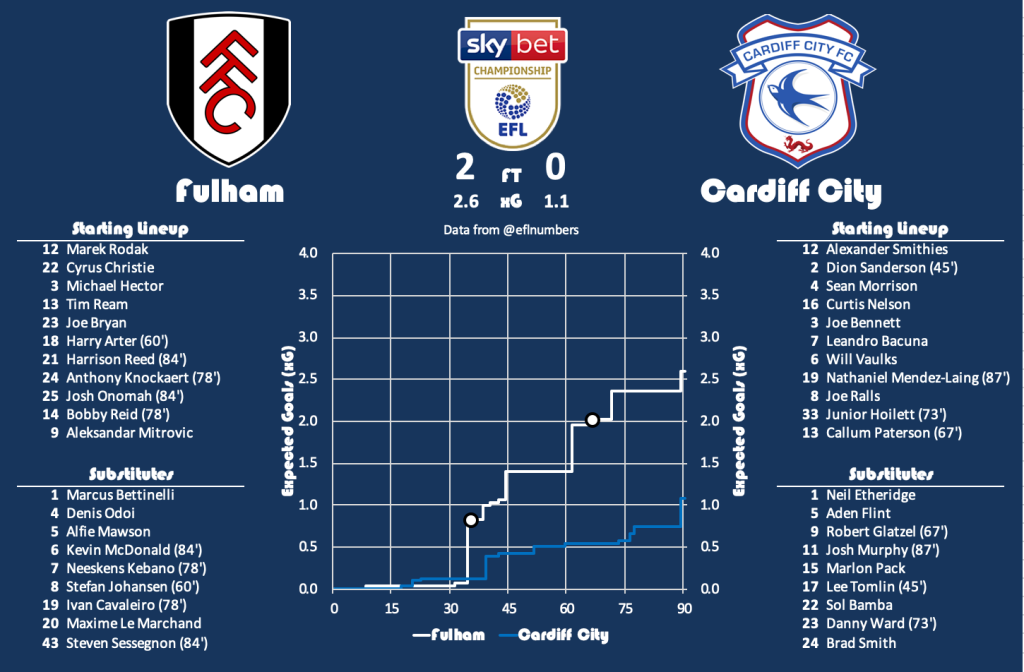
The second game was more open with Fulham running out 2-0 winners at Craven Cottage. After a quiet first 30 minutes Fulham broke the dreadlock and were deserved winners thereafter.
4th (Fulham) plays 14th (Cardiff City) based on my expected goals and this match is almost as one sided as the other match. As per the other play-off I will calculate the expected match probabilities using a rolling 46 game season of data to estimate the strength of each team.
A poisson distribution estimates the following probabilities for the number of combined goals scored across the ties.
| 0 | 1 | 2 | 3 | 4 | 5 | 6 | |
| Fulham | 4% | 13% | 21% | 22% | 18% | 11% | 6% |
| Cardiff City | 8% | 20% | 25% | 22% | 14% | 7% | 3% |
The model rates Fulham as the favourites to reach Wembley, slightly more than the bookmakers, but is not above the 3% threshold for a betting selection and therefore nothing is advised.
| Modelled Probability | Bookmakers Odds | Bookmakers Probability | Difference | |
| Fulham | 60.3% | 8/11 | 57.9% | 2.4% |
| Cardiff City | 39.7% | 11/10 | 47.6% | -7.9% |
Outright
Given how the expected goals data rates it is not surprise it forecasts the final to be Brentford against Fulham. The model thinks Brentford are the right favourites with a 55% chance but thinks there is huge value in the price. The hierarchy of the remaining teams match those of the bookmakers but they are all equally bad value.
| Modelled Probability | Bookmakers Odds | Bookmakers Probability | Difference | |
| Brentford | 54.9% | 6/4 | 40.0% | 14.9% |
| Fulham | 22.8% | 12/5 | 29.4% | -6.6% |
| Cardiff City | 12.1% | 9/2 | 18.2% | -6.1% |
| Swansea City | 10.2% | 5/1 | 16.7% | -6.4% |
Recommended Bets
Brentford to qualify for Wembley (4/11)
Brentford to be promoted (6/4)
